Quick onboard
Deployment
Data Modeling
Connecting
Migration
Query
Operations and Maintenance
Common Maintenance
Partition
Backup and Restore
Expansion
Mirroring
Resource Groups
Security
Monitoring
Performance Tuning
Troubleshooting
Reference Guide
Tool guide
Data type
Storage Engine
Executor
Stream
DR (Disaster Recovery)
Configuration
Index
Extension
SQL Reference
YMatrix provides a custom-built exporter that seamlessly integrates with the Prometheus monitoring ecosystem.
Note that the YMatrix exporter and its corresponding dashboards cover only database-level metrics, not operating system metrics. OS-level monitoring requires additional exporters such as node_exporter. The architecture is illustrated below:

The YMatrix exporter is included in the YMatrix installation package and can be activated upon setup. After activation, install and deploy node_exporter, Grafana, and Prometheus.
createdb matrixmgr;psql -d matrixmgr
matrixmgr=# CREATE EXTENSION matrixts;
matrixmgr=# CREATE EXTENSION matrixmgr;
matrixmgr=# SELECT mxmgr_init_exporter(); Upon success, a new schema named "exporter" will appear in the matrixmgr database. This schema contains tables and views with cluster monitoring and configuration data. Do not modify the definitions or contents of these tables and views.
This command starts matrixdb_exporter on all hosts in the cluster.
Note!
If the legacy monitoring system is already running, disable it first; otherwise, activation will fail.
To disable:SELECT mxmgr_remove_all('local');
node_exporter monitors OS-level metrics. Download the latest version from the official site: node_exporter. The following example uses version 1.3.1 (run as root).
# Download node_exporter
wget https://github.com/prometheus/node_exporter/releases/download/v1.3.1/node_exporter-1.3.1.linux-amd64.tar.gz

# Extract the package
tar -xvf node_exporter-1.3.1.linux-amd64.tar.gz -C /usr/local

# Create a symbolic link
ln -s /usr/local/node_exporter-1.3.1.linux-amd64/ /usr/local/node_exporter

# Generate systemctl configuration file
cat << EOF > /usr/lib/systemd/system/node_exporter.service
[Service]
User=root
Group=root
ExecStart=/usr/local/node_exporter/node_exporter

[Install]
WantedBy=multi-user.target

[Unit]
Description=node_exporter
After=network.target

EOF

# Start node_exporter
systemctl start node_exporter
systemctl status node_exporter
systemctl enable node_exporter
Note!
node_exportermust be deployed on all cluster hosts. Repeat the above steps on each host.
Select a host that can access the exporter ports on all cluster nodes. This can be the Master, Standby Master, or a separate machine (Linux, MacOS, Windows, etc.).
Install the latest version of Prometheus. Official download link: https://prometheus.io/download/.
The following commands use CentOS 7 as an example. For other operating systems, refer to their respective guides.
Note!
During installation, you may choose whether to install the mxgate monitoring interface. The example below includes code for mxgate monitoring. Remove the relevant section if mxgate monitoring is not needed. See comments in the example.
# Download package
wget https://github.com/prometheus/prometheus/releases/download/v2.36.1/prometheus-2.36.1.linux-amd64.tar.gz
# Extract to /usr/local and create symbolic link
tar -xf ./prometheus-2.36.1.linux-amd64.tar.gz -C /usr/local
ln -s /usr/local/prometheus-2.36.1.linux-amd64/ /usr/local/prometheus
# Create Prometheus user
useradd -s /sbin/nologin -M prometheus
# Create data directory
mkdir /data/prometheus -p
# Set ownership
chown -R prometheus:prometheus /usr/local/prometheus/
chown -R prometheus:prometheus /data/prometheus/
# Configure systemctl
cat << EOF > /etc/systemd/system/prometheus.service
 [Unit]
 Description=Prometheus
 Documentation=https://prometheus.io/
 After=network.target
 [Service]
 Type=simple
 User=prometheus
 ExecStart=/usr/local/prometheus/prometheus --config.file=/usr/local/prometheus/prometheus.yml --storage.tsdb.path=/data/prometheus
 Restart=on-failure
 [Install]
 WantedBy=multi-user.target
EOF
# Edit Prometheus configuration file
# Add matrixdb and node exporter IPs and ports in scrape_configs
# (matrixdb_exporter default port: 9273, node_exporter default port: 9100)
# Note: matrixdb and mxgate dashboards use the matrixdb_cluster label for cluster filtering.
# Add relabel_configs to replace the job label with matrixdb_cluster.
# Set 'replacement' to your cluster name.
# Example configuration:
scrape_configs:
  - job_name: "matrixdb_exporter"
    relabel_configs:
      - source_labels: ['job']
        regex: .*
        target_label: matrixdb_cluster
        replacement: cluster1
        action : replace
    static_configs:
      - targets: ["localhost:9273"]
  - job_name: "node_exporter"
    static_configs:
      - targets: ["localhost:9100"]
# For multi-host clusters, list all host IPs and ports in targets:
# Example:
scrape_configs:
  - job_name: "matrixdb_exporter"
    relabel_configs:
      - source_labels: ['job']
        regex: .*
        target_label: matrixdb_cluster
        replacement: cluster1
        action : replace
    static_configs:
    - targets: ["192.168.0.1:9273", "192.168.0.2:9273", "192.168.0.3:9273"]
  - job_name: "node_exporter"
    static_configs:
    - targets: ["192.168.0.1:9100", "192.168.0.2:9100", "192.168.0.3:9100"]
# Optional: Add the following section to monitor mxgate. Restart Prometheus after adding.
  - job_name: "gate_exporter"
    relabel_configs:
      - source_labels: ['job']
        regex: .*
        target_label: matrixdb_cluster
        replacement: cluster1
        action : replace
    static_configs:
      - targets: ["192.168.0.1:9275"]
# Important: Ensure correct indentation in YAML to avoid syntax errors.
# Start Prometheus
systemctl start prometheus
systemctl status prometheus
systemctl enable prometheus
After starting, access the Prometheus WebUI to check the status: http://IP:9090/
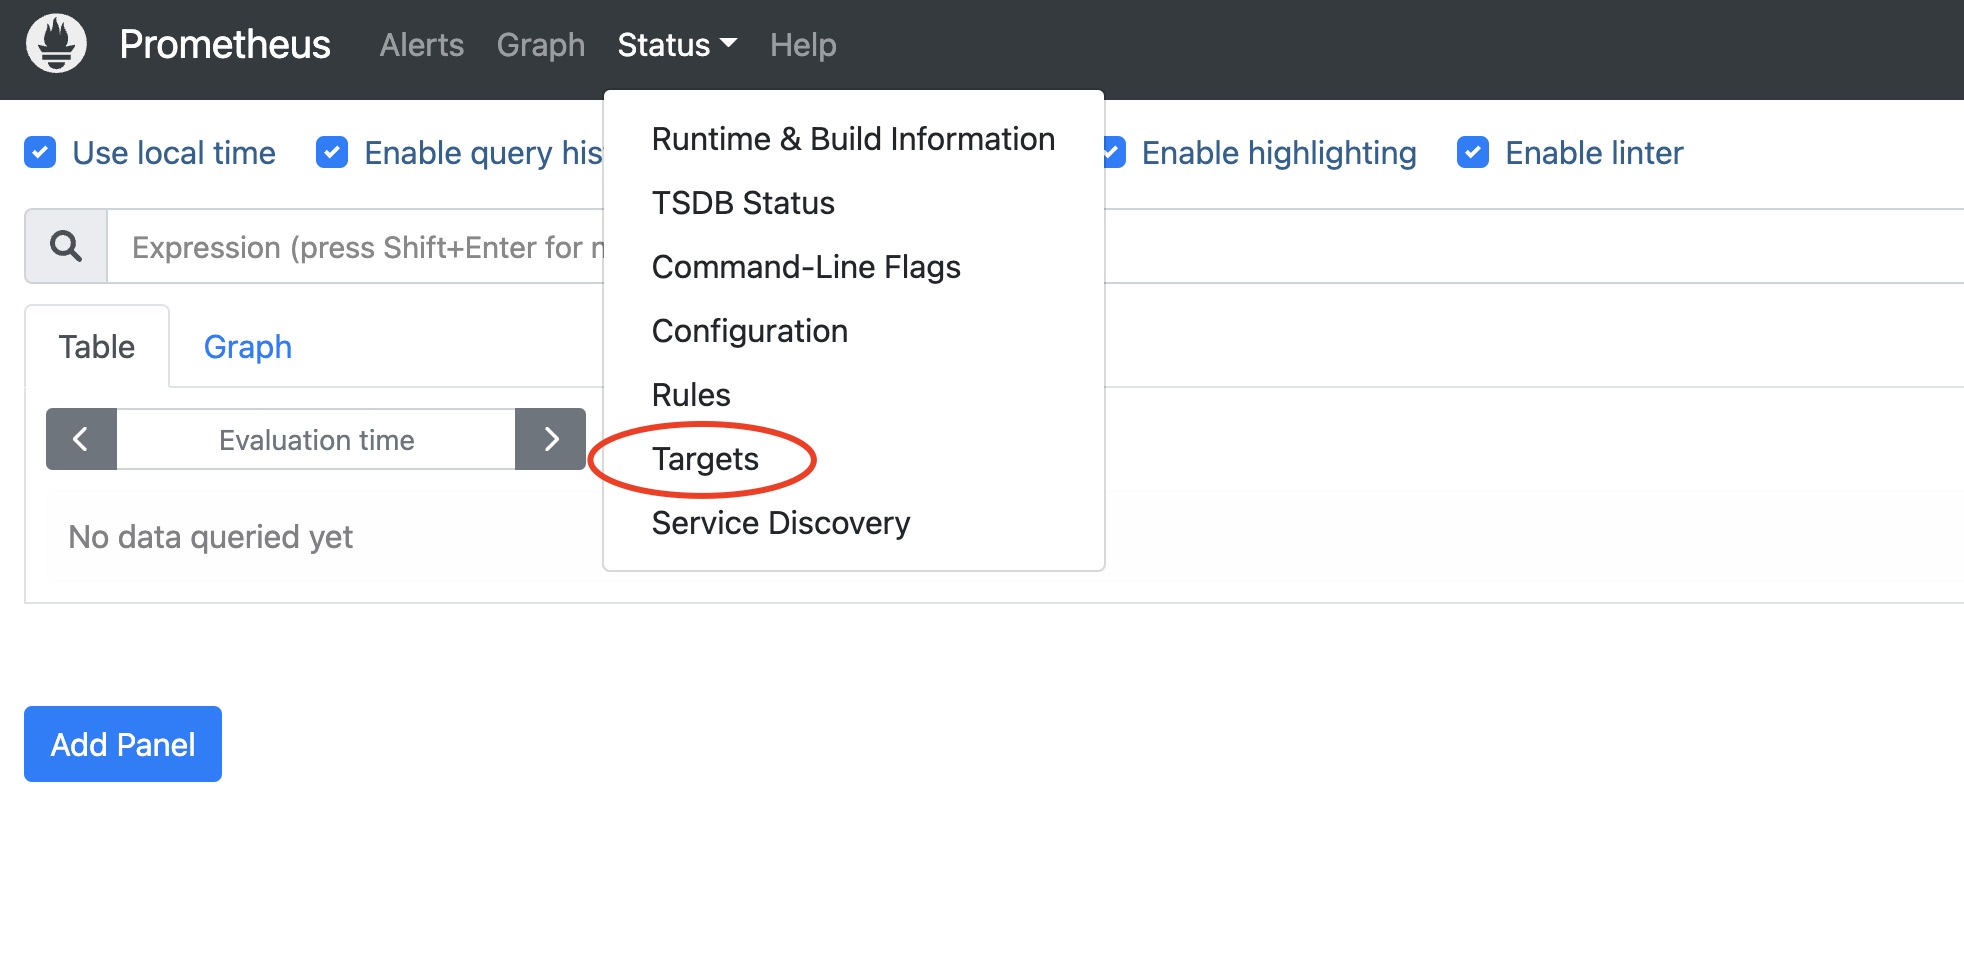
In the Prometheus dashboard, go to Status → Targets:
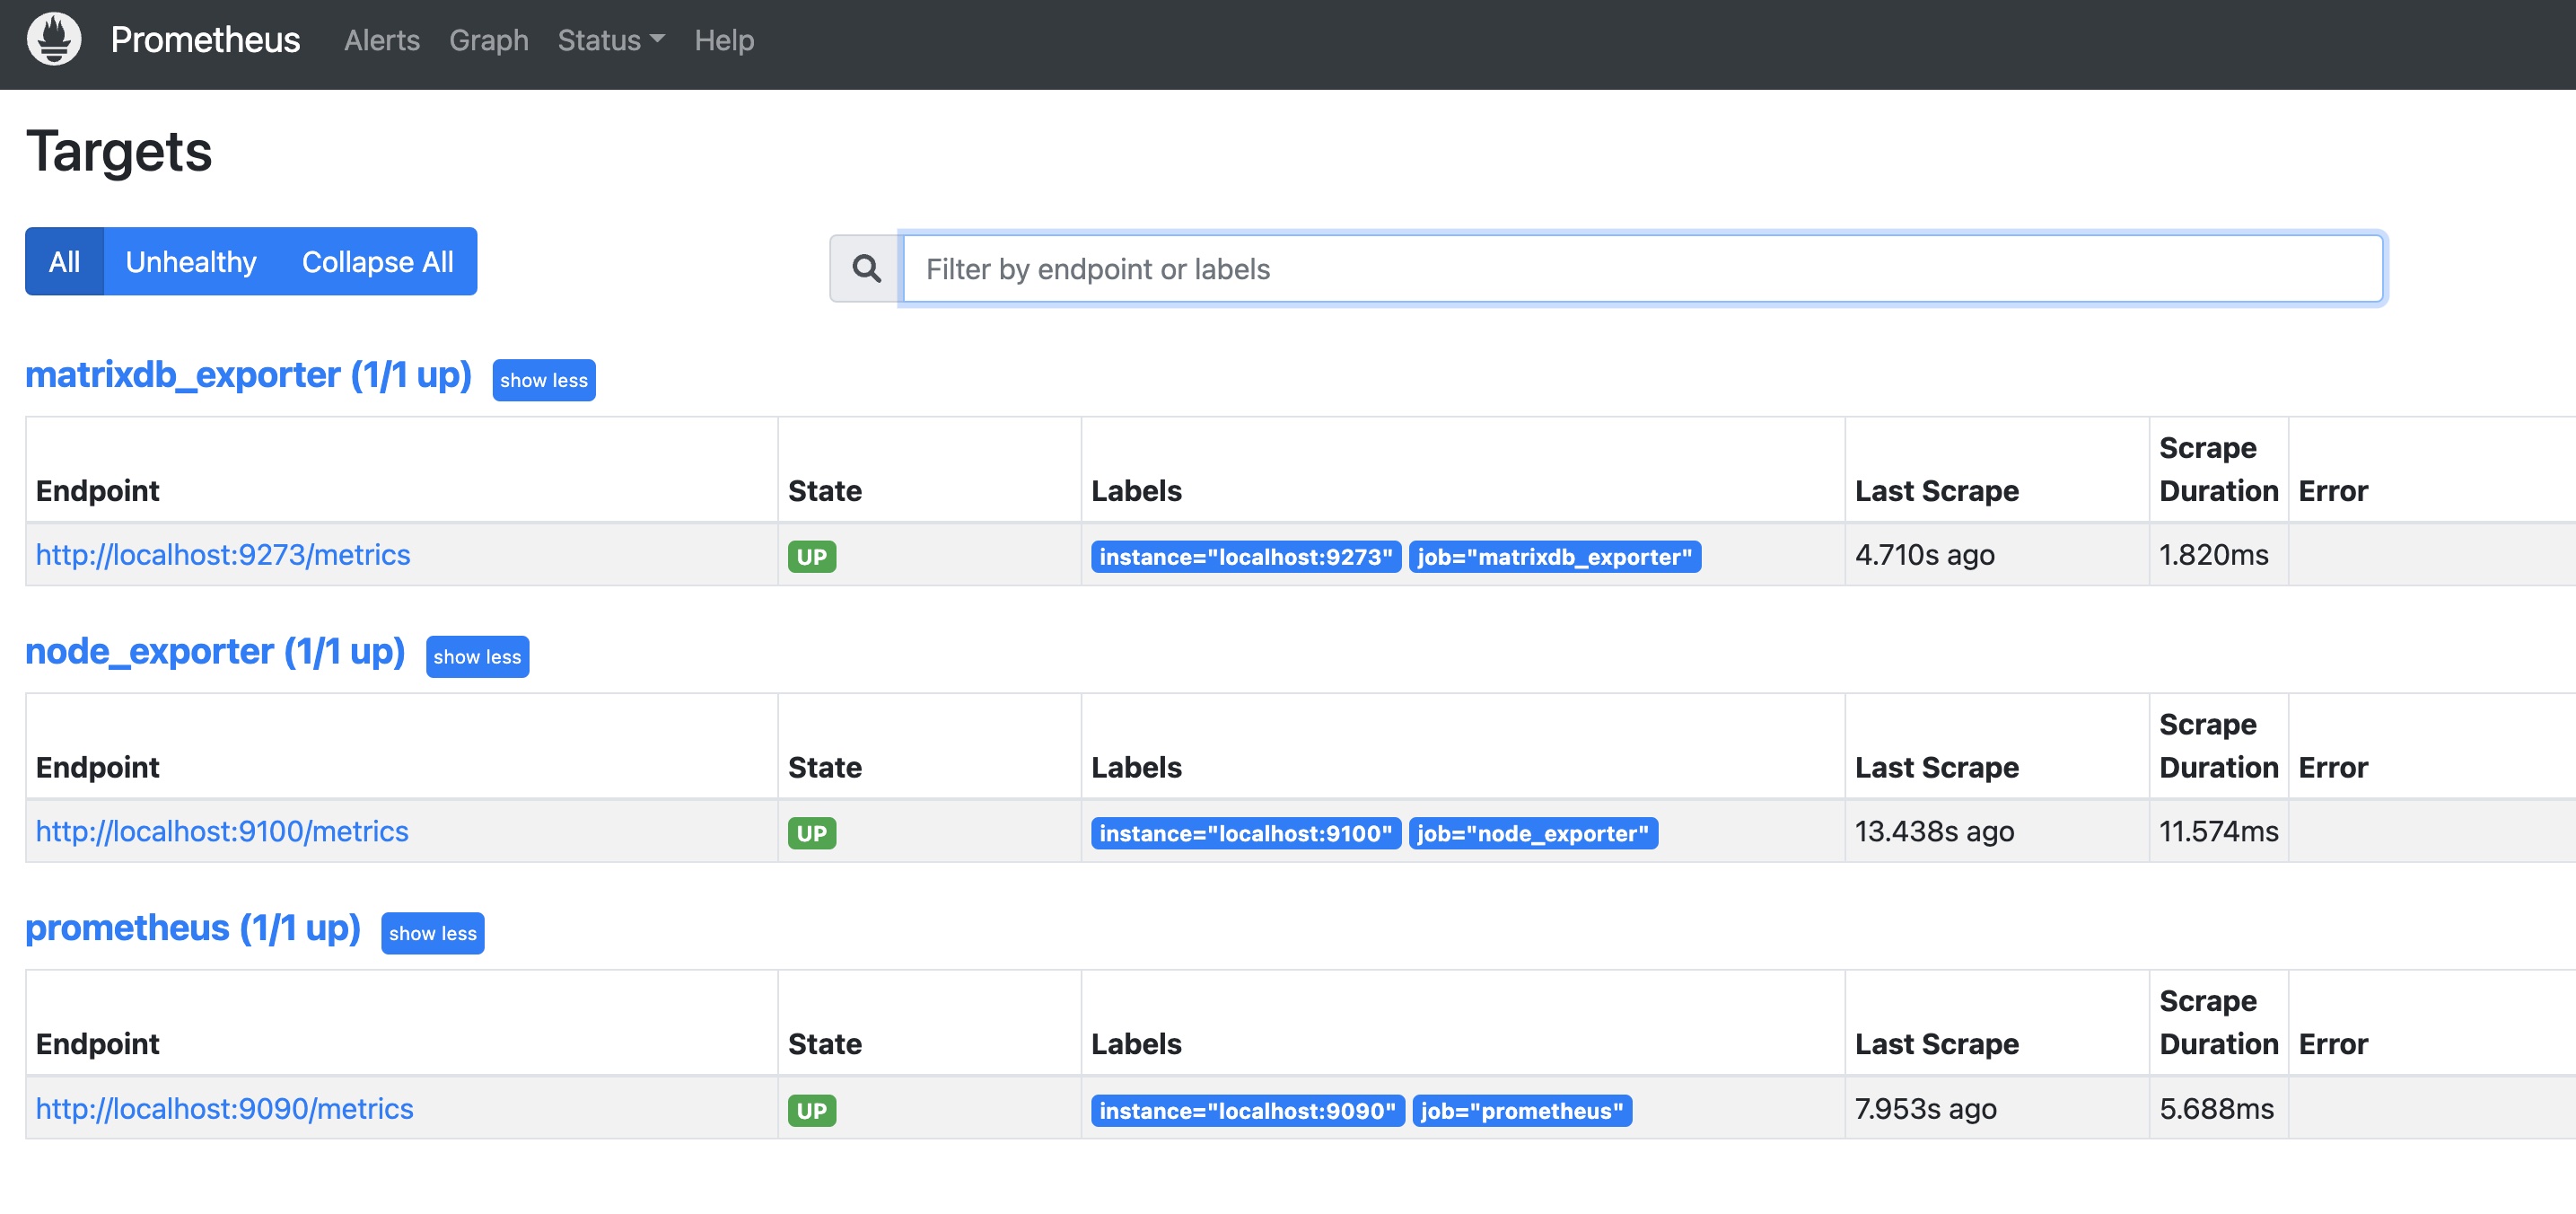
You should see matrixdb_exporter, node_exporter, and Prometheus itself all marked as UP, indicating successful deployment:
After enabling cluster metric collection, each host runs a collection service. Logs are stored under /var/log/matrixdb.
If you restart YMatrix or reboot the server and restart YMatrix, the matrixdb_exporter service will start automatically.
To stop the matrixdb_exporter service, connect to the matrixmgr database and run:
psql -d matrixmgr

matrixmgr=# SELECT mxmgr_remove_exporter();
To re-enable data collection, connect to the matrixmgr database and run:
matrixmgr=# SELECT mxmgr_deploy_exporter();Note!
mxmgr_remove_exporterstops onlymatrixdb_exporter. You must stopnode_exporter, Grafana, and Prometheus separately.
Migrate from the legacy monitoring system to the new Prometheus-based monitoring.
First, complete the Prometheus setup and upgrade Grafana to the latest version:
# Stop legacy monitoring
psql -d matrixmgr
matrixmgr=# SELECT mxmgr_remove_all('local');

# Initialize and start new monitoring
matrixmgr=# SELECT mxmgr_init_exporter();
Note!
You can run both legacy and new monitoring systems simultaneously. However, this results in redundant data collection.