Quick onboard
Deployment
Data Modeling
Connecting
Migration
Query
Operations and Maintenance
Common Maintenance
Partition
Backup and Restore
Expansion
Mirroring
Resource Management
Security
Monitoring
Performance Tuning
Troubleshooting
Reference Guide
Tool guide
Data type
Storage Engine
Executor
Stream
DR (Disaster Recovery)
Configuration
Index
Extension
SQL Reference
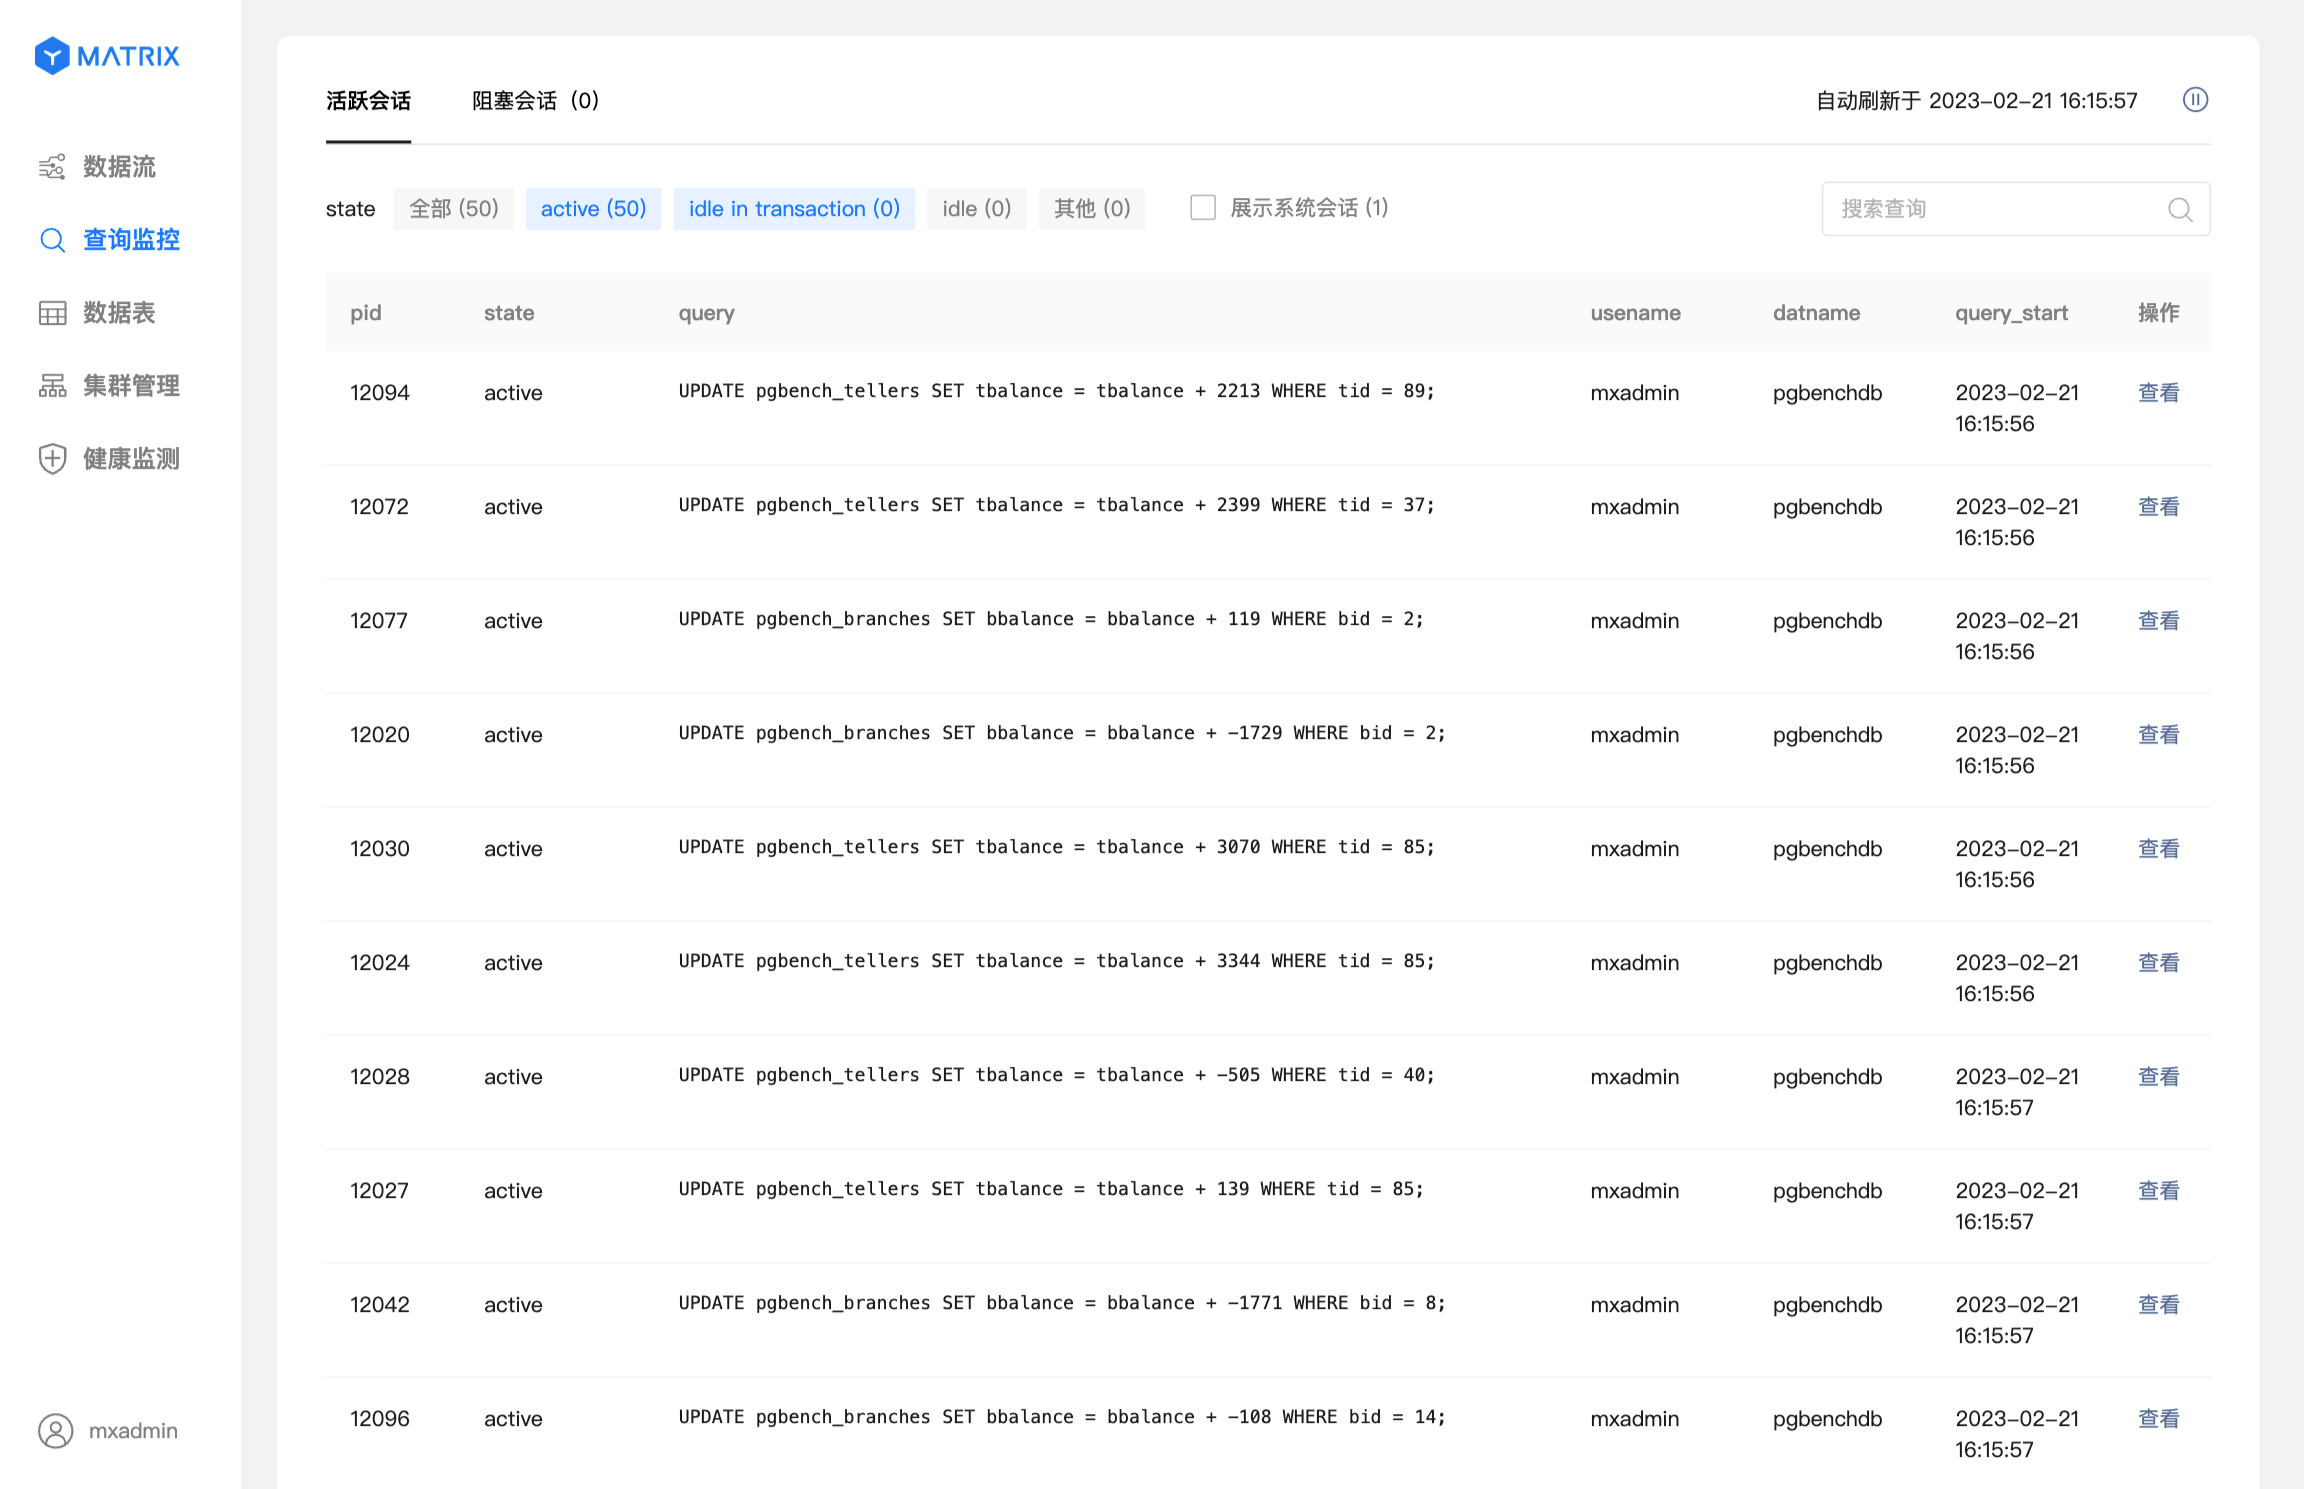
After logging into MXUI, click “Query Monitoring” in the left navigation bar. This will take you to the “Active Sessions” page.
pg_stat_activity and is sorted in reverse chronological order by query_start time by default. The list refreshes automatically every 10 seconds. If you need to examine a specific entry in the list, you can pause the refresh to prevent the automatic refresh function from filtering out the session you are viewing. To reduce the load caused by frequent automatic refreshes, the system will pause the automatic refresh when you exit the query monitoring page.active + idle in transaction states by default. You can click any status in the state status bar to filter the list content. Each status block displays the status + number of sessions in that status.Explanation of
idle in transactionThis status indicates that the query statement has been executed, but the corresponding transaction has not been committed or rolled back. It should be noted that although statements in this status do not occupy CPU and I/O resources, they do occupy connection resources such as connection numbers and concurrency numbers. At the same time, the locks held by each query in the transaction will not be released until the corresponding transaction is committed or rolled back. During this period, most queries involving the tables related to the transaction will be blocked, which will affect the response speed of the service. If a transaction remains in theidle in transactionstate for an extended period (e.g., over an hour), it is recommended to commit or roll back the transaction promptly.
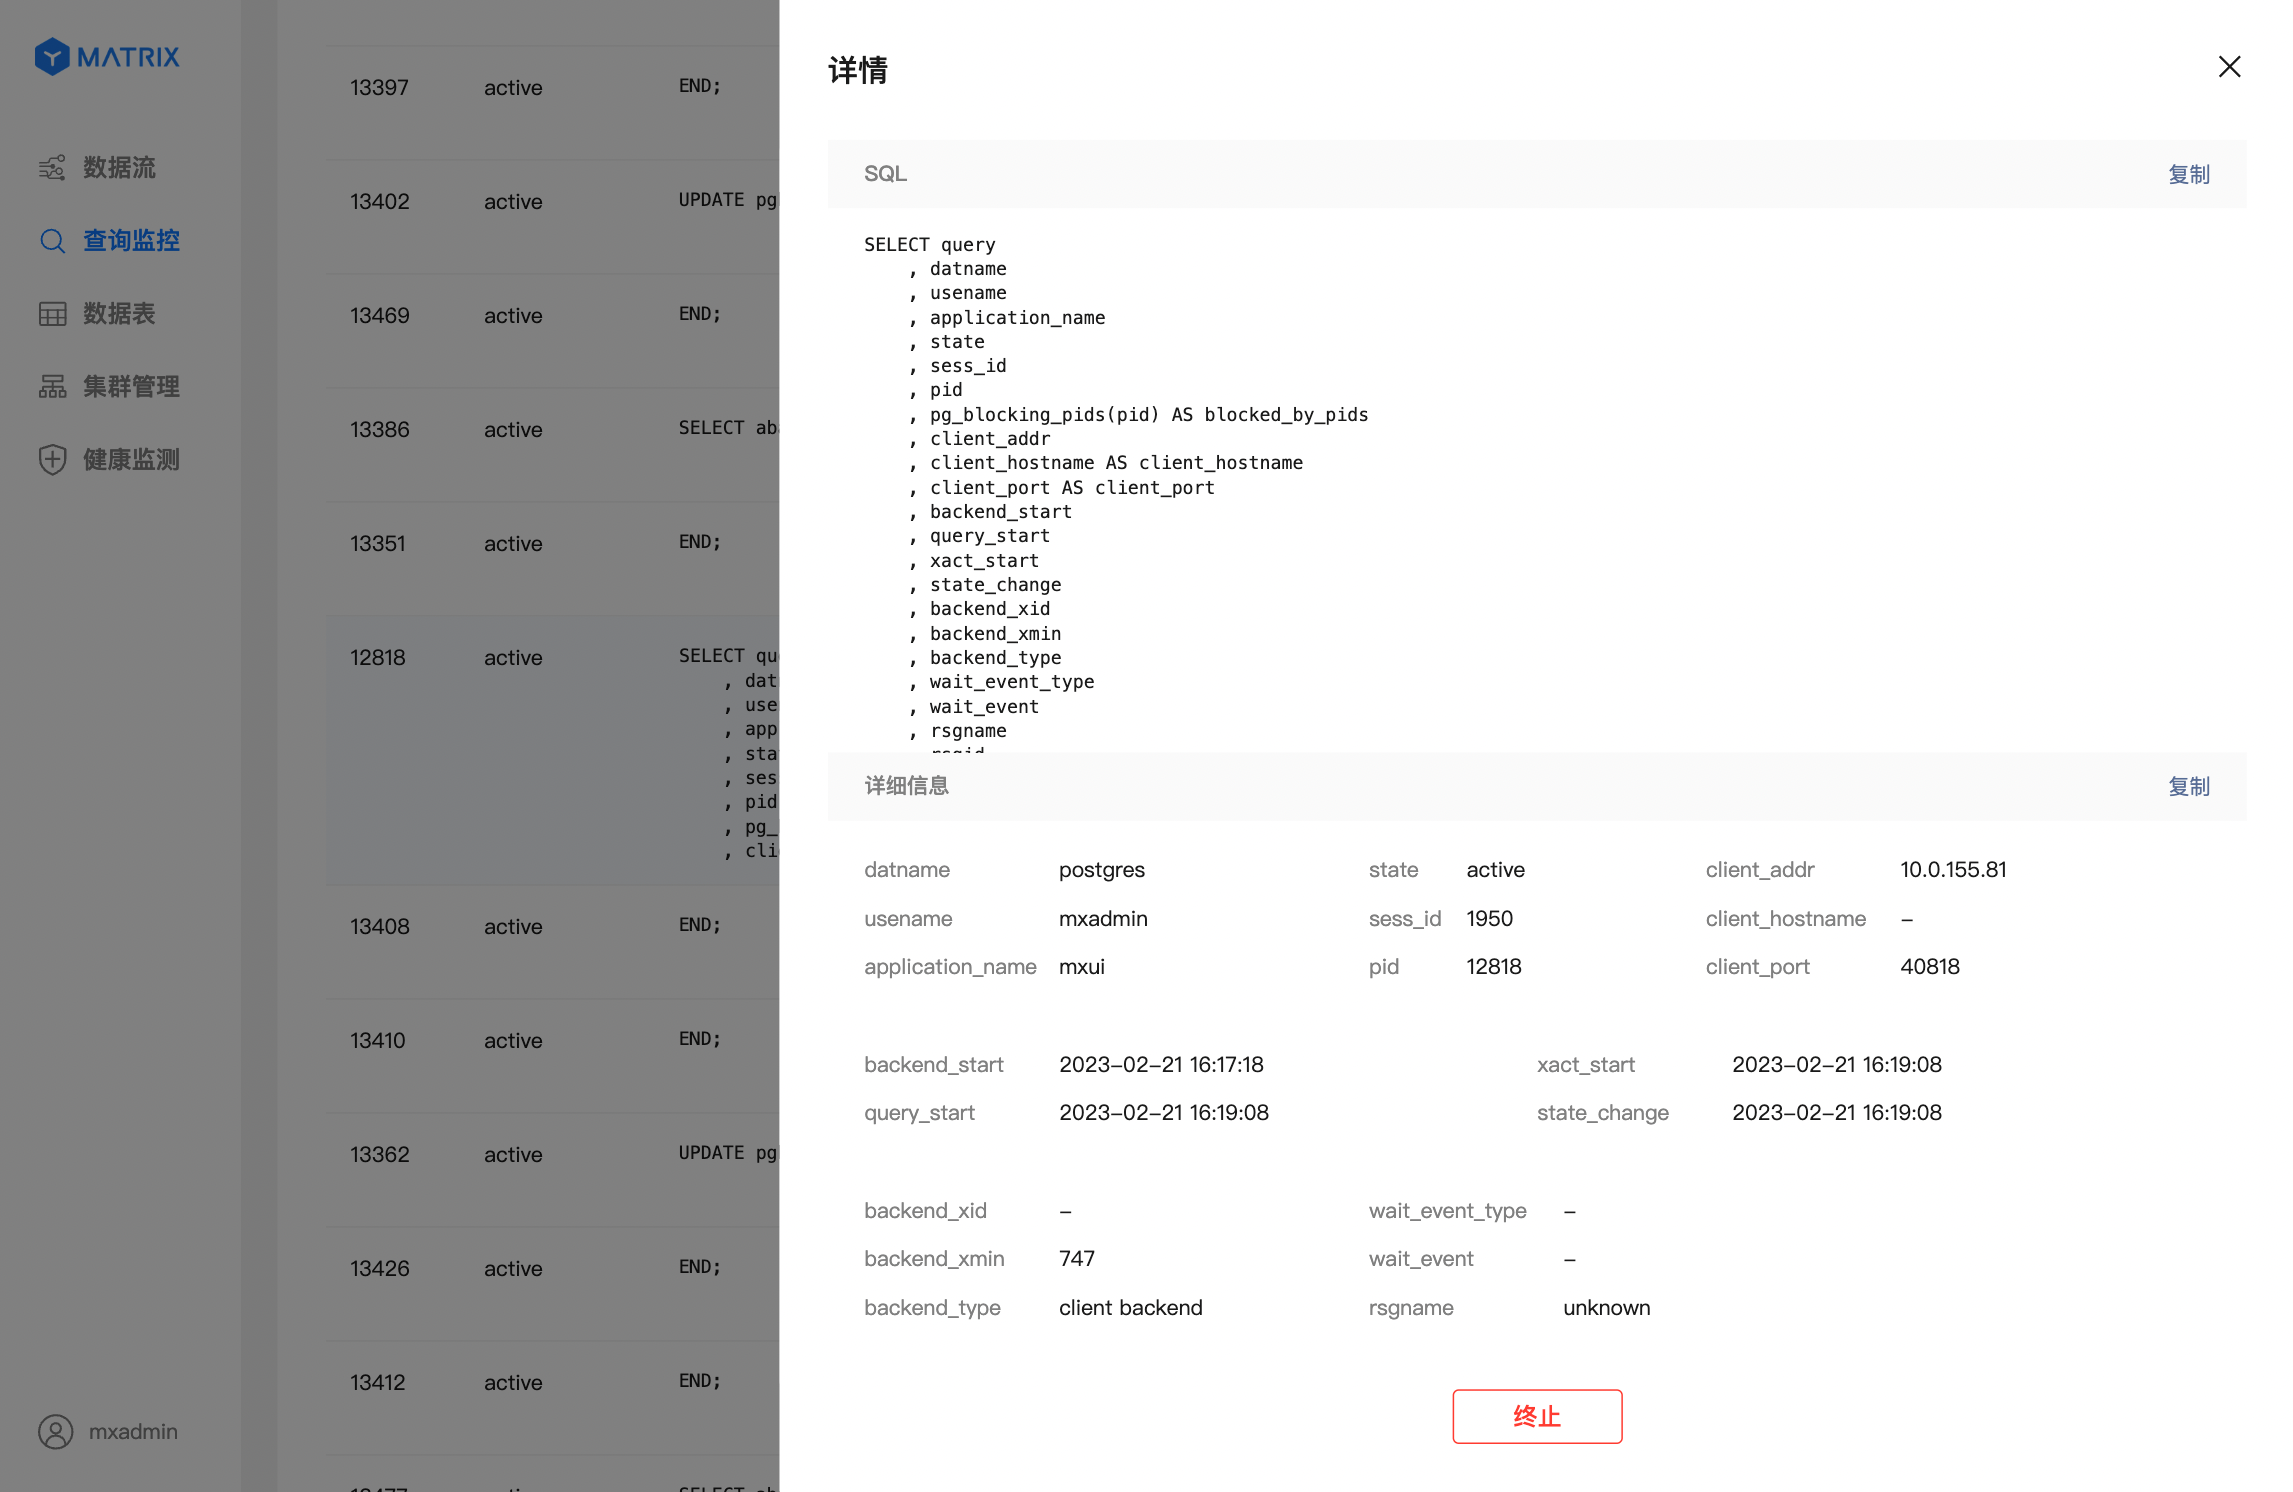
Click the “View” button on the right side of the target session to open the query details page, which displays all field information from the pg_stat_activity table for that query and supports session termination.
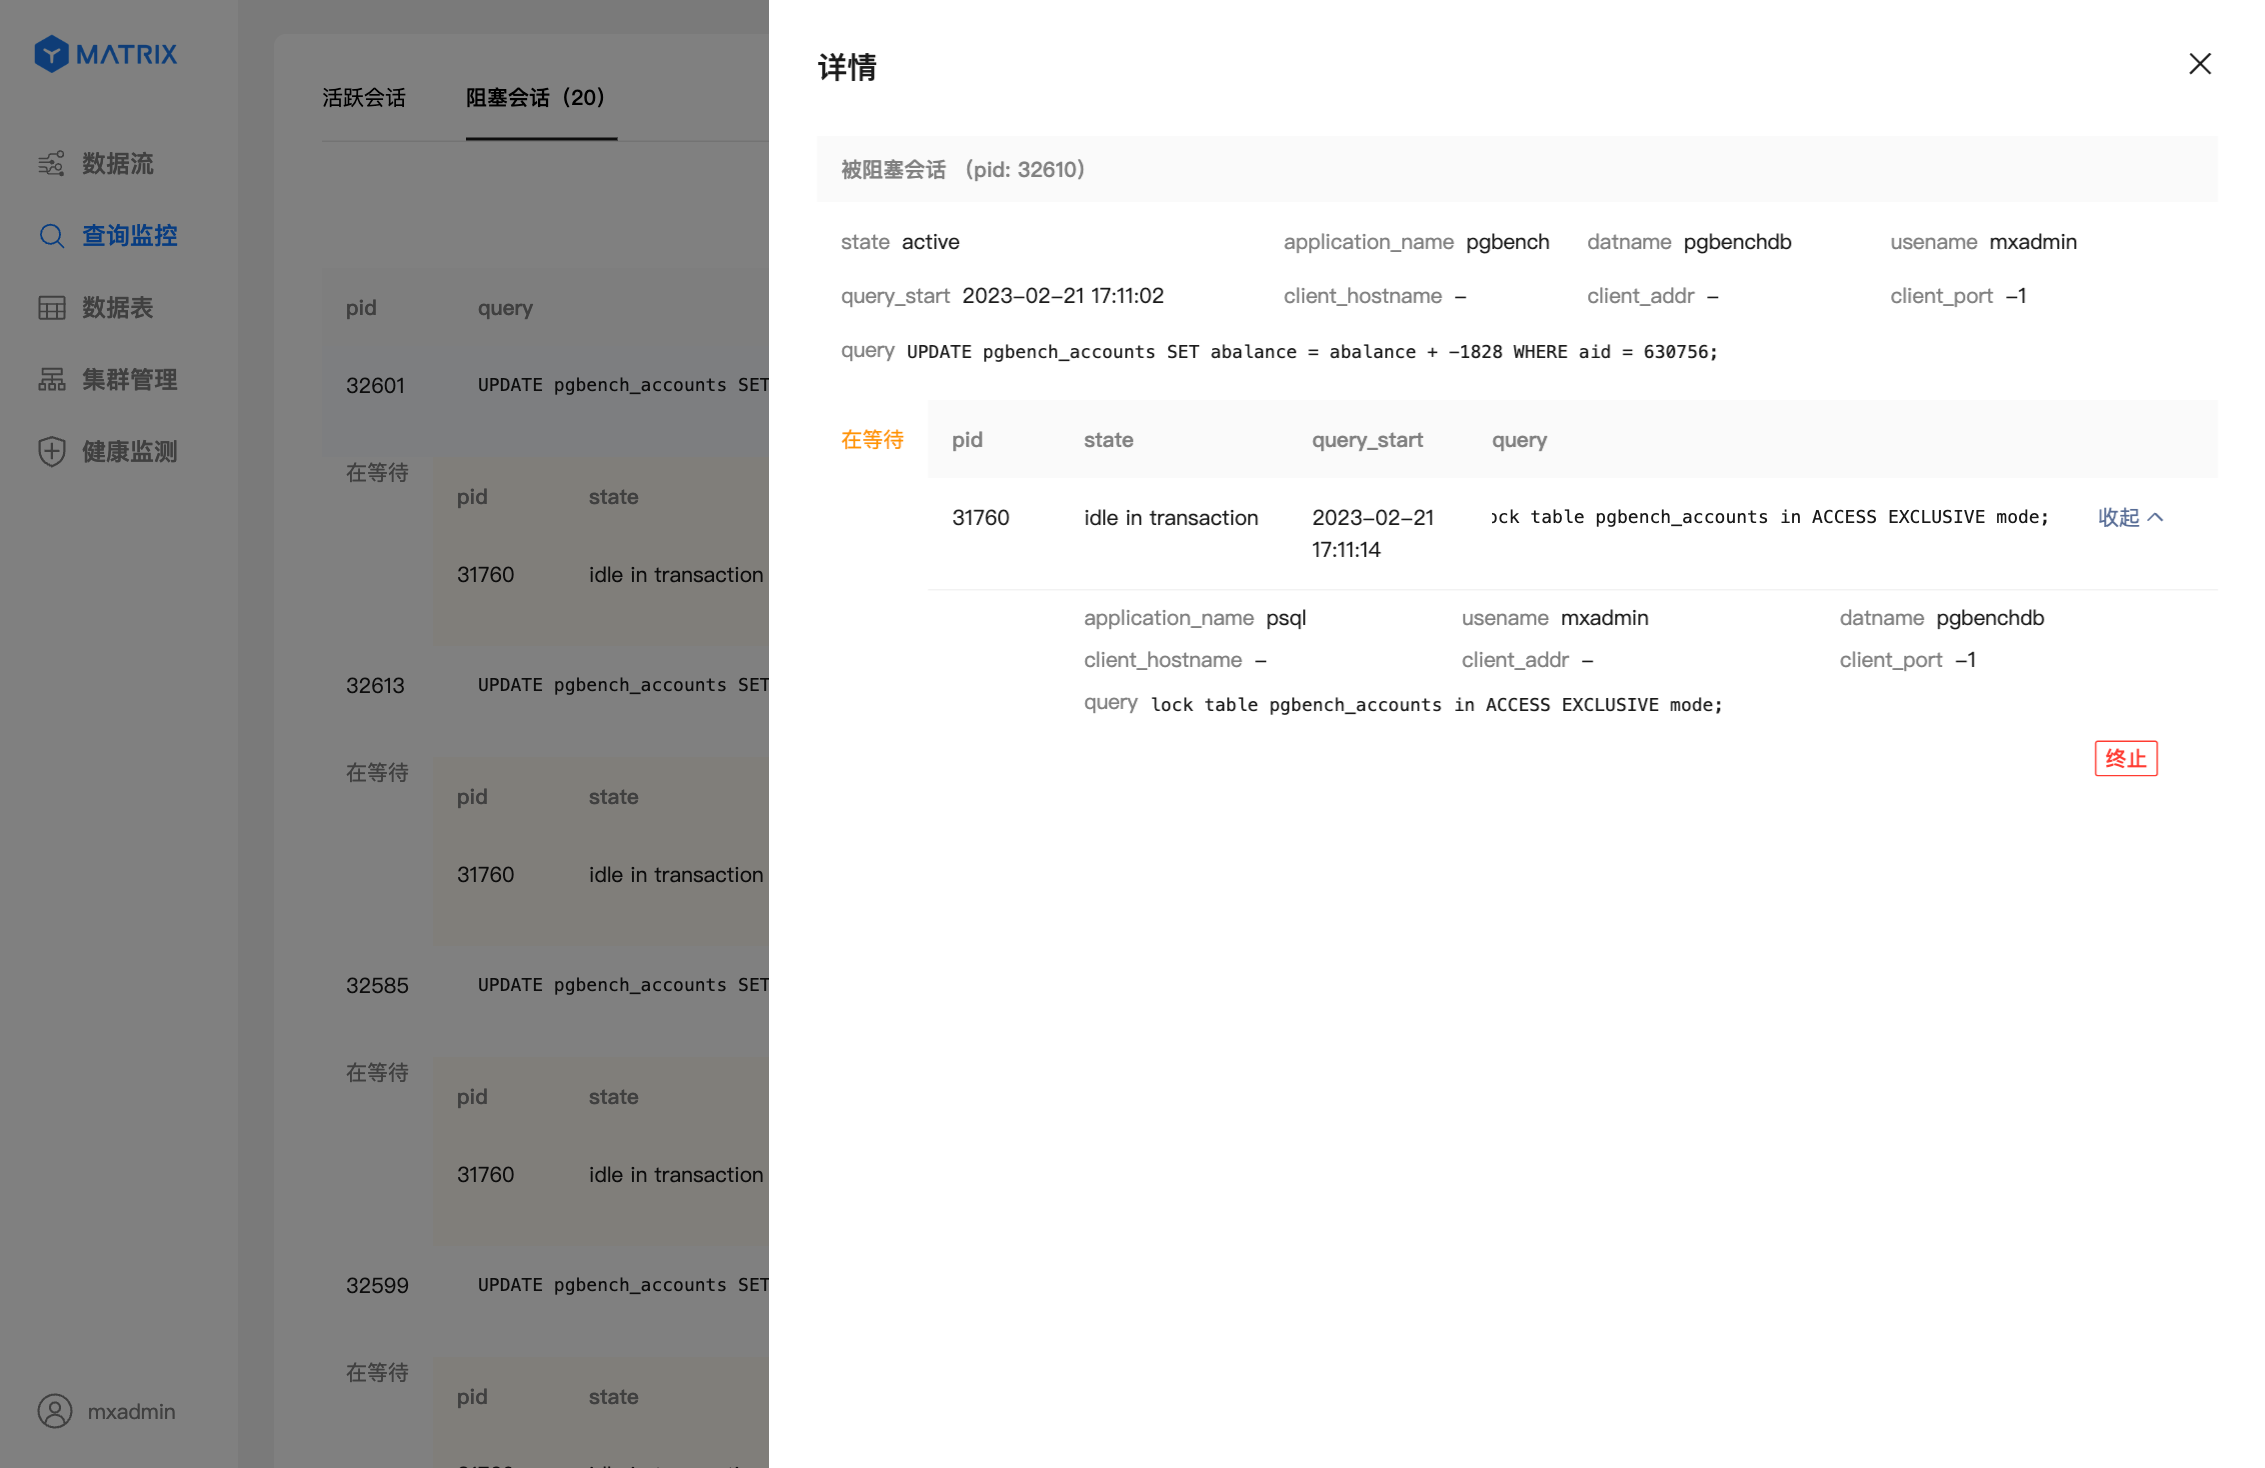
Click “Blocked Sessions” to switch to the blocked session list, which displays the session blocking relationships in the current database. By default, sessions are sorted in reverse order by blocking duration, meaning that sessions with longer blocking durations are listed first. The list refreshes automatically every 10 seconds. If you need to examine the details of a specific blocking relationship in the list, you can pause the refresh to prevent the automatic refresh function from filtering out the session with the blocking state you are currently viewing. To reduce the load caused by frequent automatic refreshes, the system will pause the automatic refresh when you exit the query monitoring page.
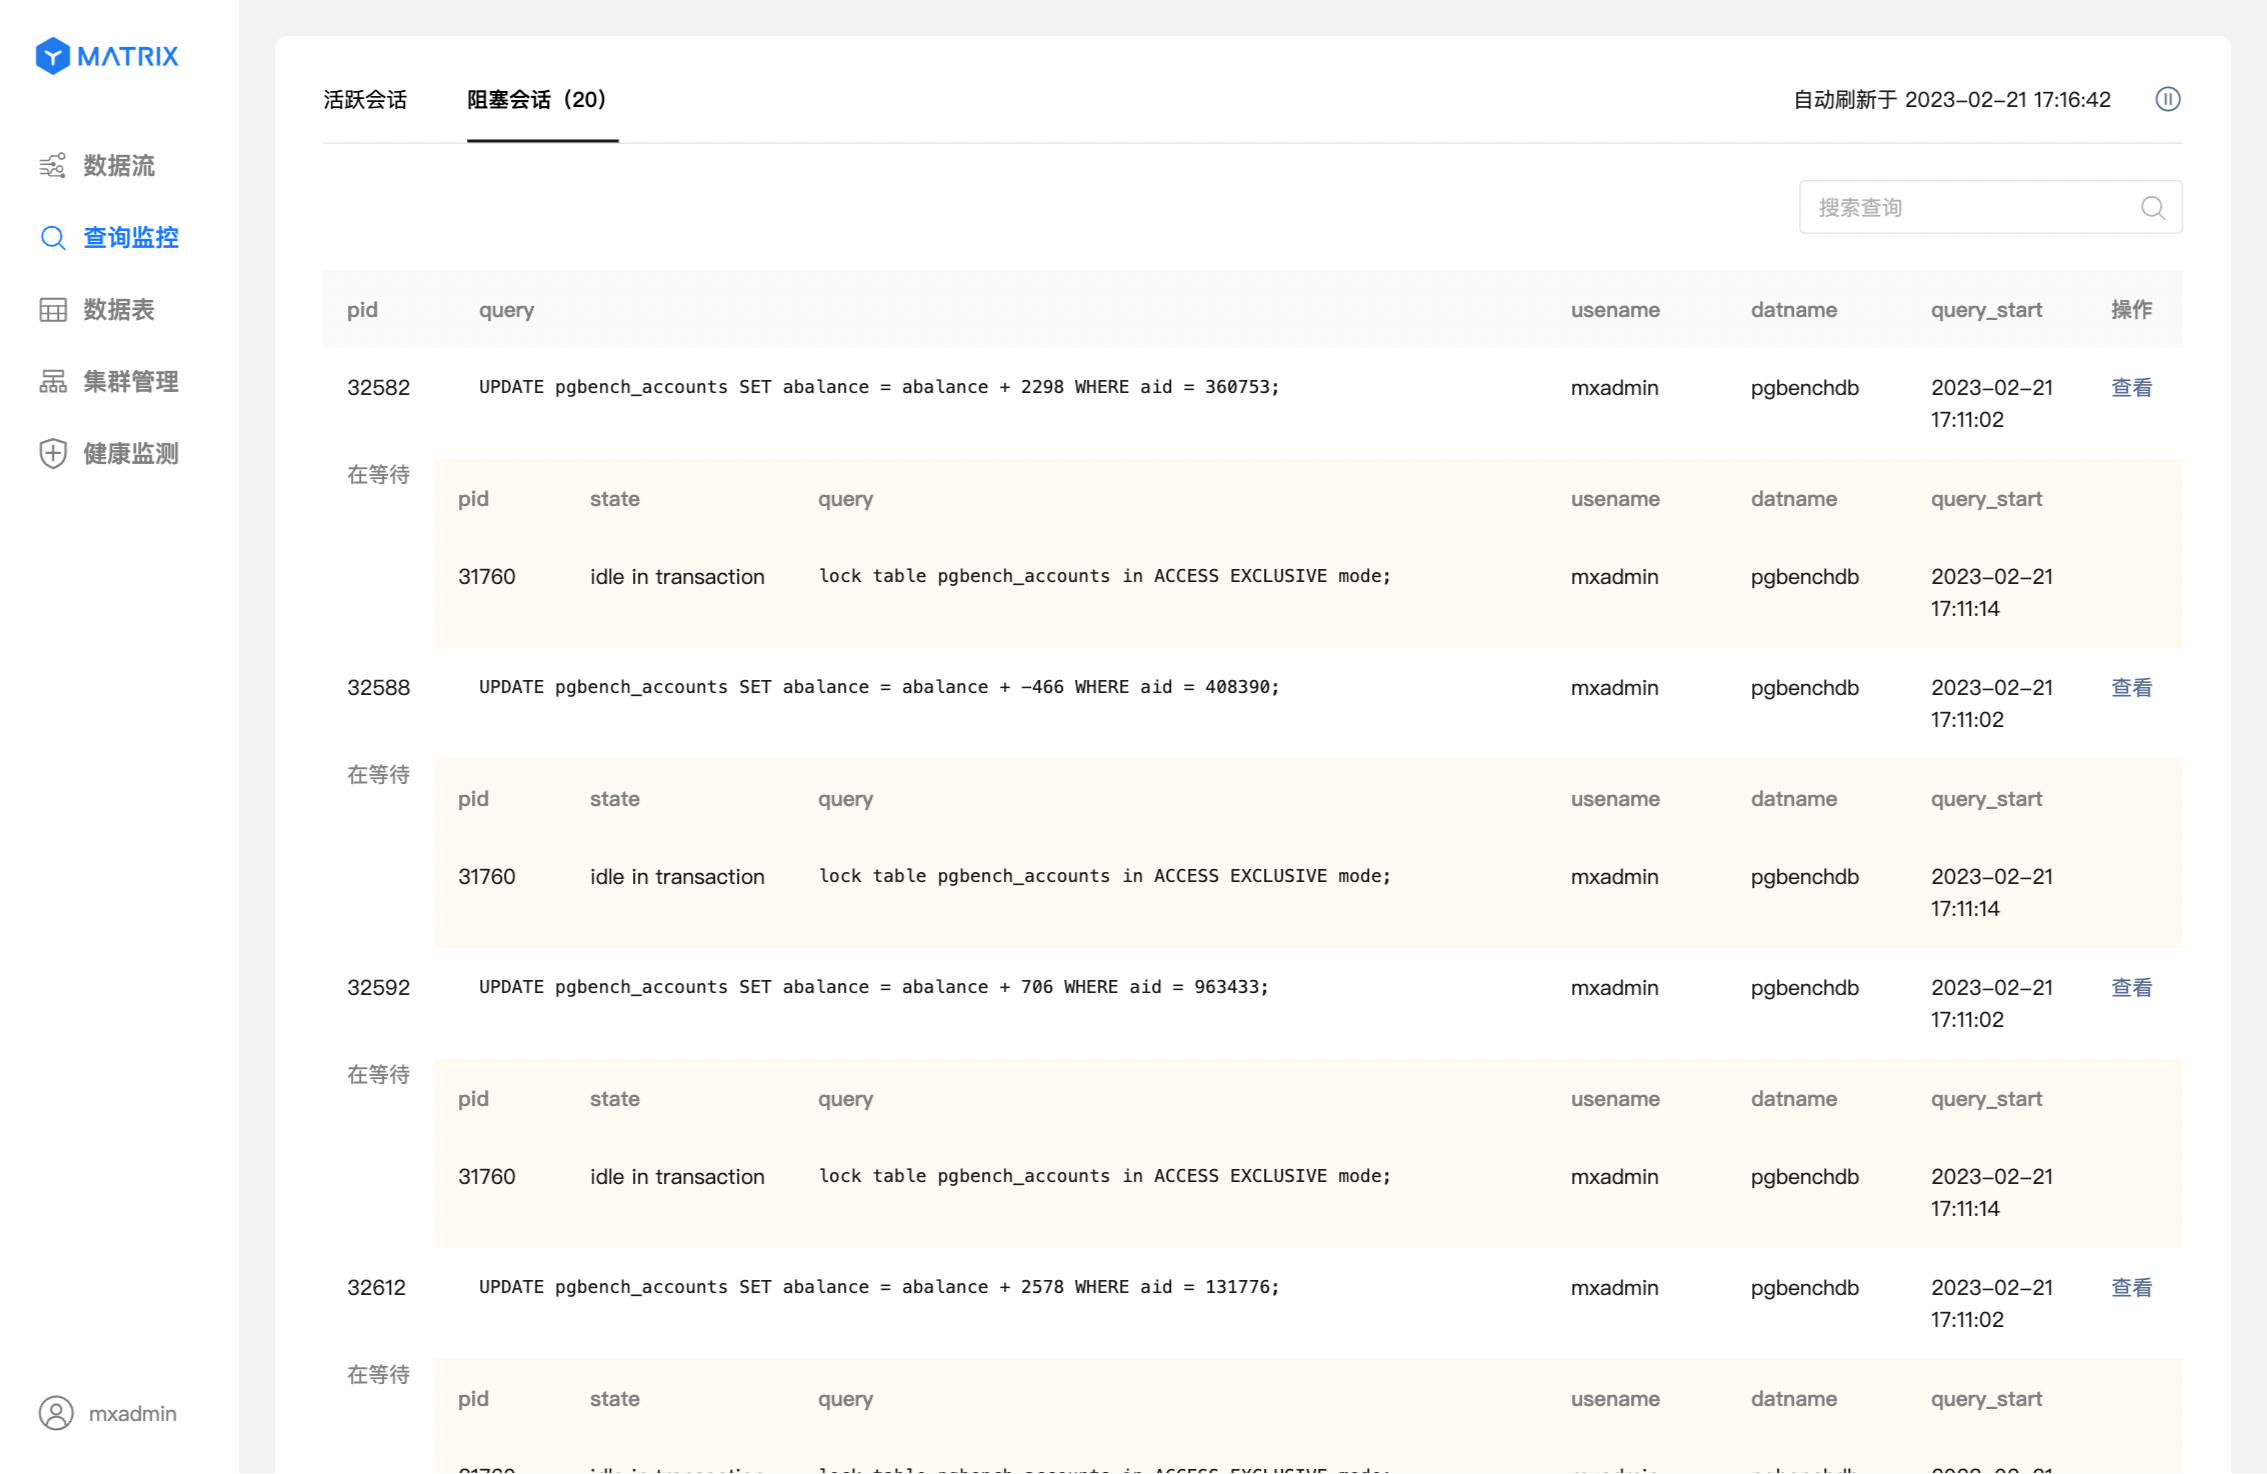
Click the “View” button on the right side of the target blocking relationship to open the query details page, which supports terminating the session.