Quick onboard
Deployment
Data Modeling
Connecting
Migration
Query
Operations and Maintenance
Common Maintenance
Partition
Backup and Restore
Expansion
Mirroring
Resource Groups
Security
Monitoring
Performance Tuning
Troubleshooting
Reference Guide
Tool guide
Data type
Storage Engine
Executor
Stream
DR (Disaster Recovery)
Configuration
Index
Extension
SQL Reference
This document describes the configuration of the YMatrix data panel, adding the node_exporter panel, deploying the MatrixGate monitoring panel, and deploying the etcd monitoring panel.
Note!
Ensure that Prometheus and Grafana monitoring are already installed on your cluster. If not, refer to Grafana Installation and Management for installation and setup.
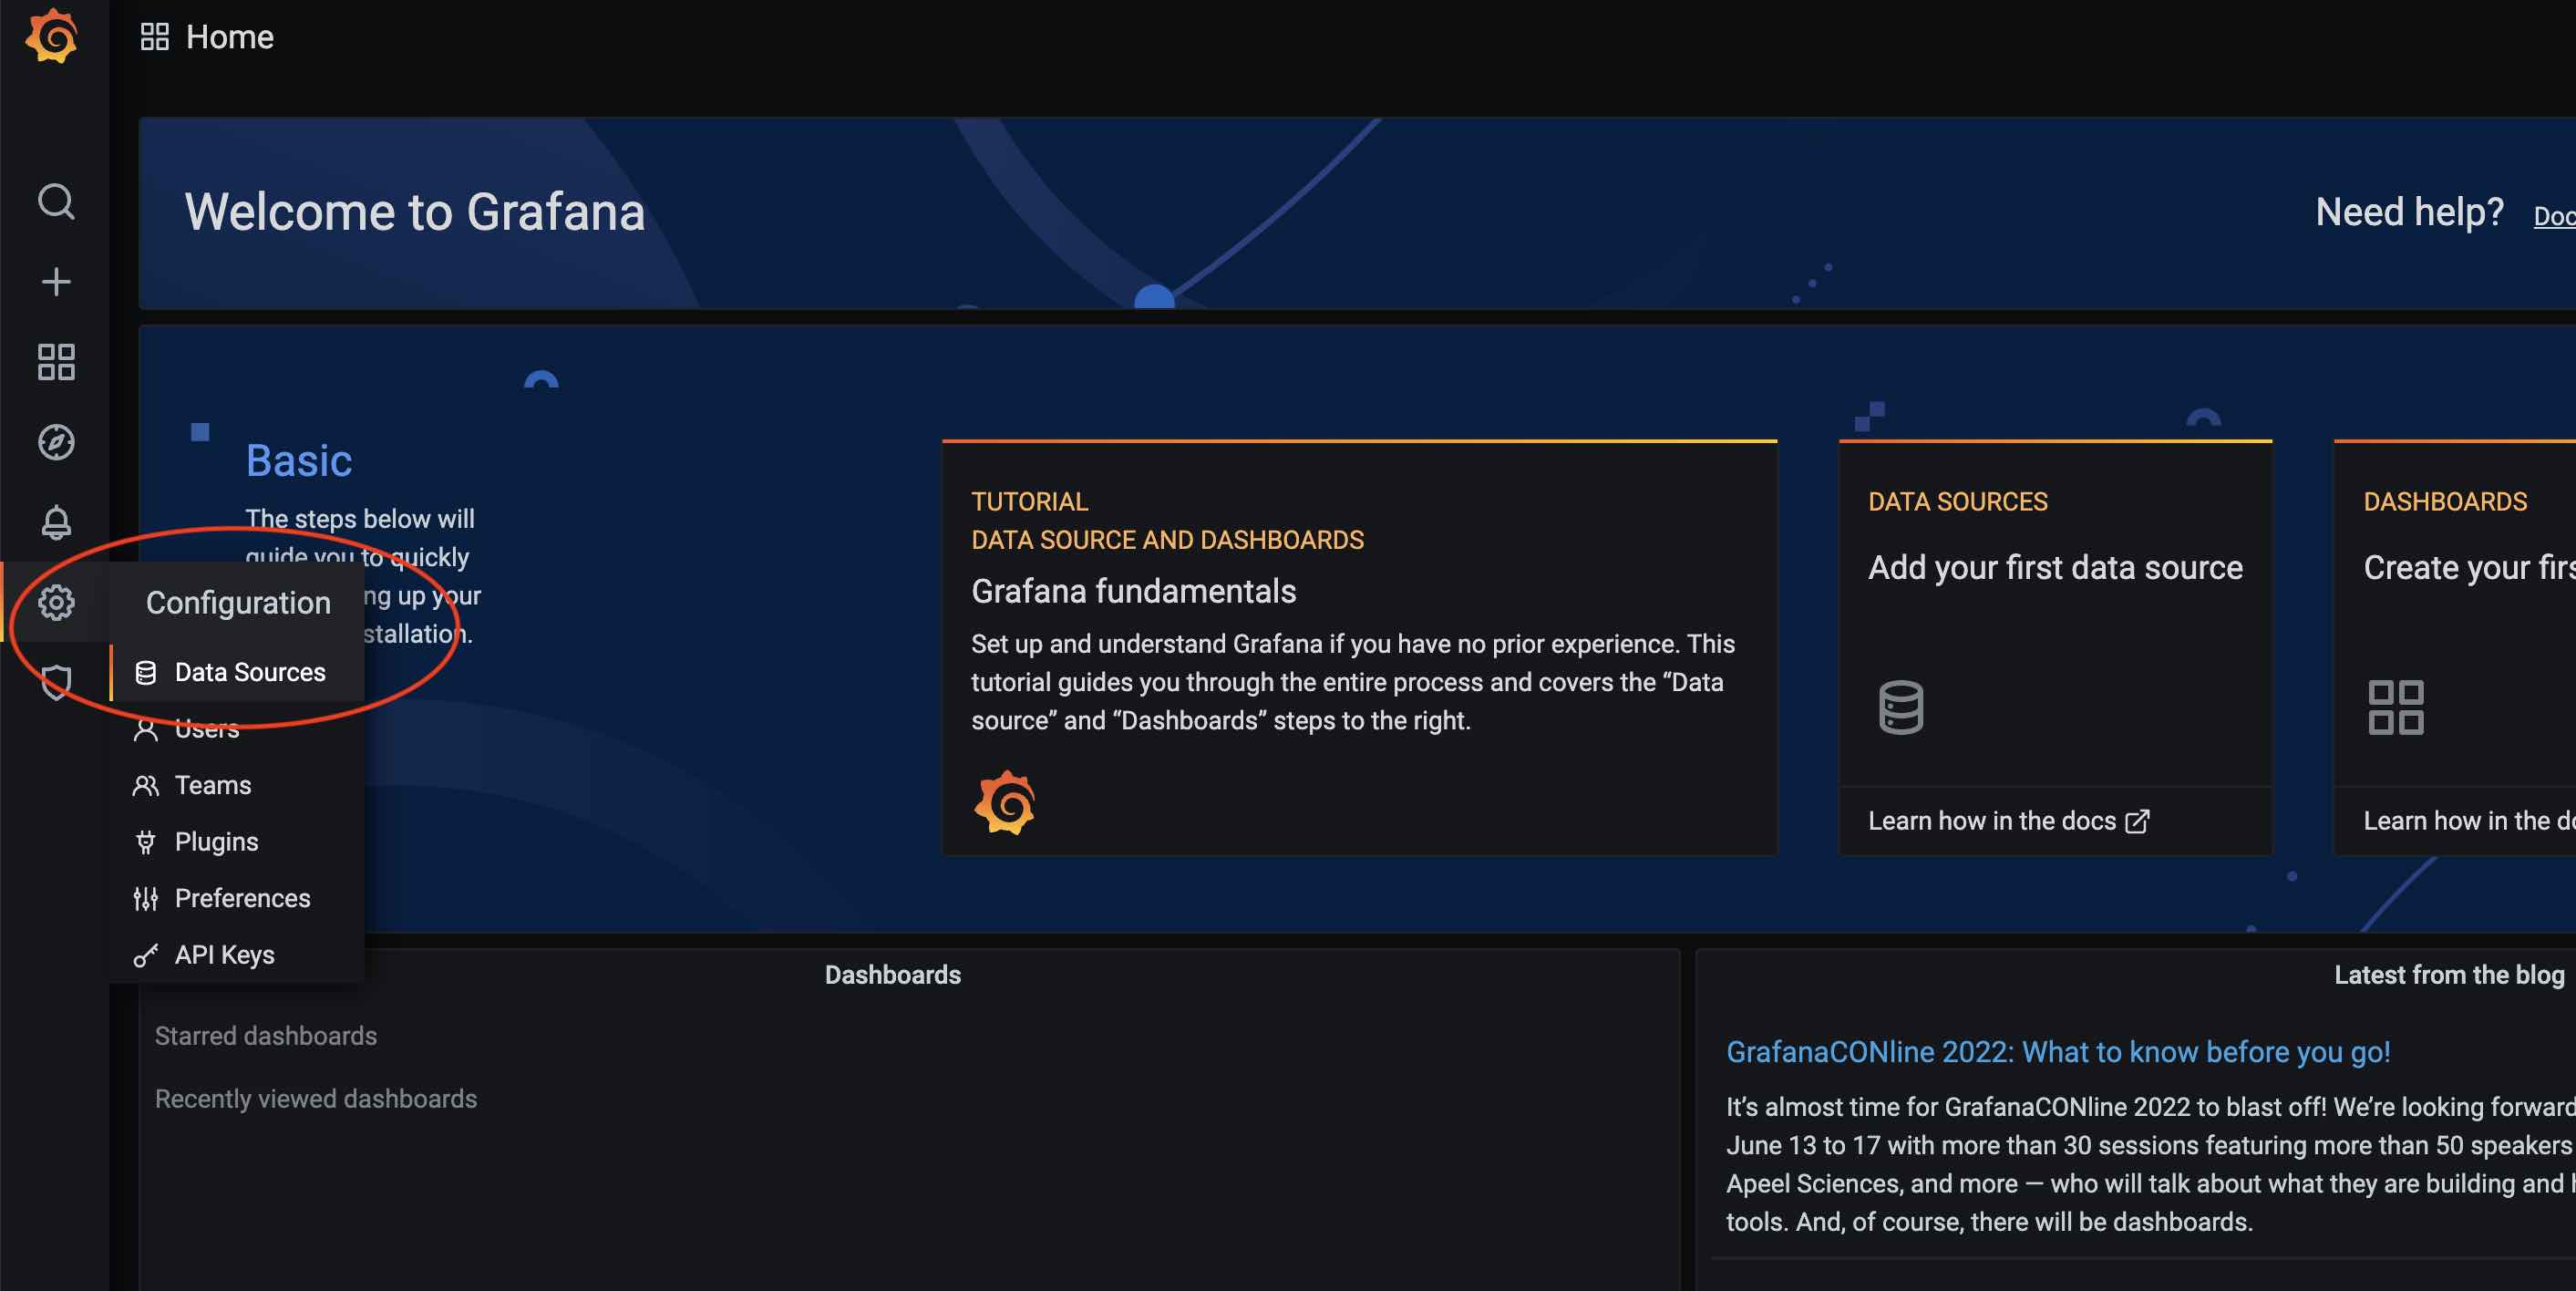
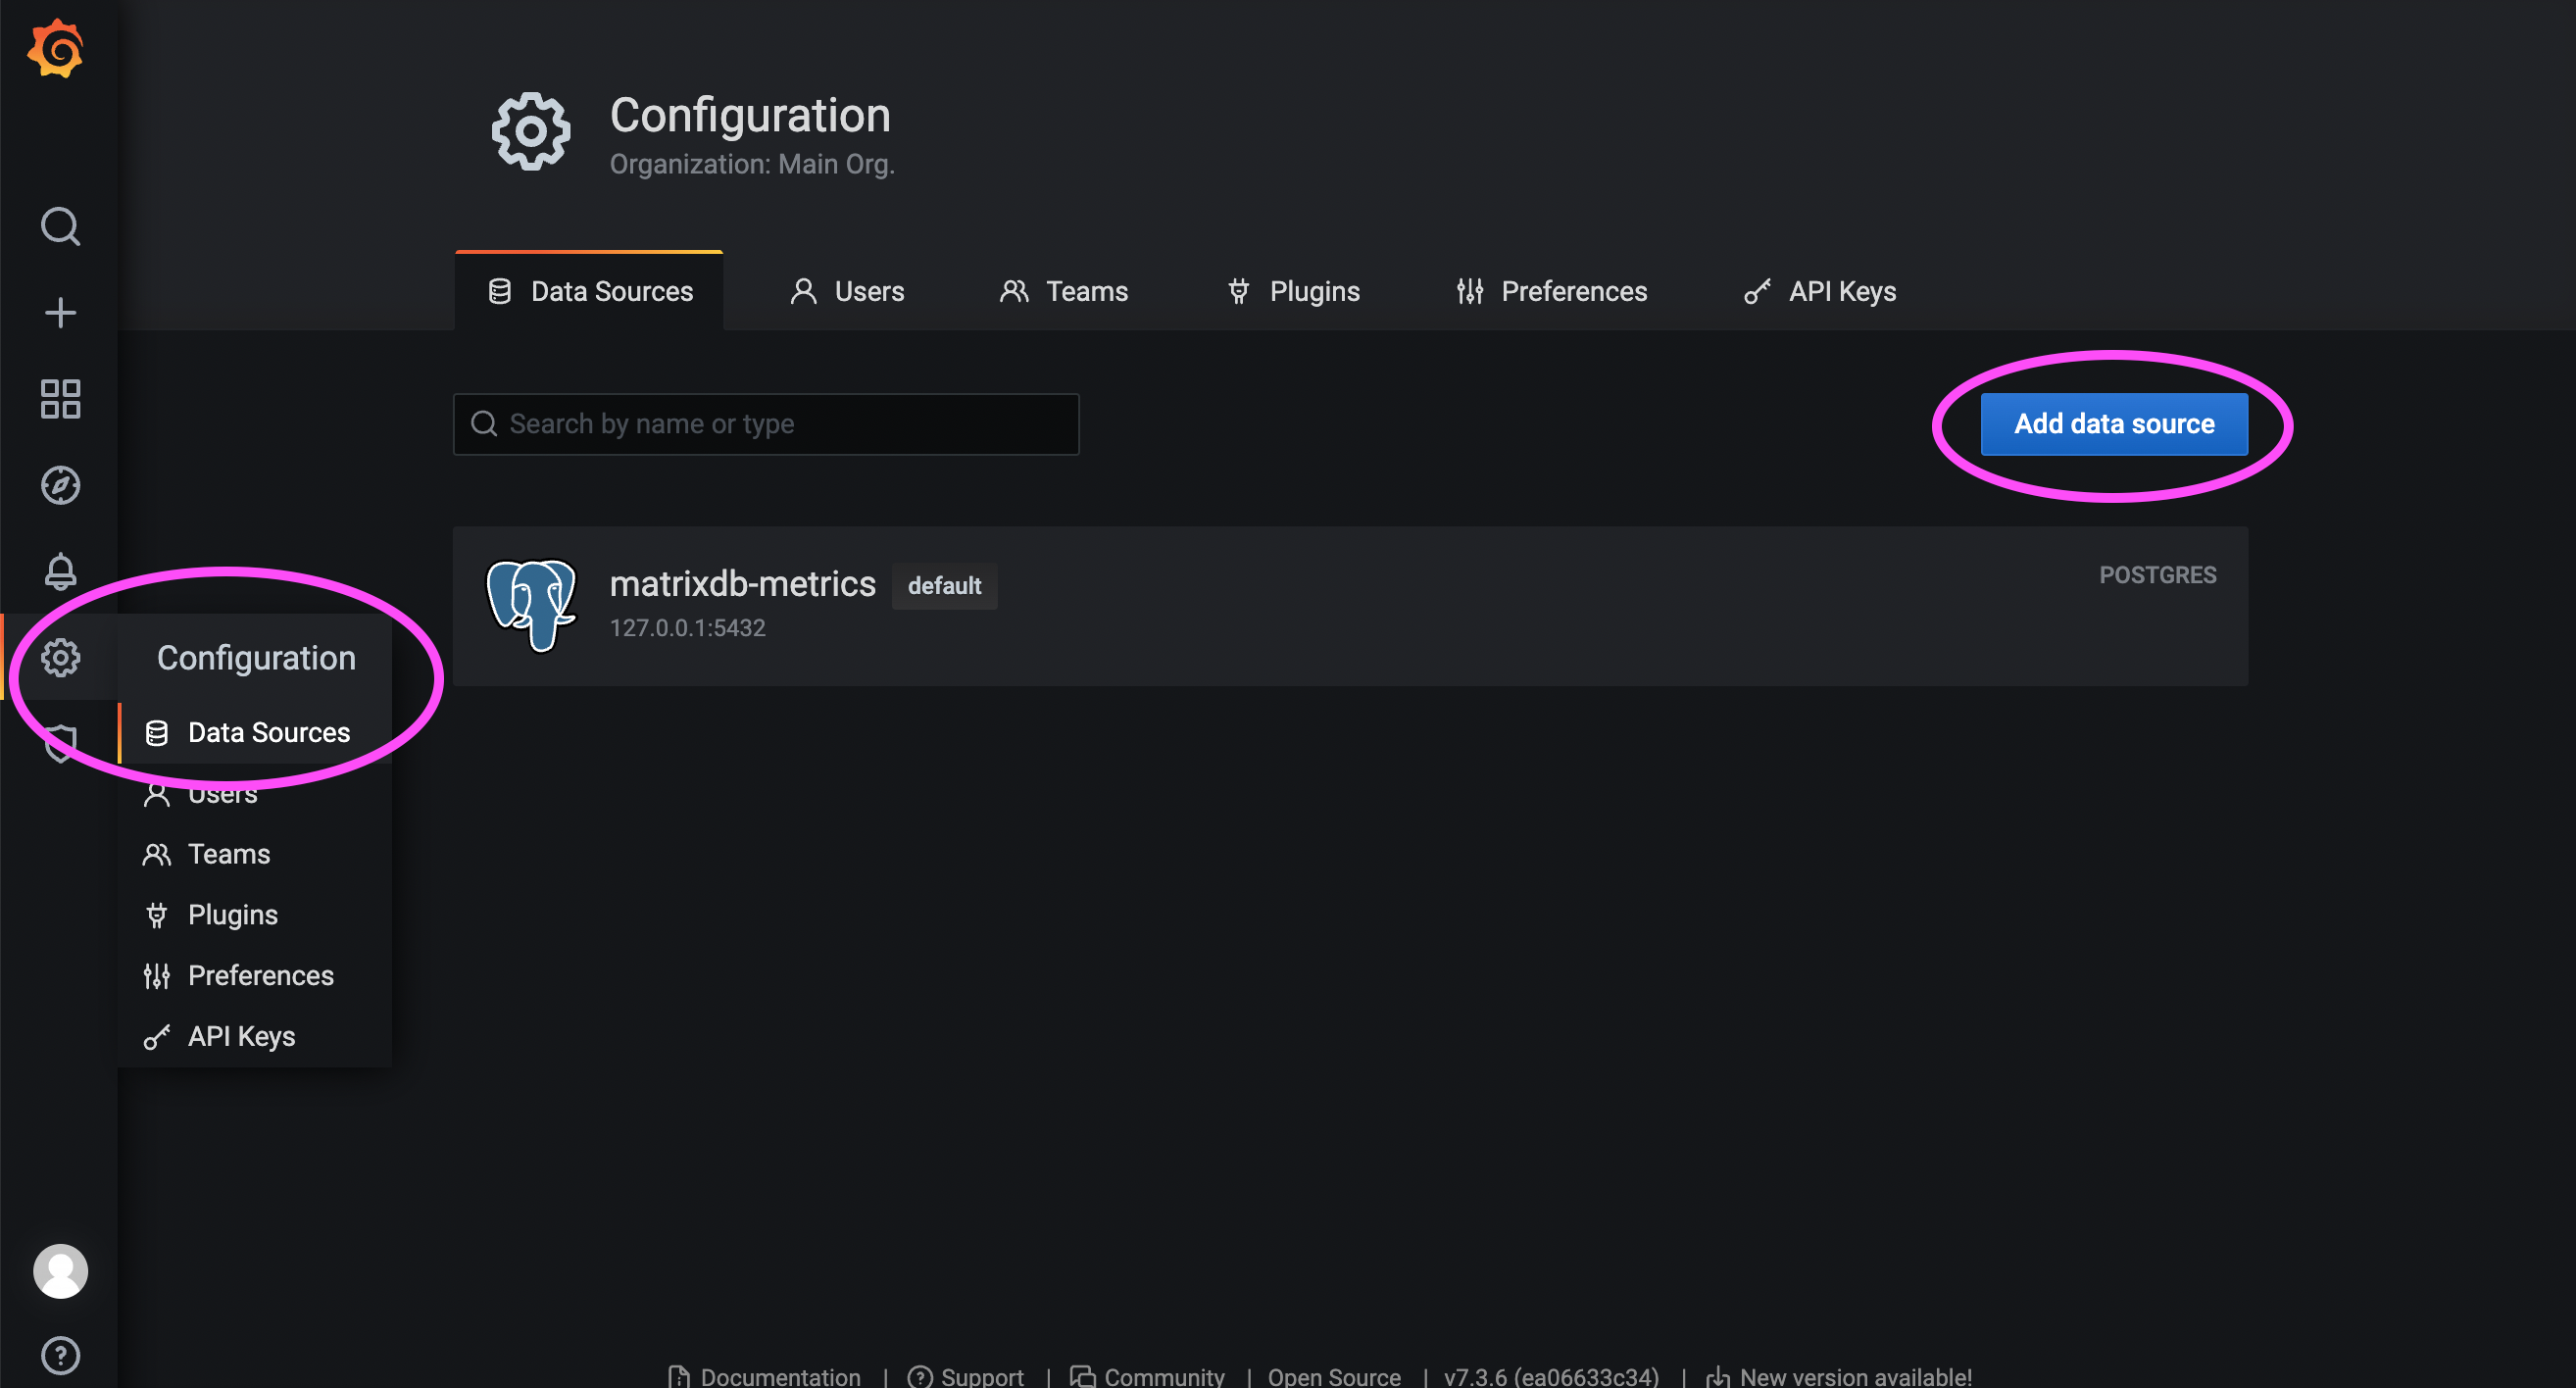
Click the Settings icon on the Grafana homepage and select Data Sources:
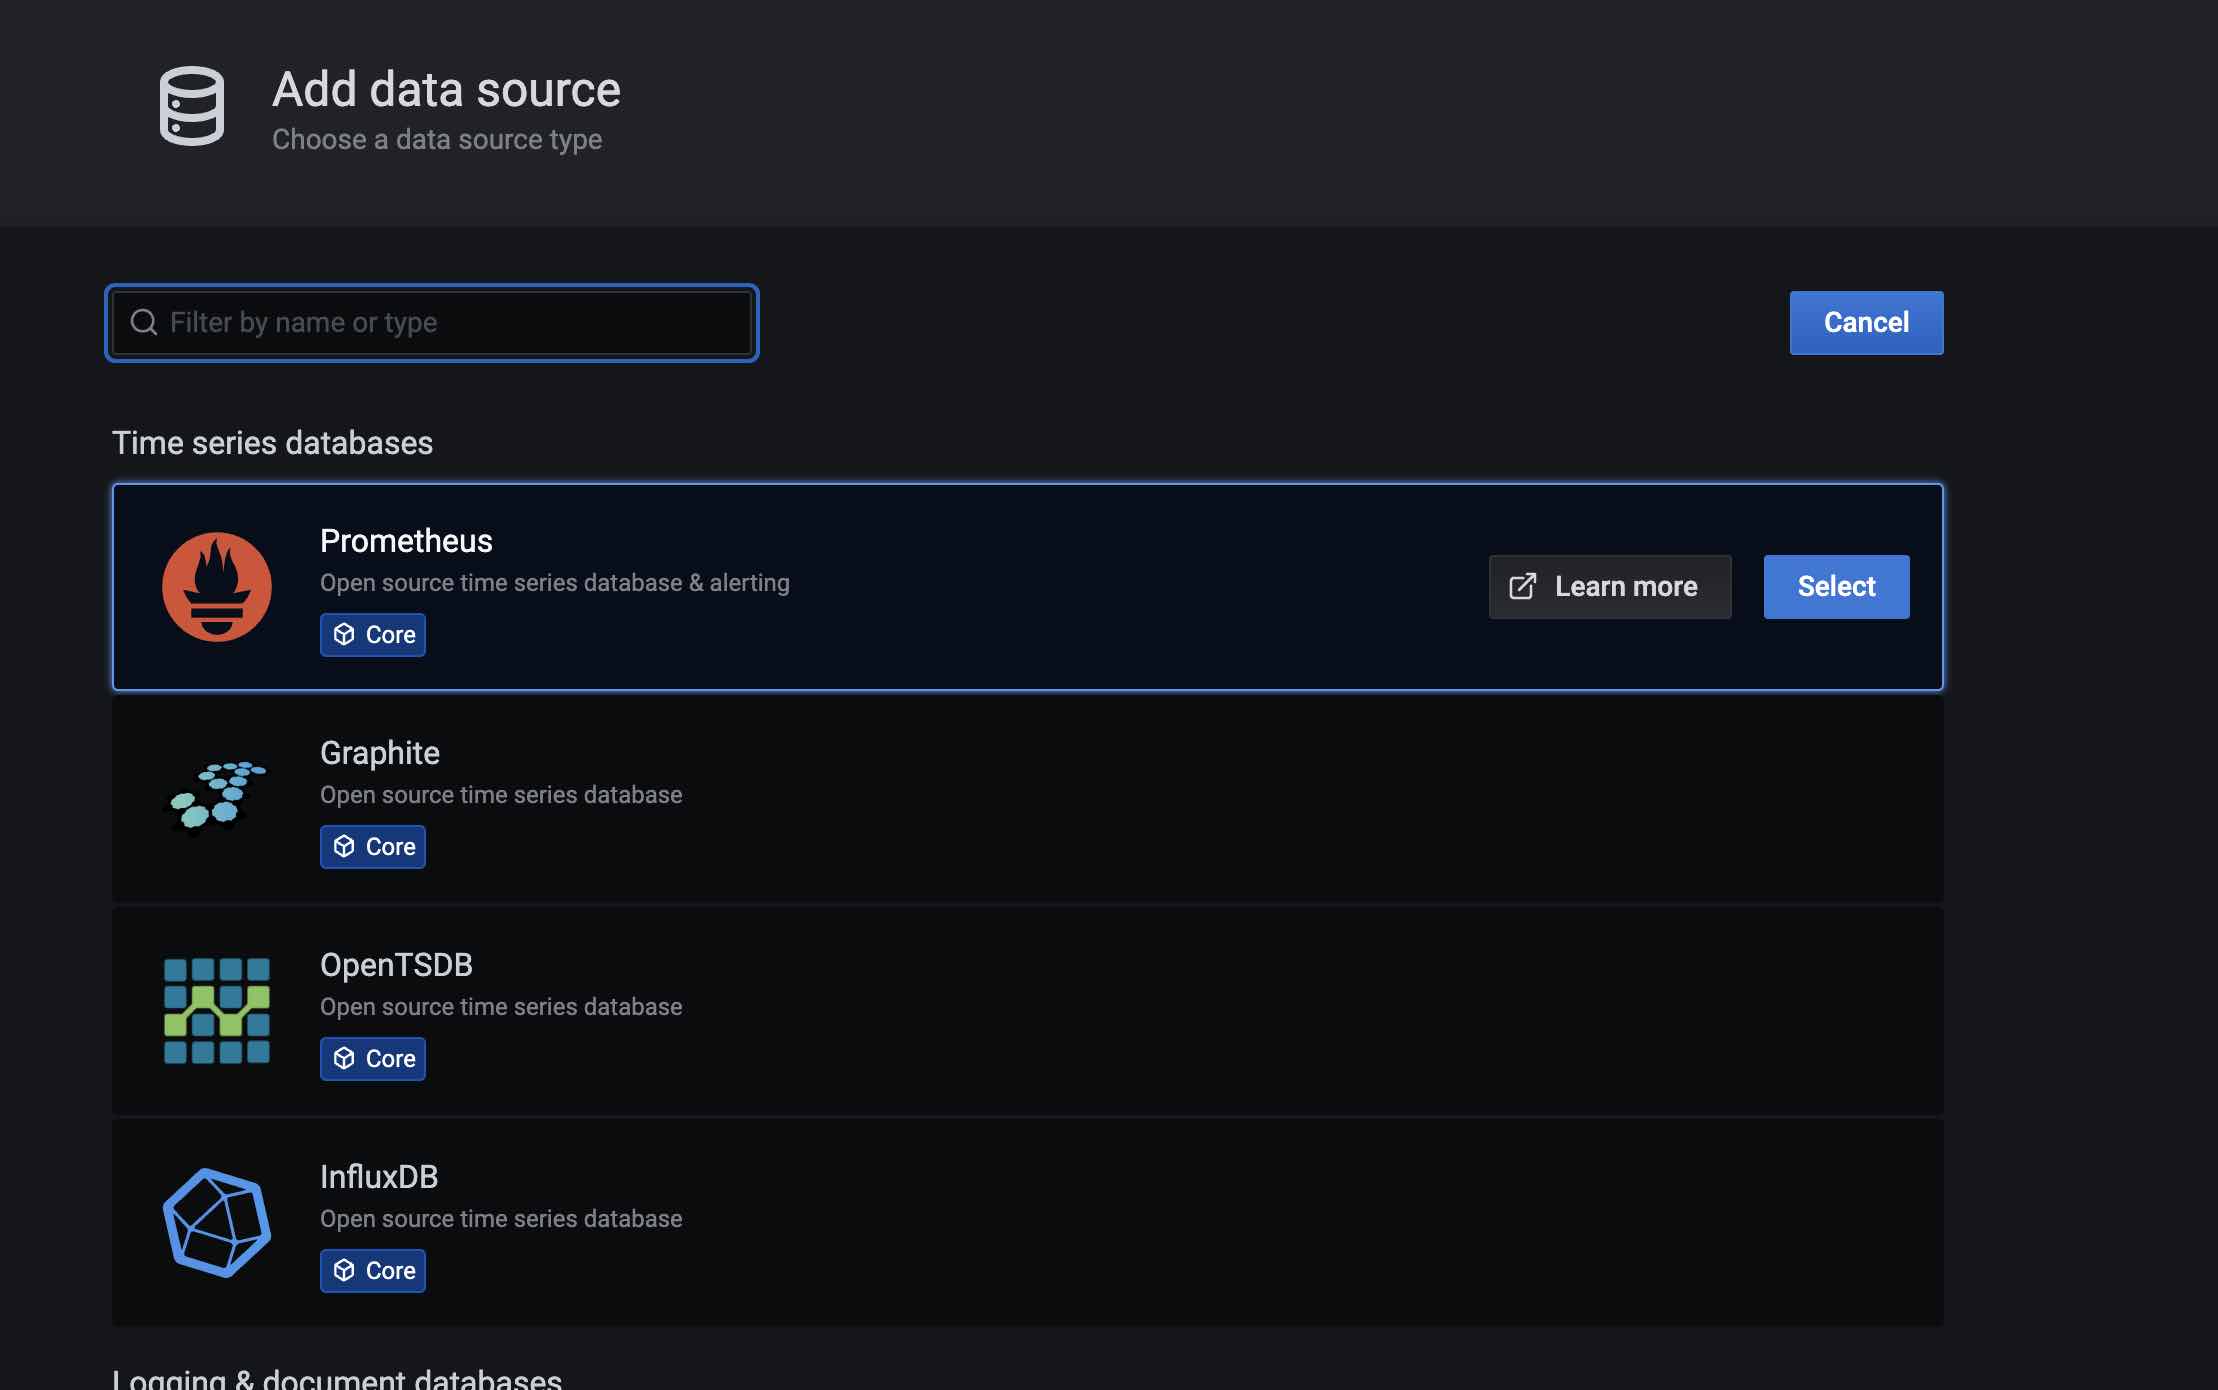
Then click Add data source:

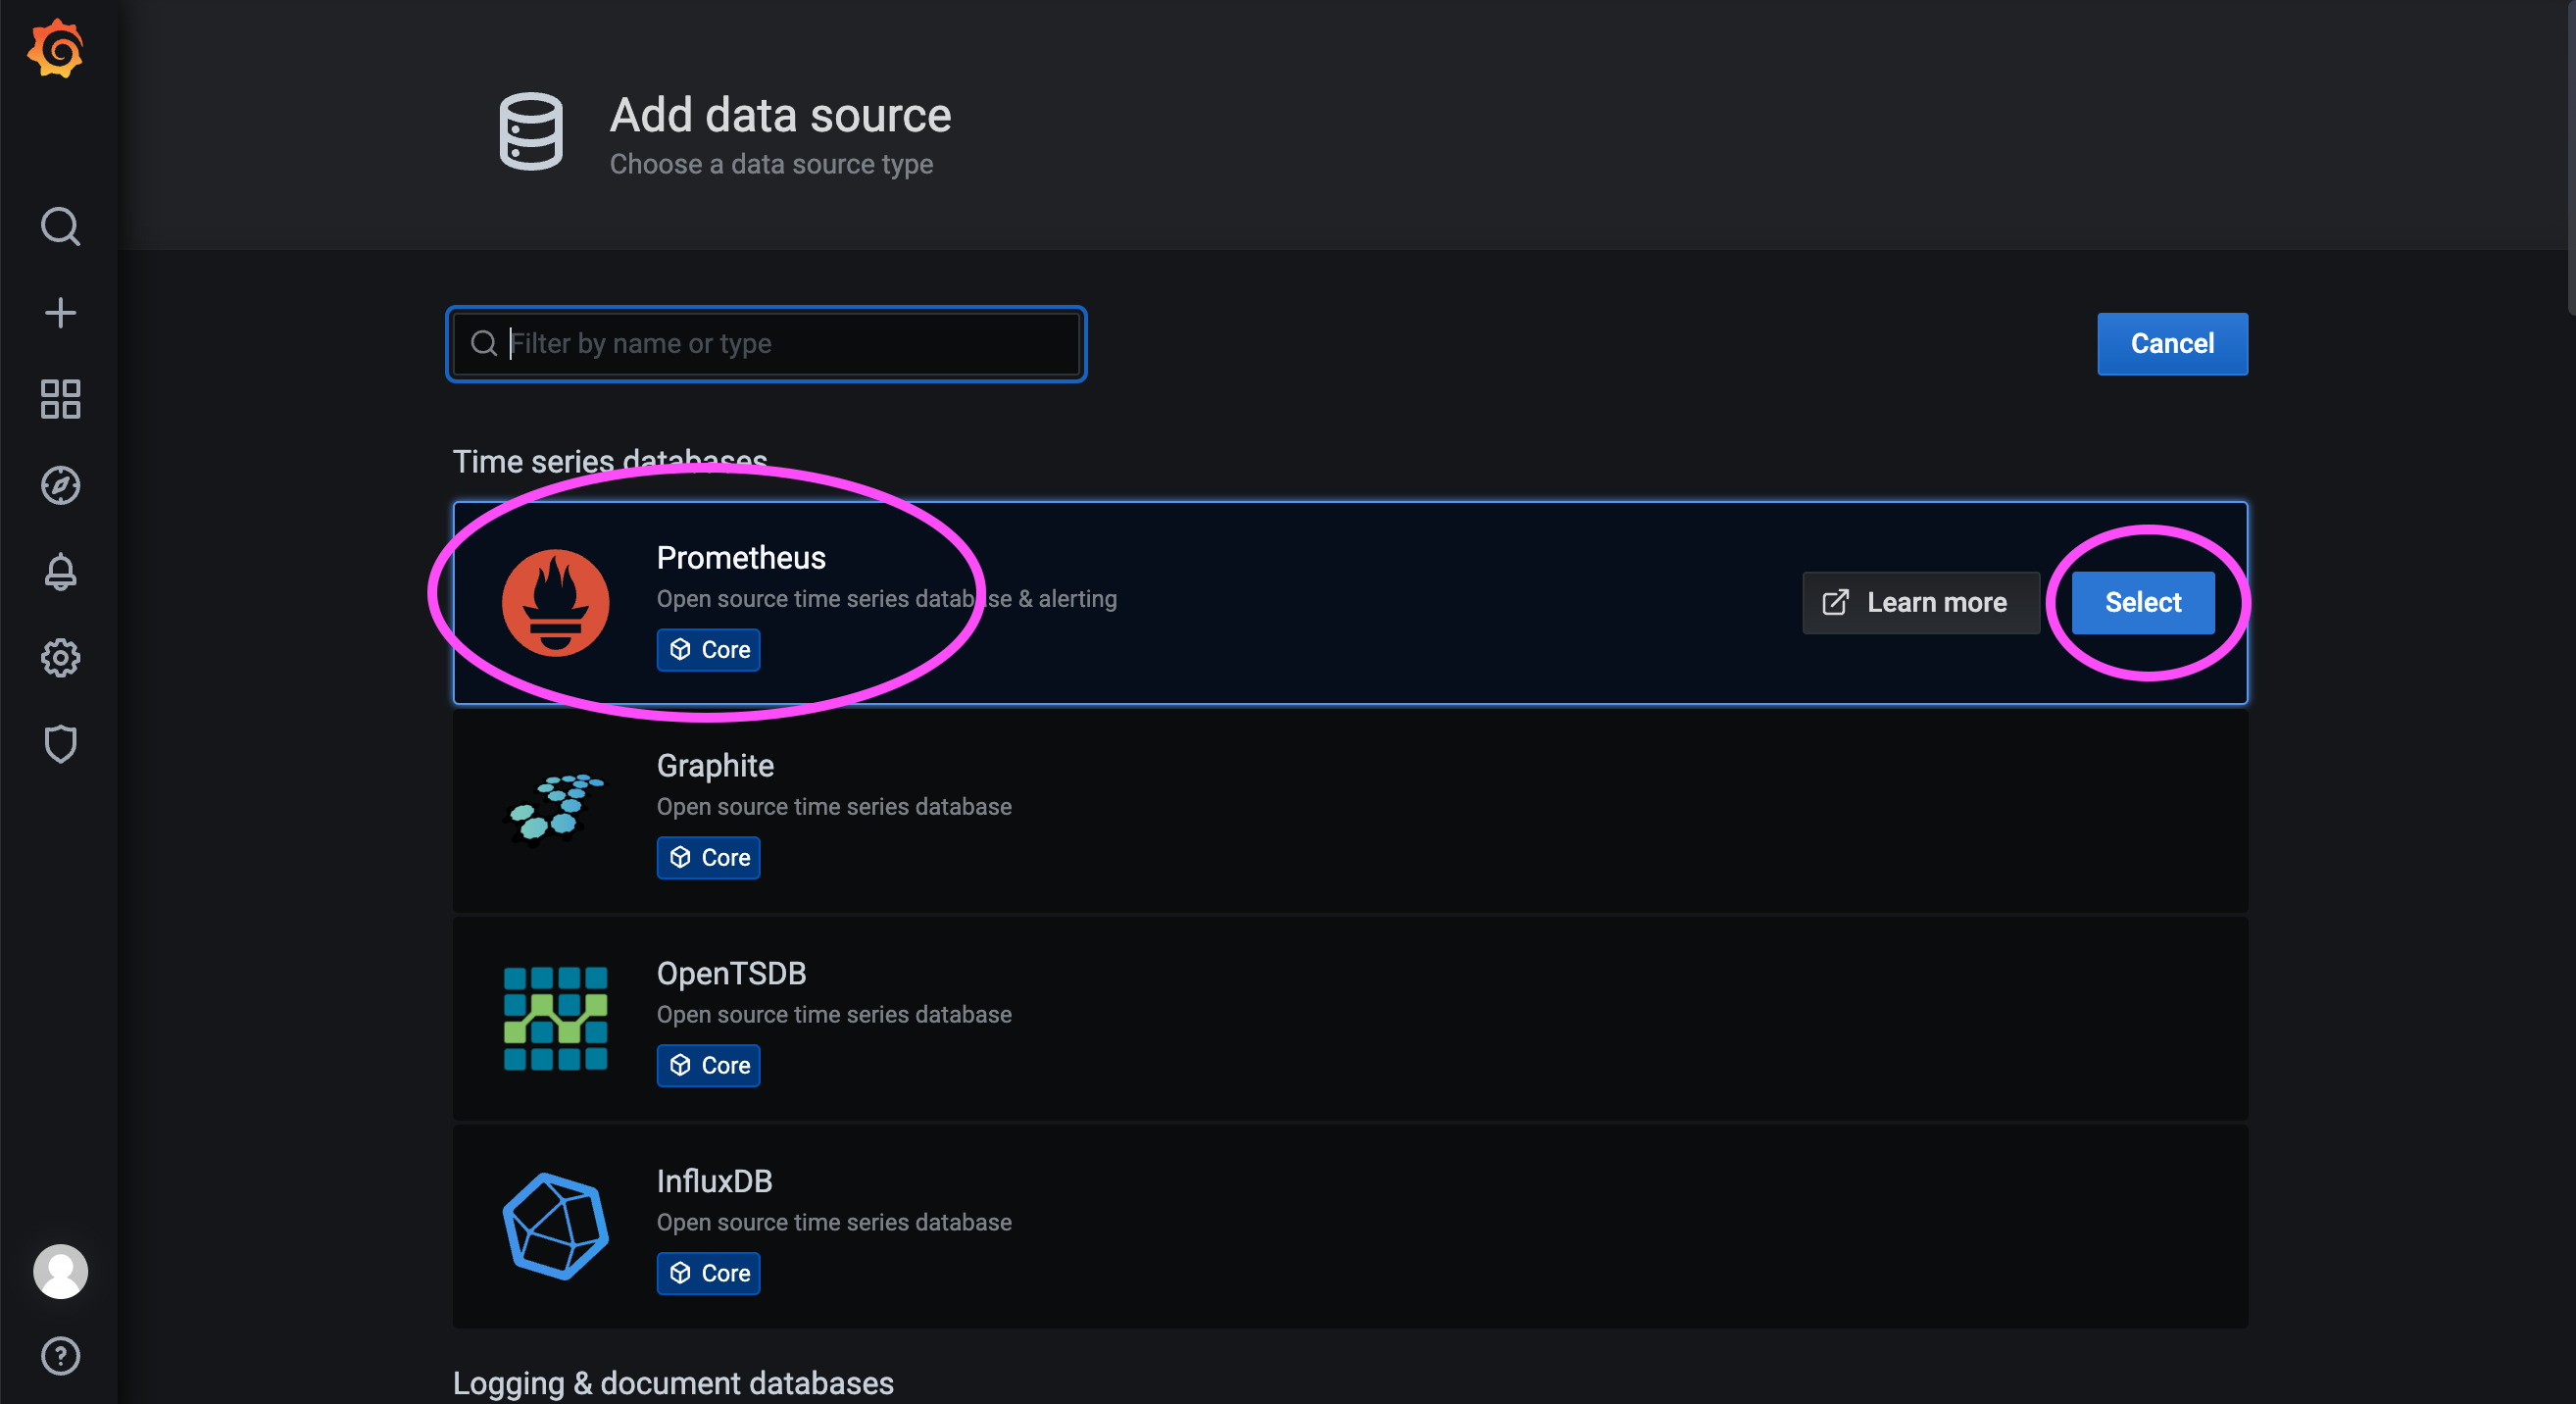
Select Prometheus under the database type:
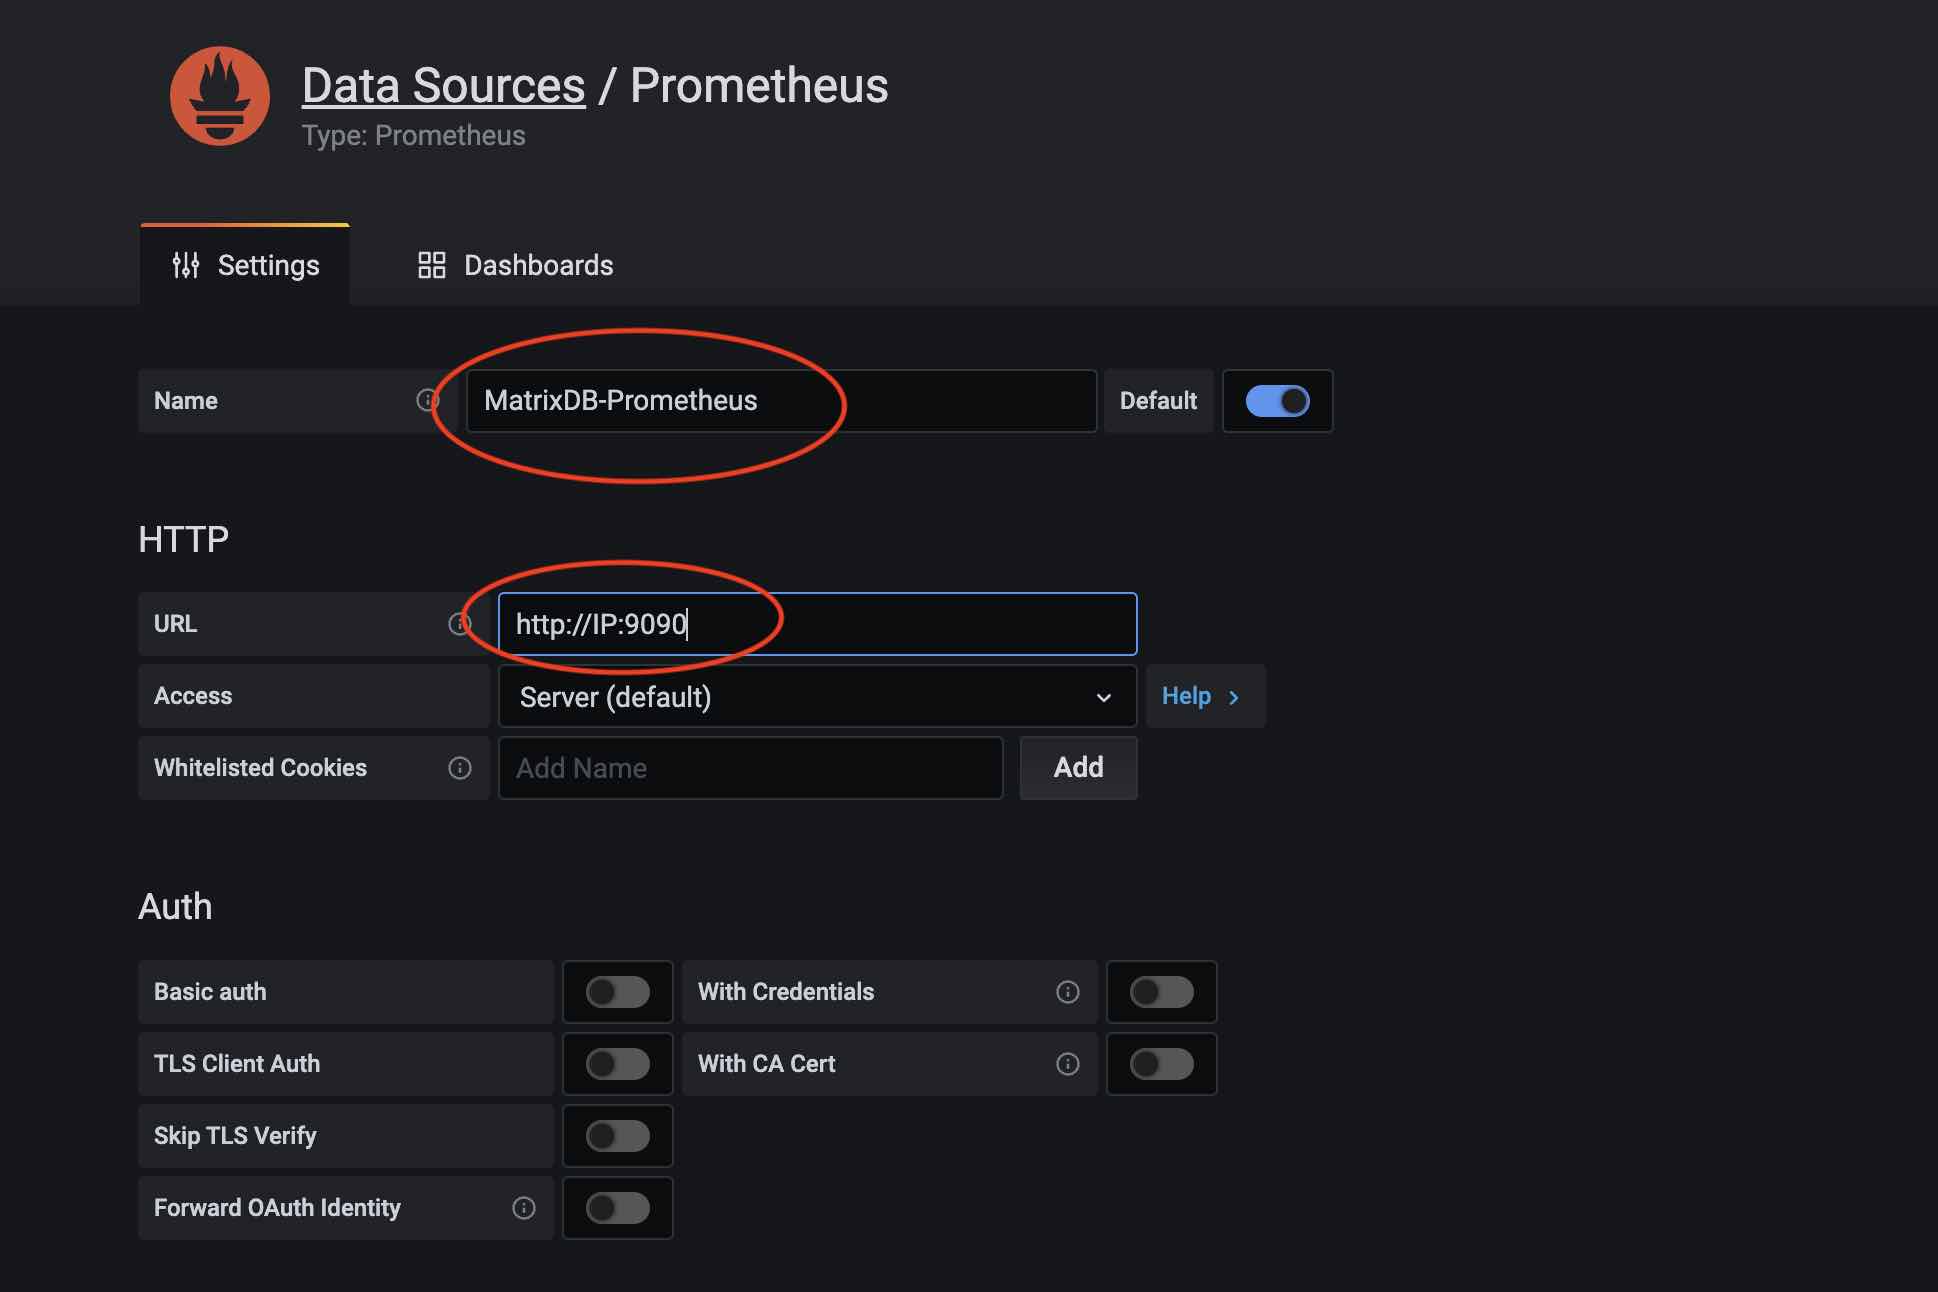
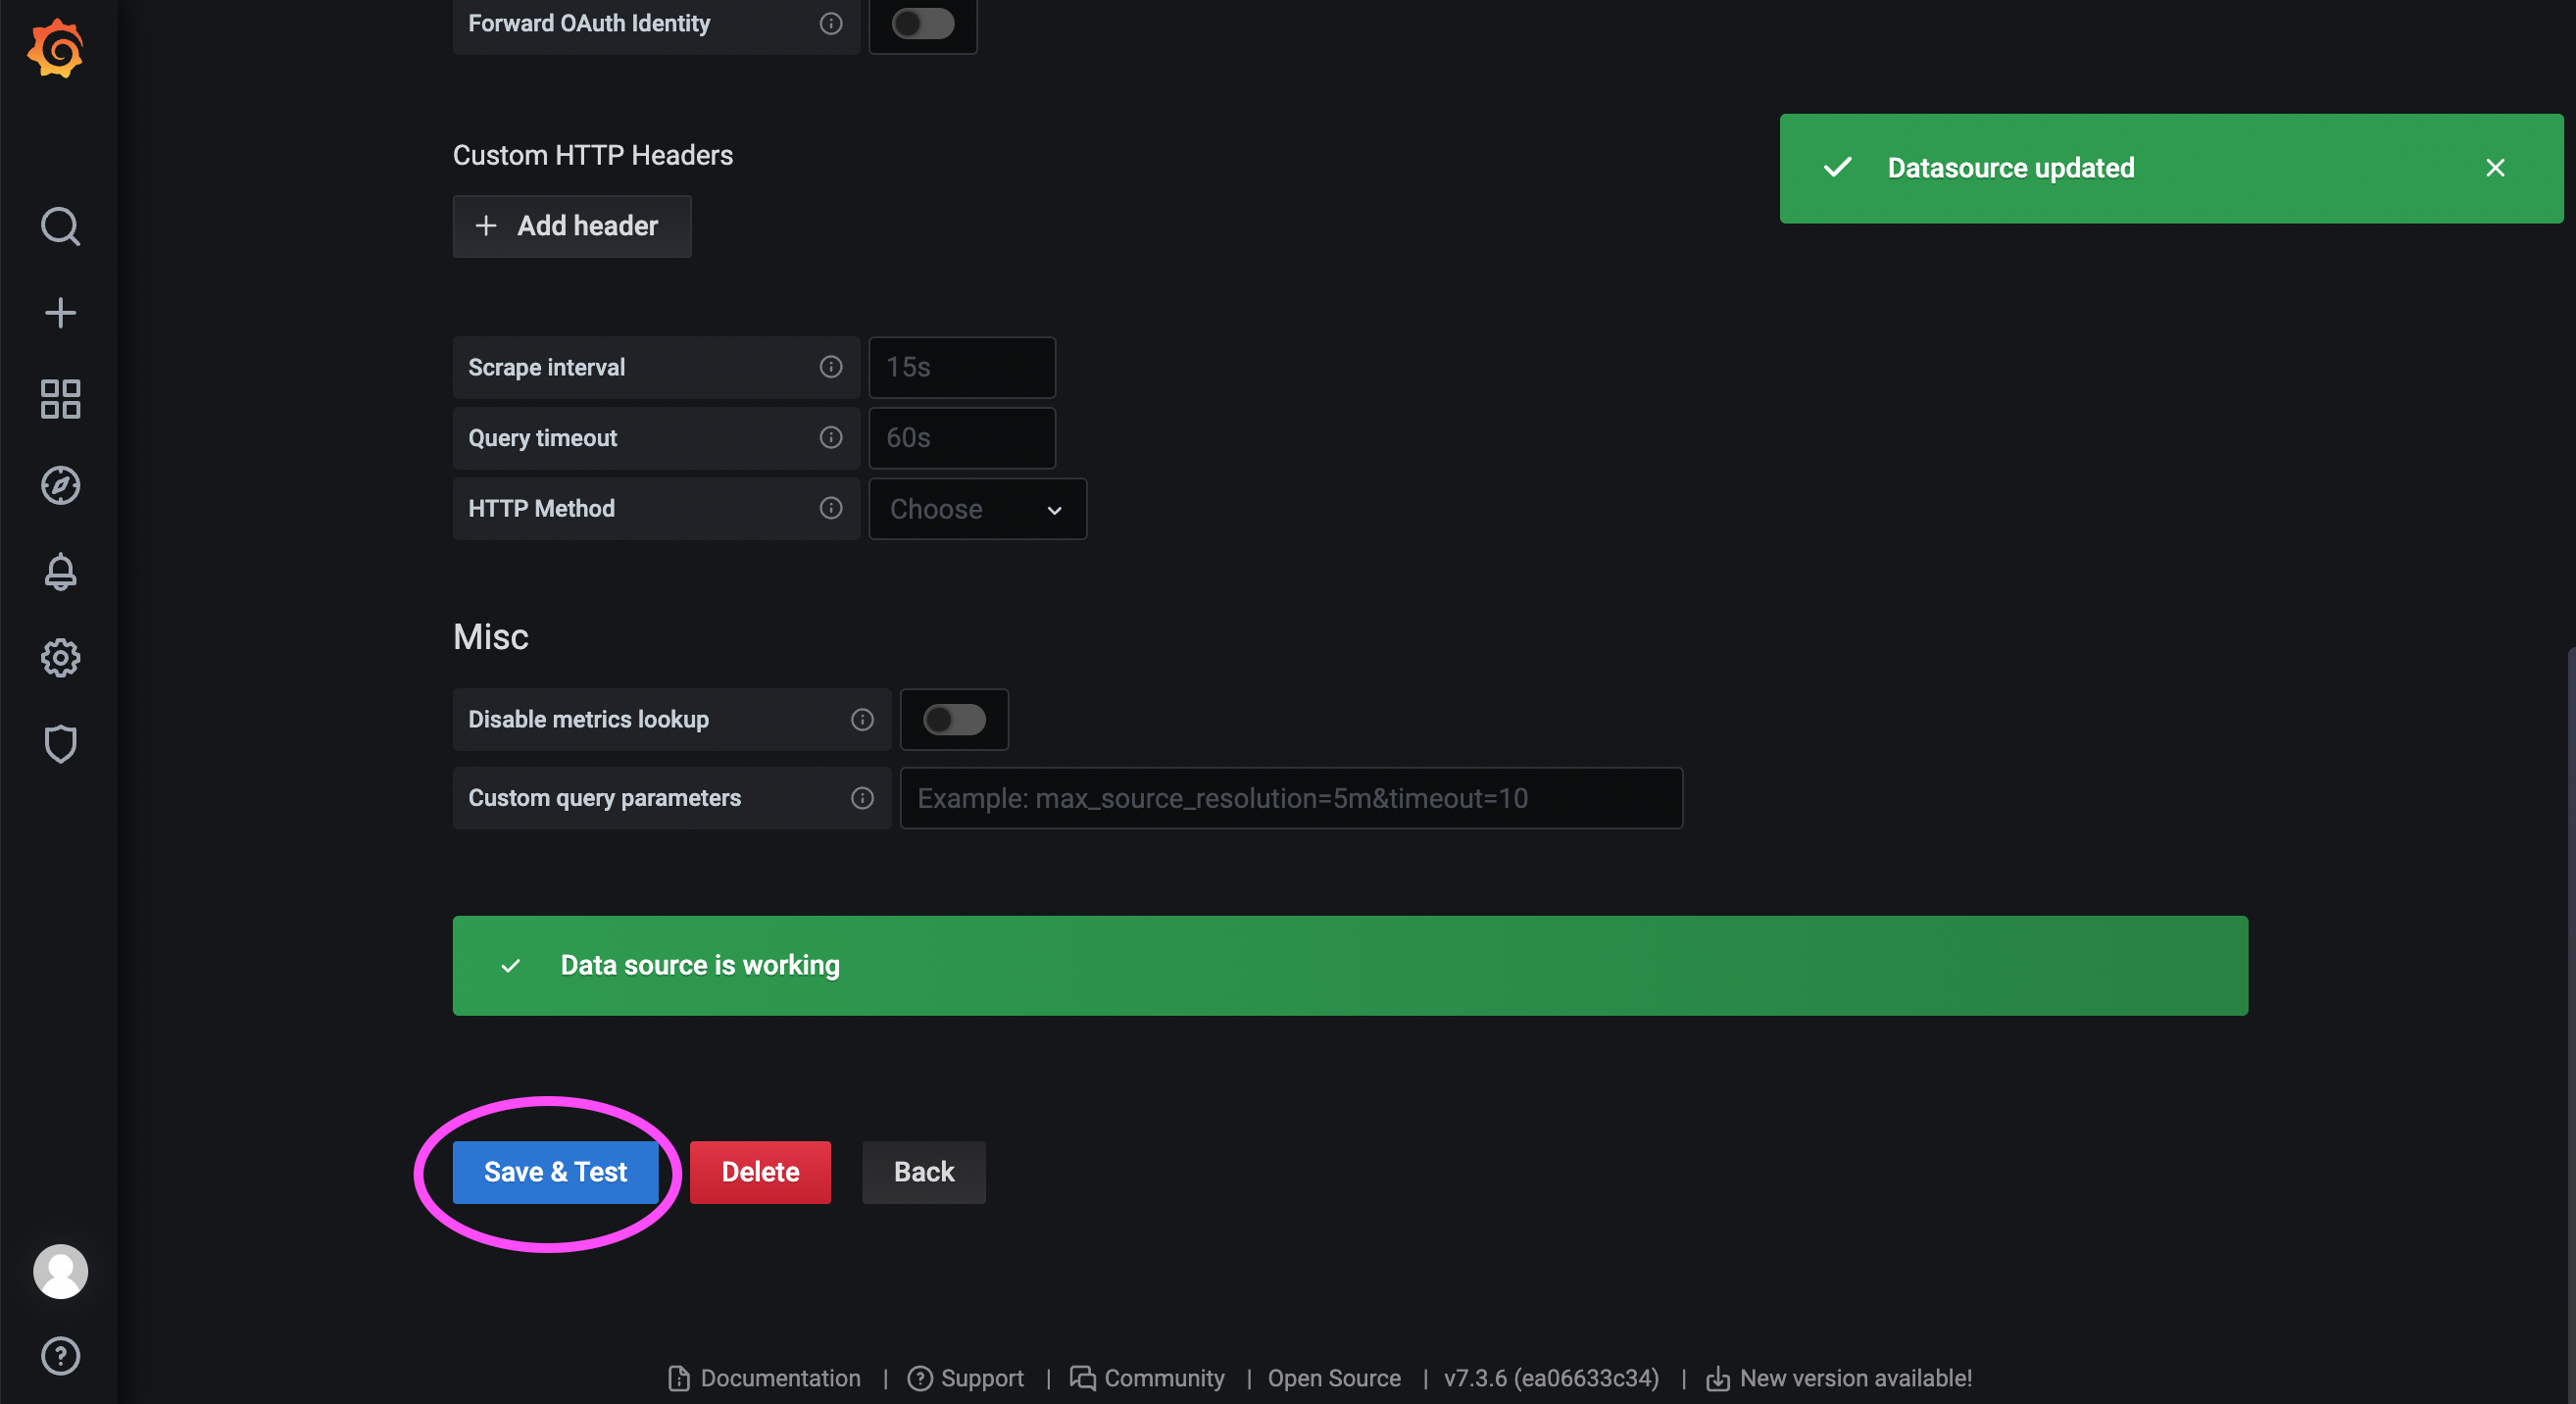
Assign a name to the data source, for example: MatrixDB-Prometheus. Then enter the IP address and port of Prometheus in the URL field:
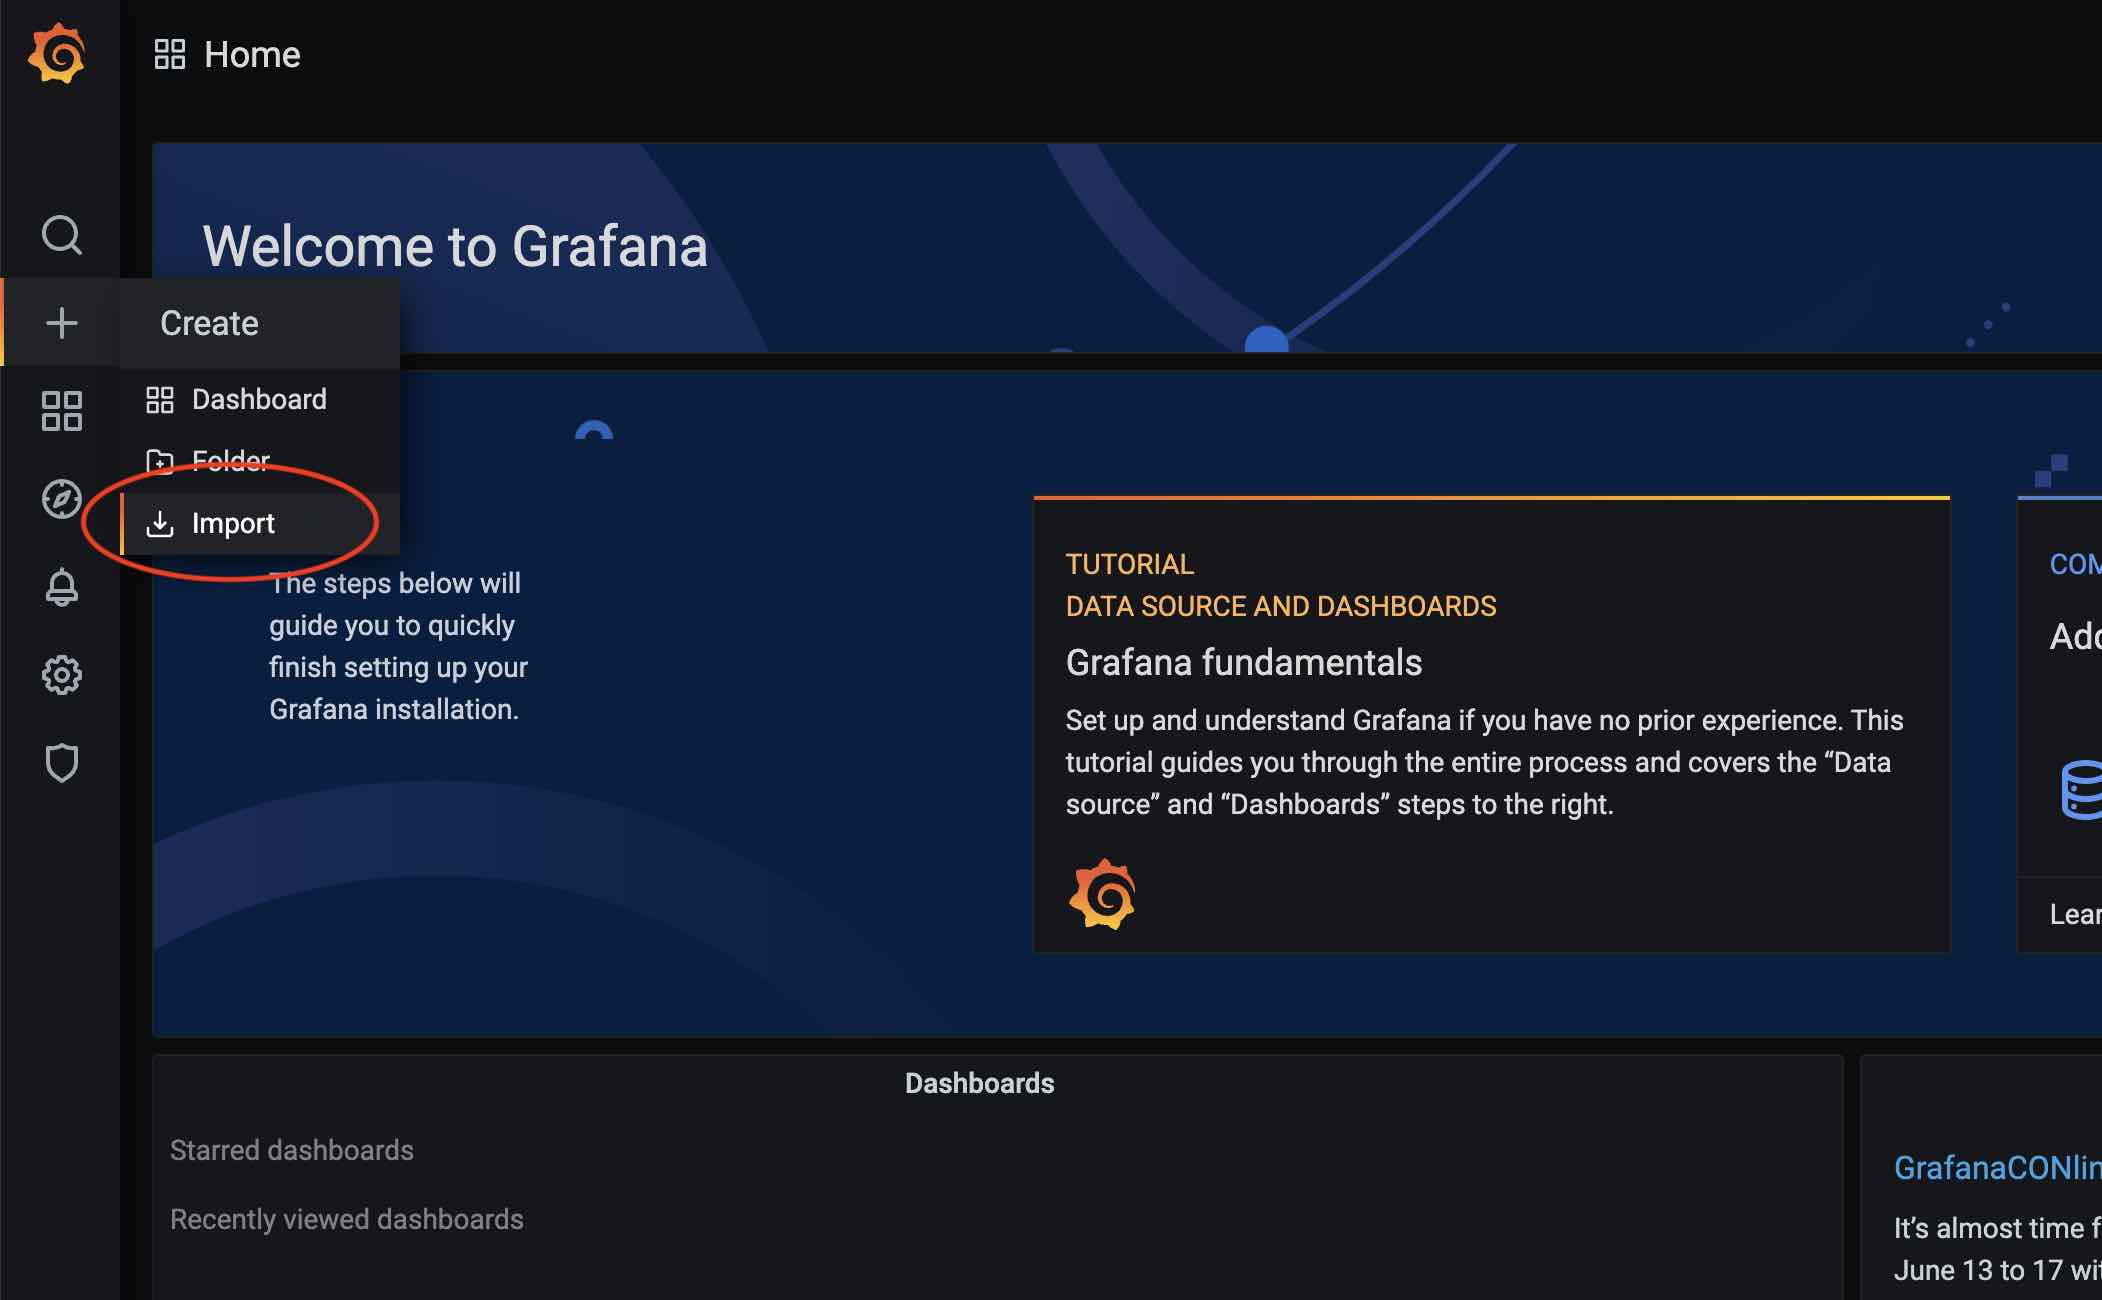
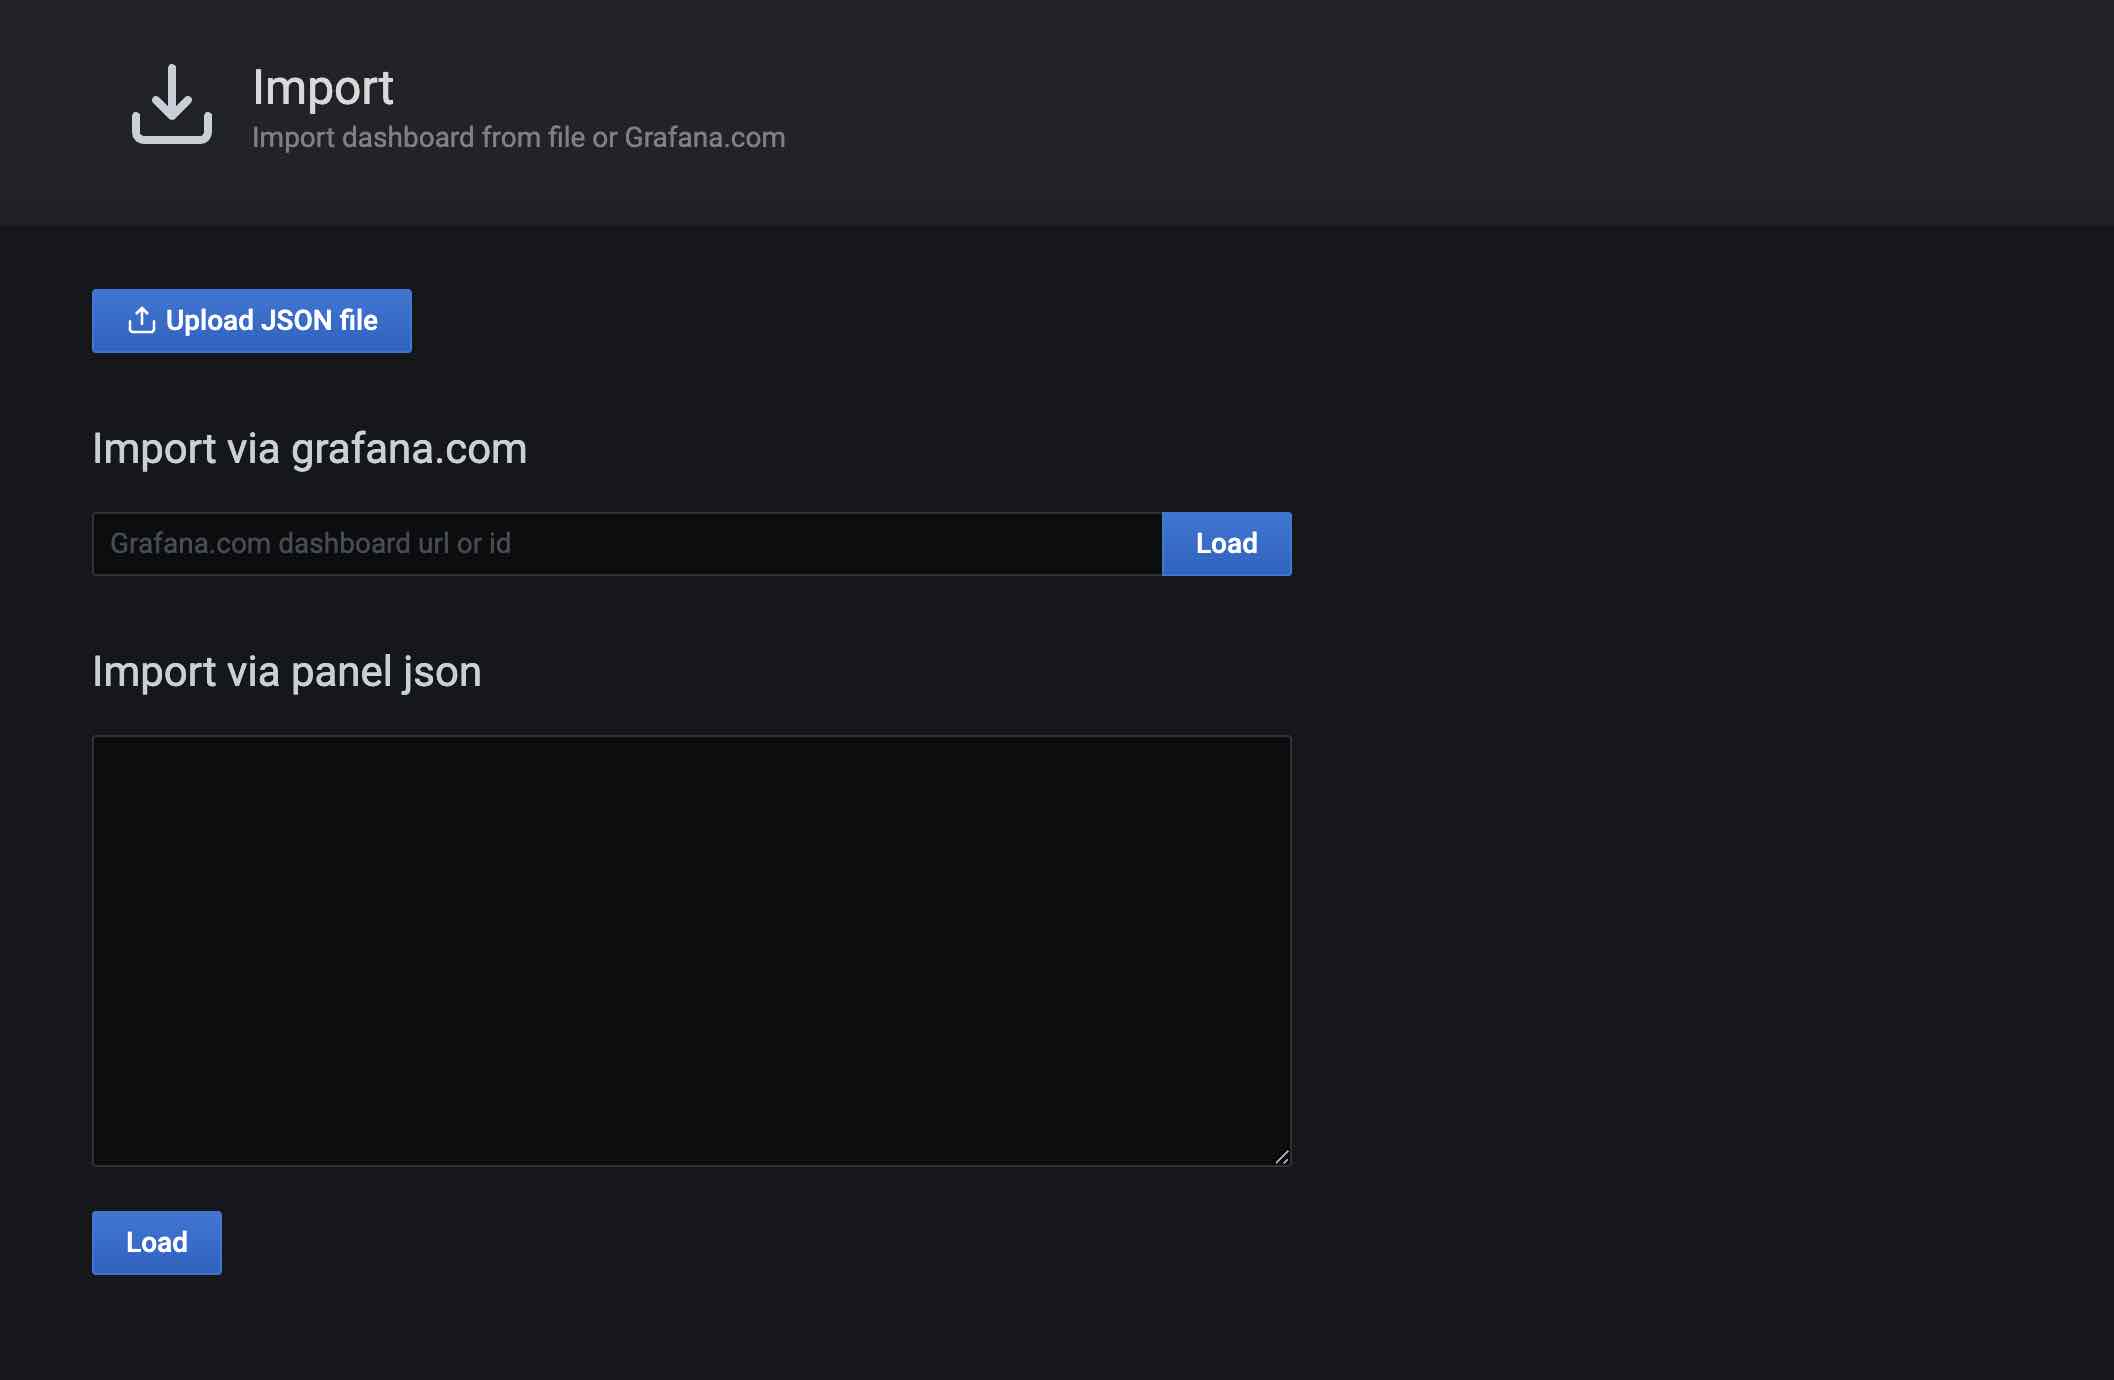
After adding the data source, proceed to load the Dashboard. Click the + button on the Grafana homepage and select Import:
There are several ways to import a dashboard: via official URL or ID, pasting JSON into a text box, or loading from a file.
Here, we choose to load from a file. The YMatrix Prometheus Dashboard is located in the installation directory at $GPHOME/share/doc/postgresql/extension/PrometheusDashboard.json. Load this file:
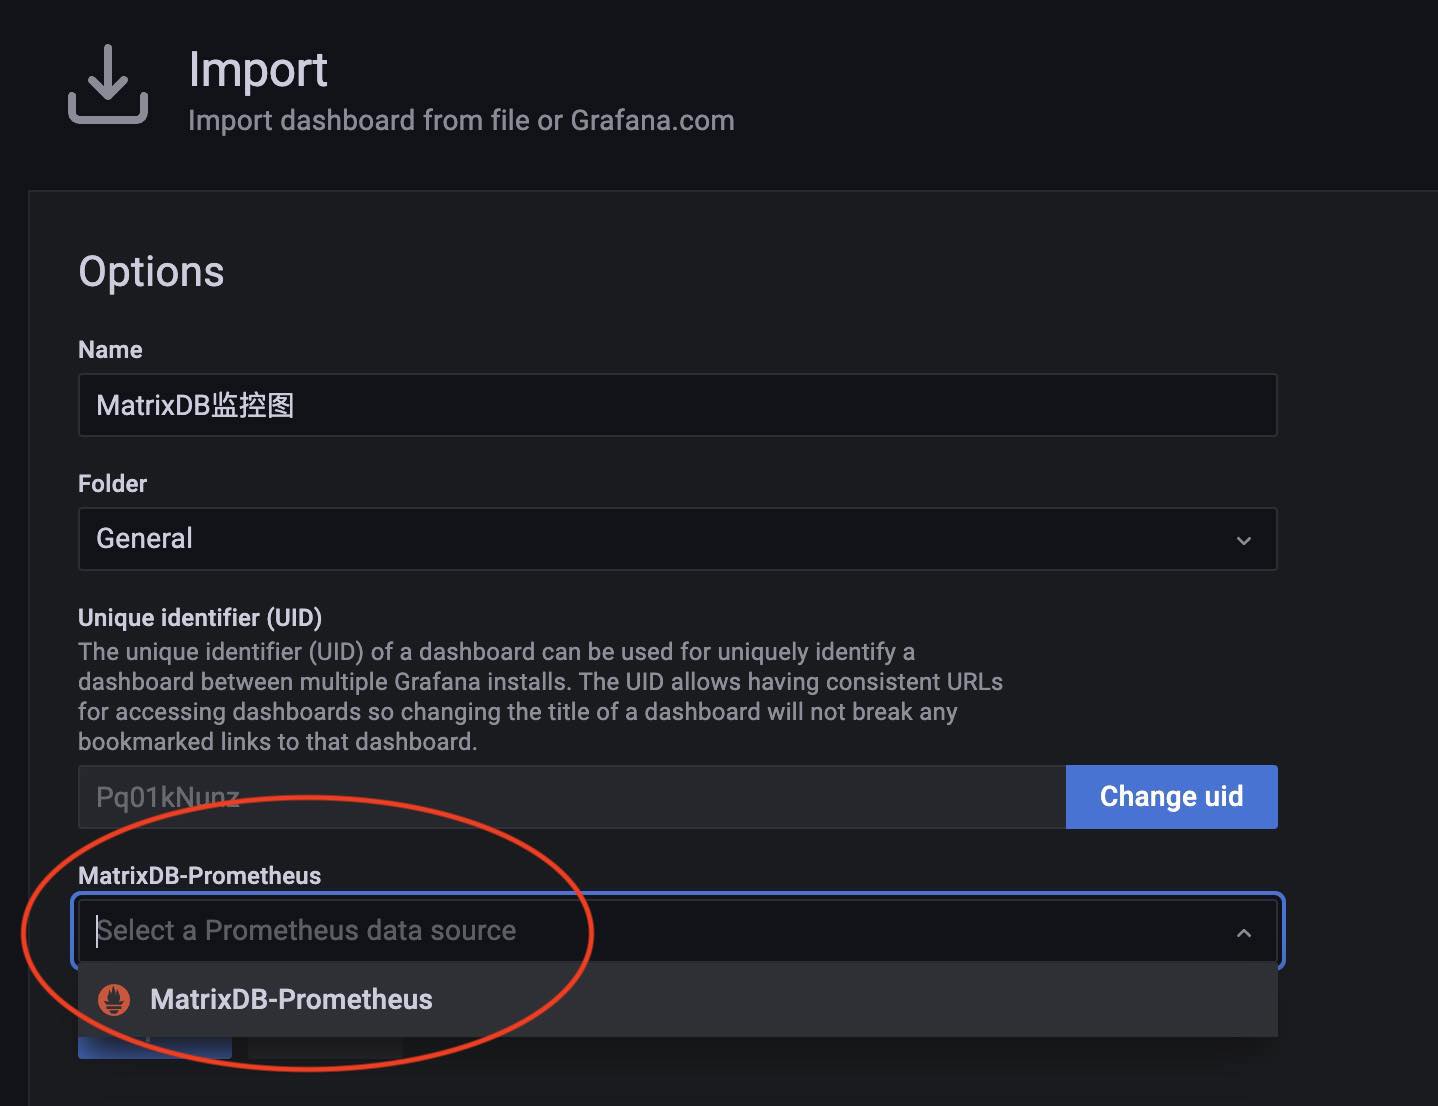
During file loading, select the Prometheus data source created earlier.
You will now see the imported dashboard in the dashboard list.
For detailed interpretation of the dashboard metrics, refer to YMatrix Monitoring Parameter Interpretation.
This section describes how to deploy the node_exporter dashboard.
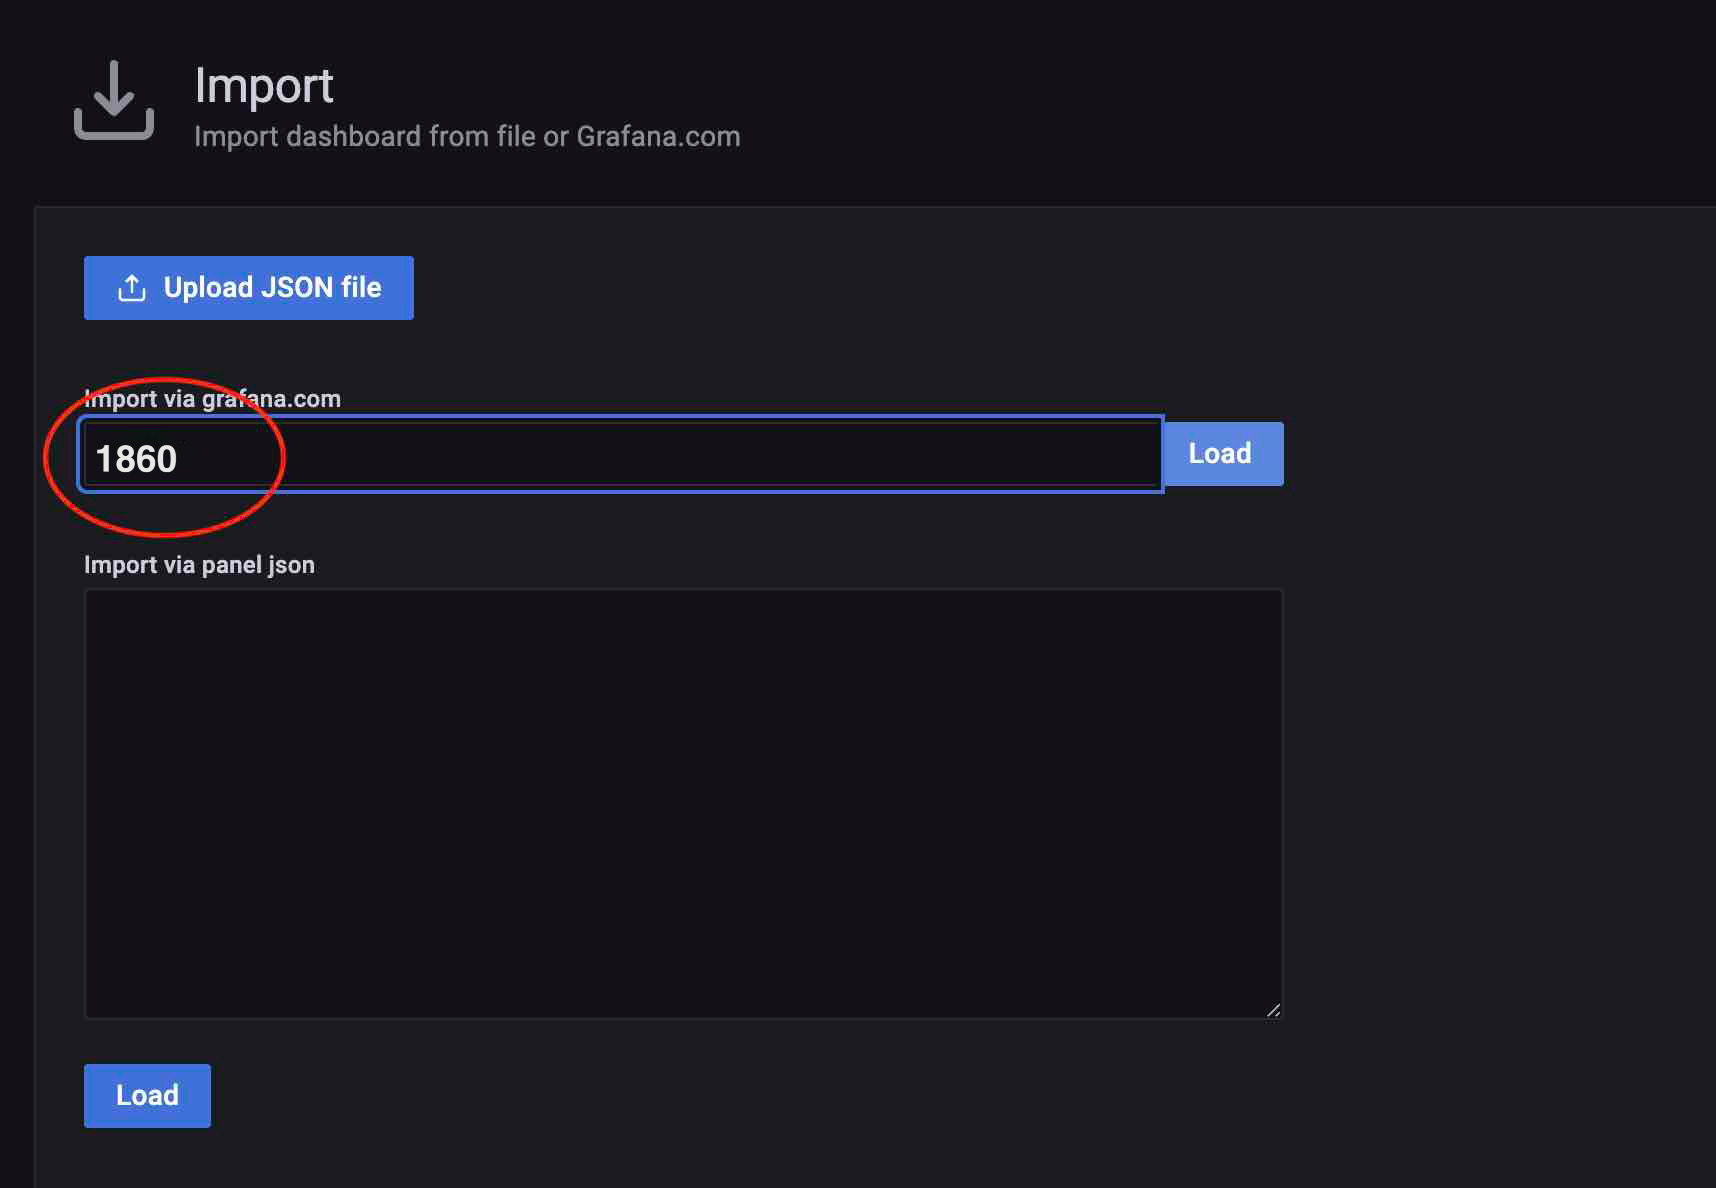
Load the node_exporter dashboard: The official Grafana website has published a corresponding Dashboard. Simply enter the dashboard ID to import it.
During import, select the previously added MatrixDB-Prometheus data source. If node_exporter uses a dedicated Prometheus cluster, you must add a separate data source.

Deploying gate exporter requires creating the matrixmgr database and installing the matrixts and matrixmgr extensions.
createdb matrixmgr;psql -d matrixmgr
matrixmgr=# CREATE EXTENSION matrixts;
matrixmgr=# CREATE EXTENSION matrixmgr;mxmgr_init_gate_exporter to initialize and start:matrixmgr=# SELECT mxmgr_init_gate_exporter();Upon success, a new schema named "gate_exporter" appears under the matrixmgr database. Tables and views in this schema contain monitoring and configuration data for MatrixGate. Do not modify their definitions or contents manually.
This command starts gate_exporter on the MXMaster host.
To stop gate_exporter, run mxmgr_remove_gate_exporter:
matrixmgr=# SELECT mxmgr_remove_gate_exporter();To restart, execute mxmgr_deploy_gate_exporter:
matrixmgr=# SELECT mxmgr_deploy_gate_exporter();Similar to loading the YMatrix monitoring panel, the MatrixGate dashboard file is located at $GPHOME/share/en/doc/postgresql/extension/MxgateDashboard.json. Load this file to complete setup.
For detailed metric explanations, refer to MatrixGate Monitoring Parameter Interpretation.
1. Configure Prometheus to Scrape etcd Metrics
Edit the configuration file:
$ cd prometheus-*
sudo vi prometheus.yml
Append the following at the end of the file:
  - job_name: "etcd"
    static_configs:
      - targets: ["172.31.33.128:4679", "172.31.45.253:4679", "172.31.35.134:4679"]
The targets array should be replaced with the addresses of all etcd nodes in your cluster.
You can find this information in the /etc/matrixdb6/physical_cluster.toml file on the MXMaster host:
$ cat physical_cluster.toml
cluster_id = '79LhQxjuwmXgSWZCjcdigF'
supervisord_grpc_port = 4617
deployer_port = 4627
etcd_endpoints = ['http://10.0.159.1:4679', 'http://10.0.172.185:4679', 'http://10.0.170.90:4679', 'http://10.0.146.2:4679', 'http://10.0.146.195:4679', 'http://10.0.150.110:4679', 'http://10.0.169.149:4679']
Note!
If the/etc/matrixdb6/physical_cluster.tomlfile does not exist and no etcd process is found, your cluster was not deployed using the 6.x architecture, and etcd monitoring does not apply.
2. Start Prometheus
./prometheus --config.file=prometheus.ymlNote!
Typically, you want Prometheus to run as a background system service. To achieve this, configure it as a systemd service.
3. Configure the etcd Dashboard in Grafana
Note!
Grafana version 8.2.5 or higher is required.
First, log in to the Grafana web interface. The default address is:
http://<IP_or_domain_of_installed_node>:3000a. Configure Data Source (DataSource)

172.31.23.21:9090 is the service port of the Prometheus instance deployed in the previous step.
b. Import Dashboard
Visit the Grafana community: https://grafana.com/grafana/dashboards/?search=Etcd+Cluster+Overview
The above link shows community-provided dashboards:
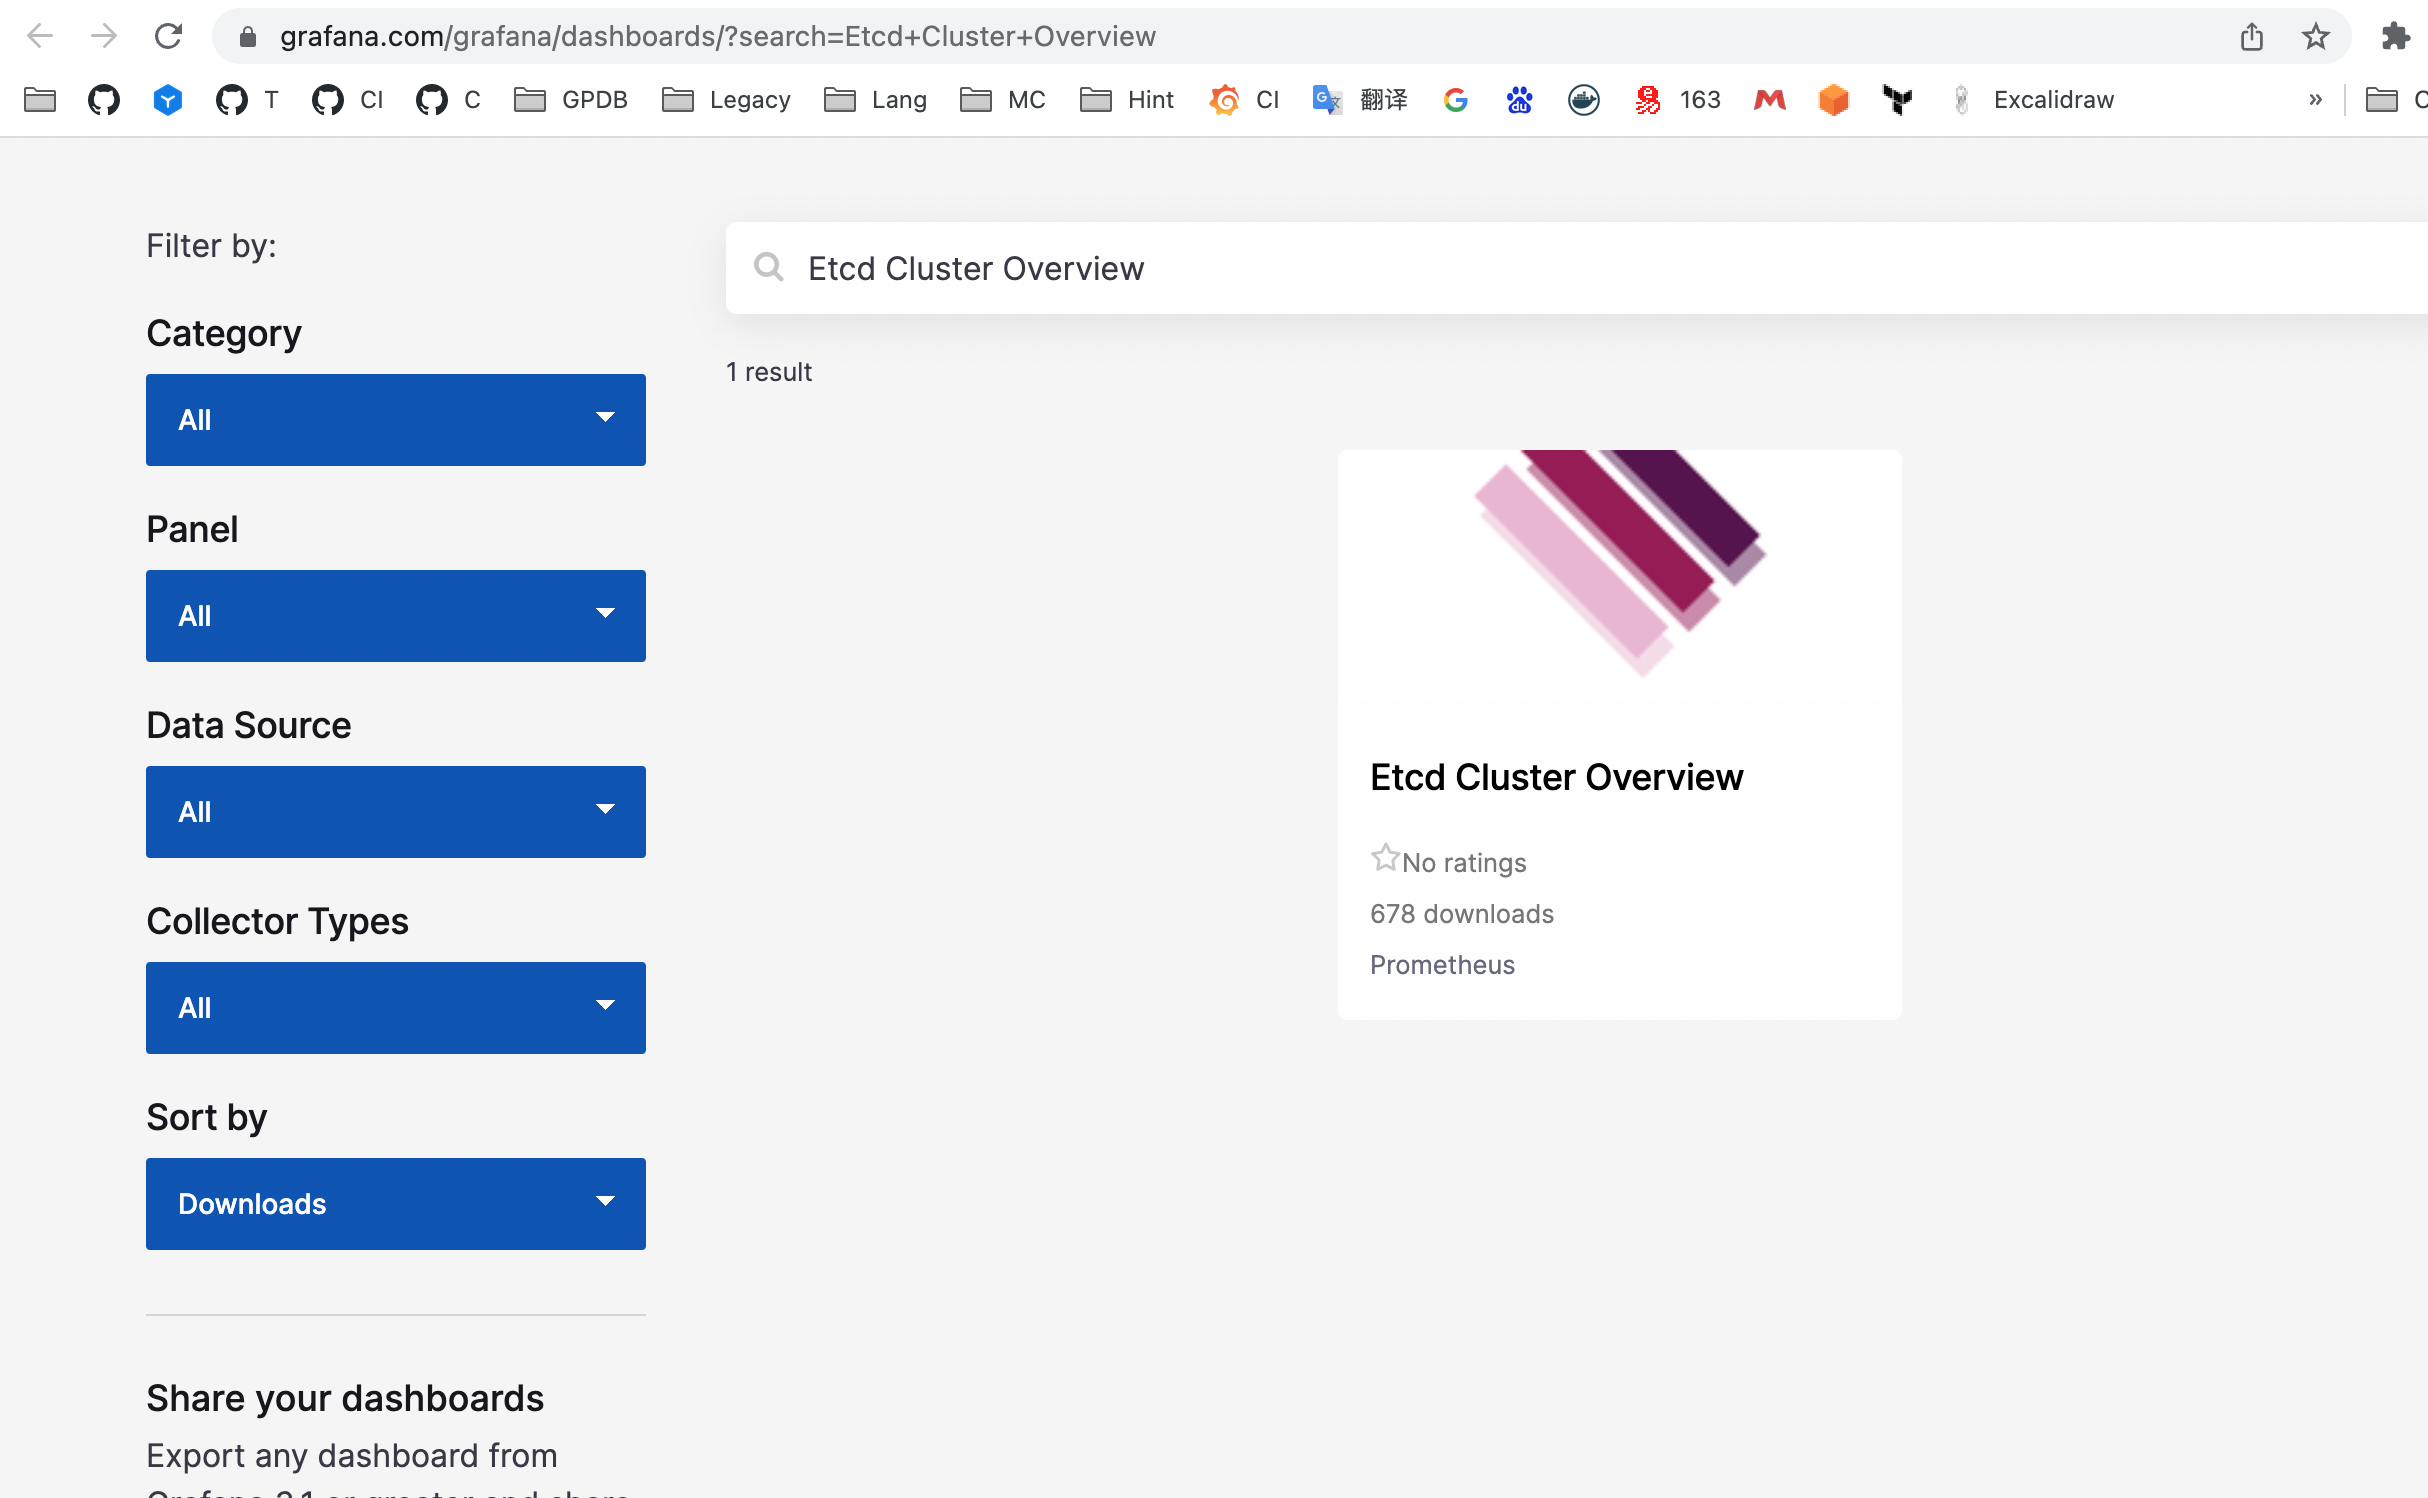
Click into the desired dashboard to obtain its ID:
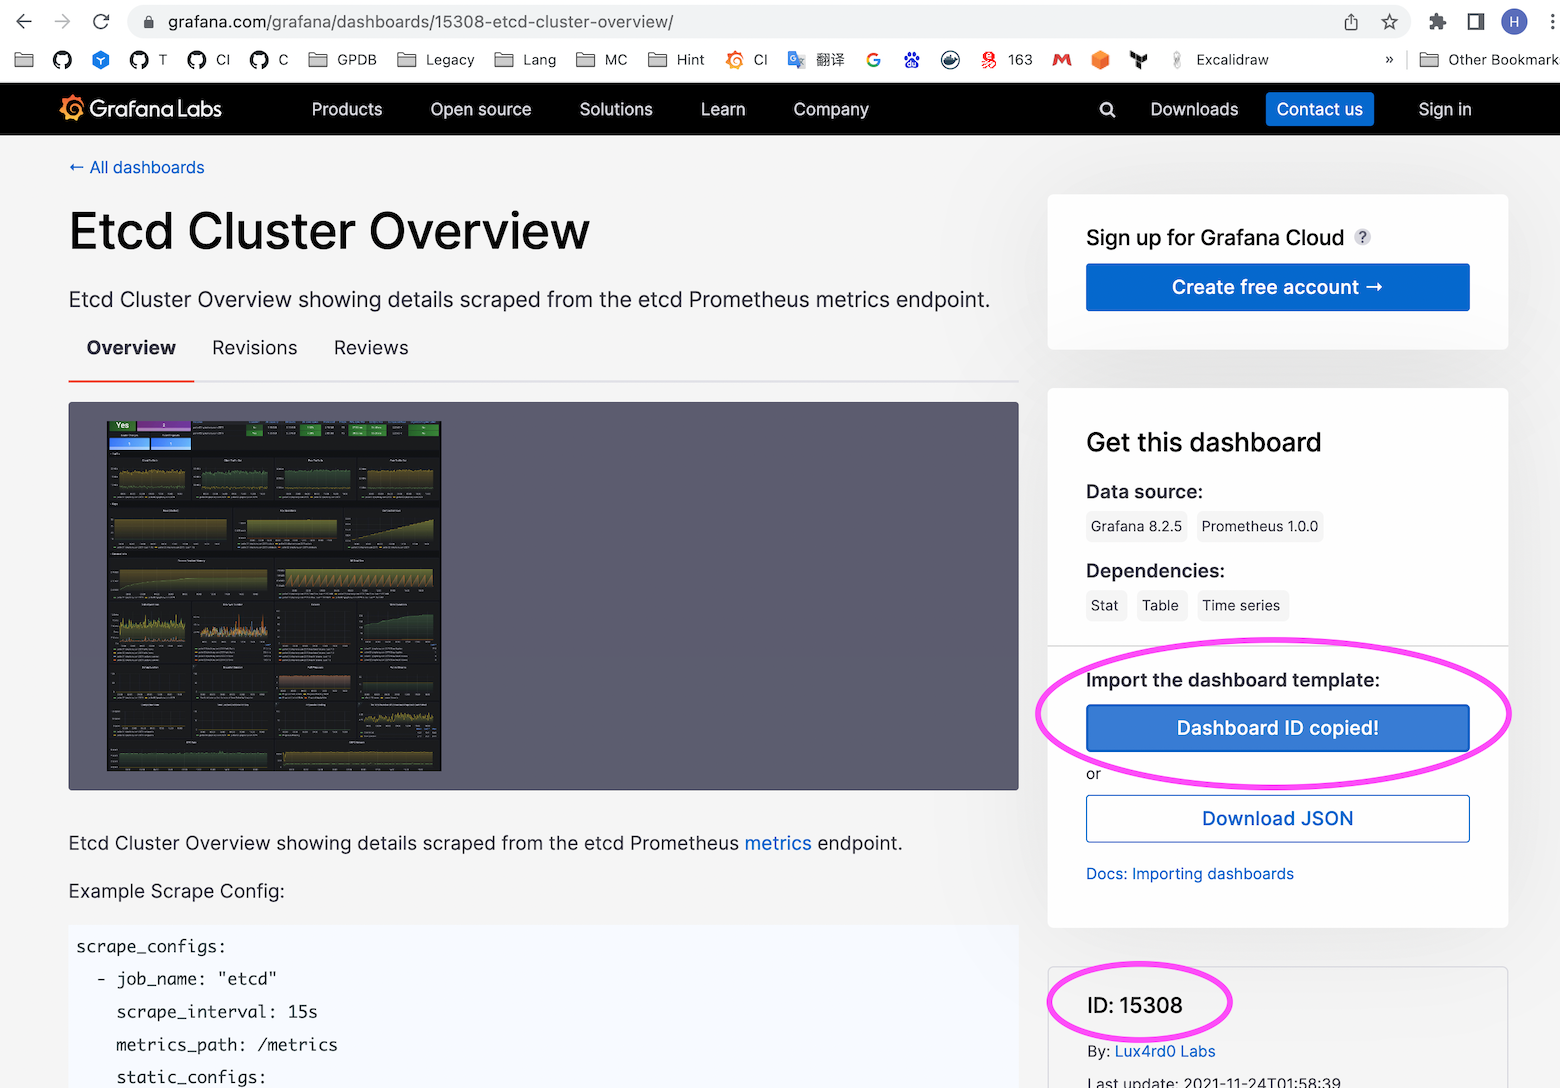
Note!
The dashboard associated with this ID may change over time. Currently, it is 15308; users should verify based on their own search results.
As shown below, we import dashboard ID 15308:
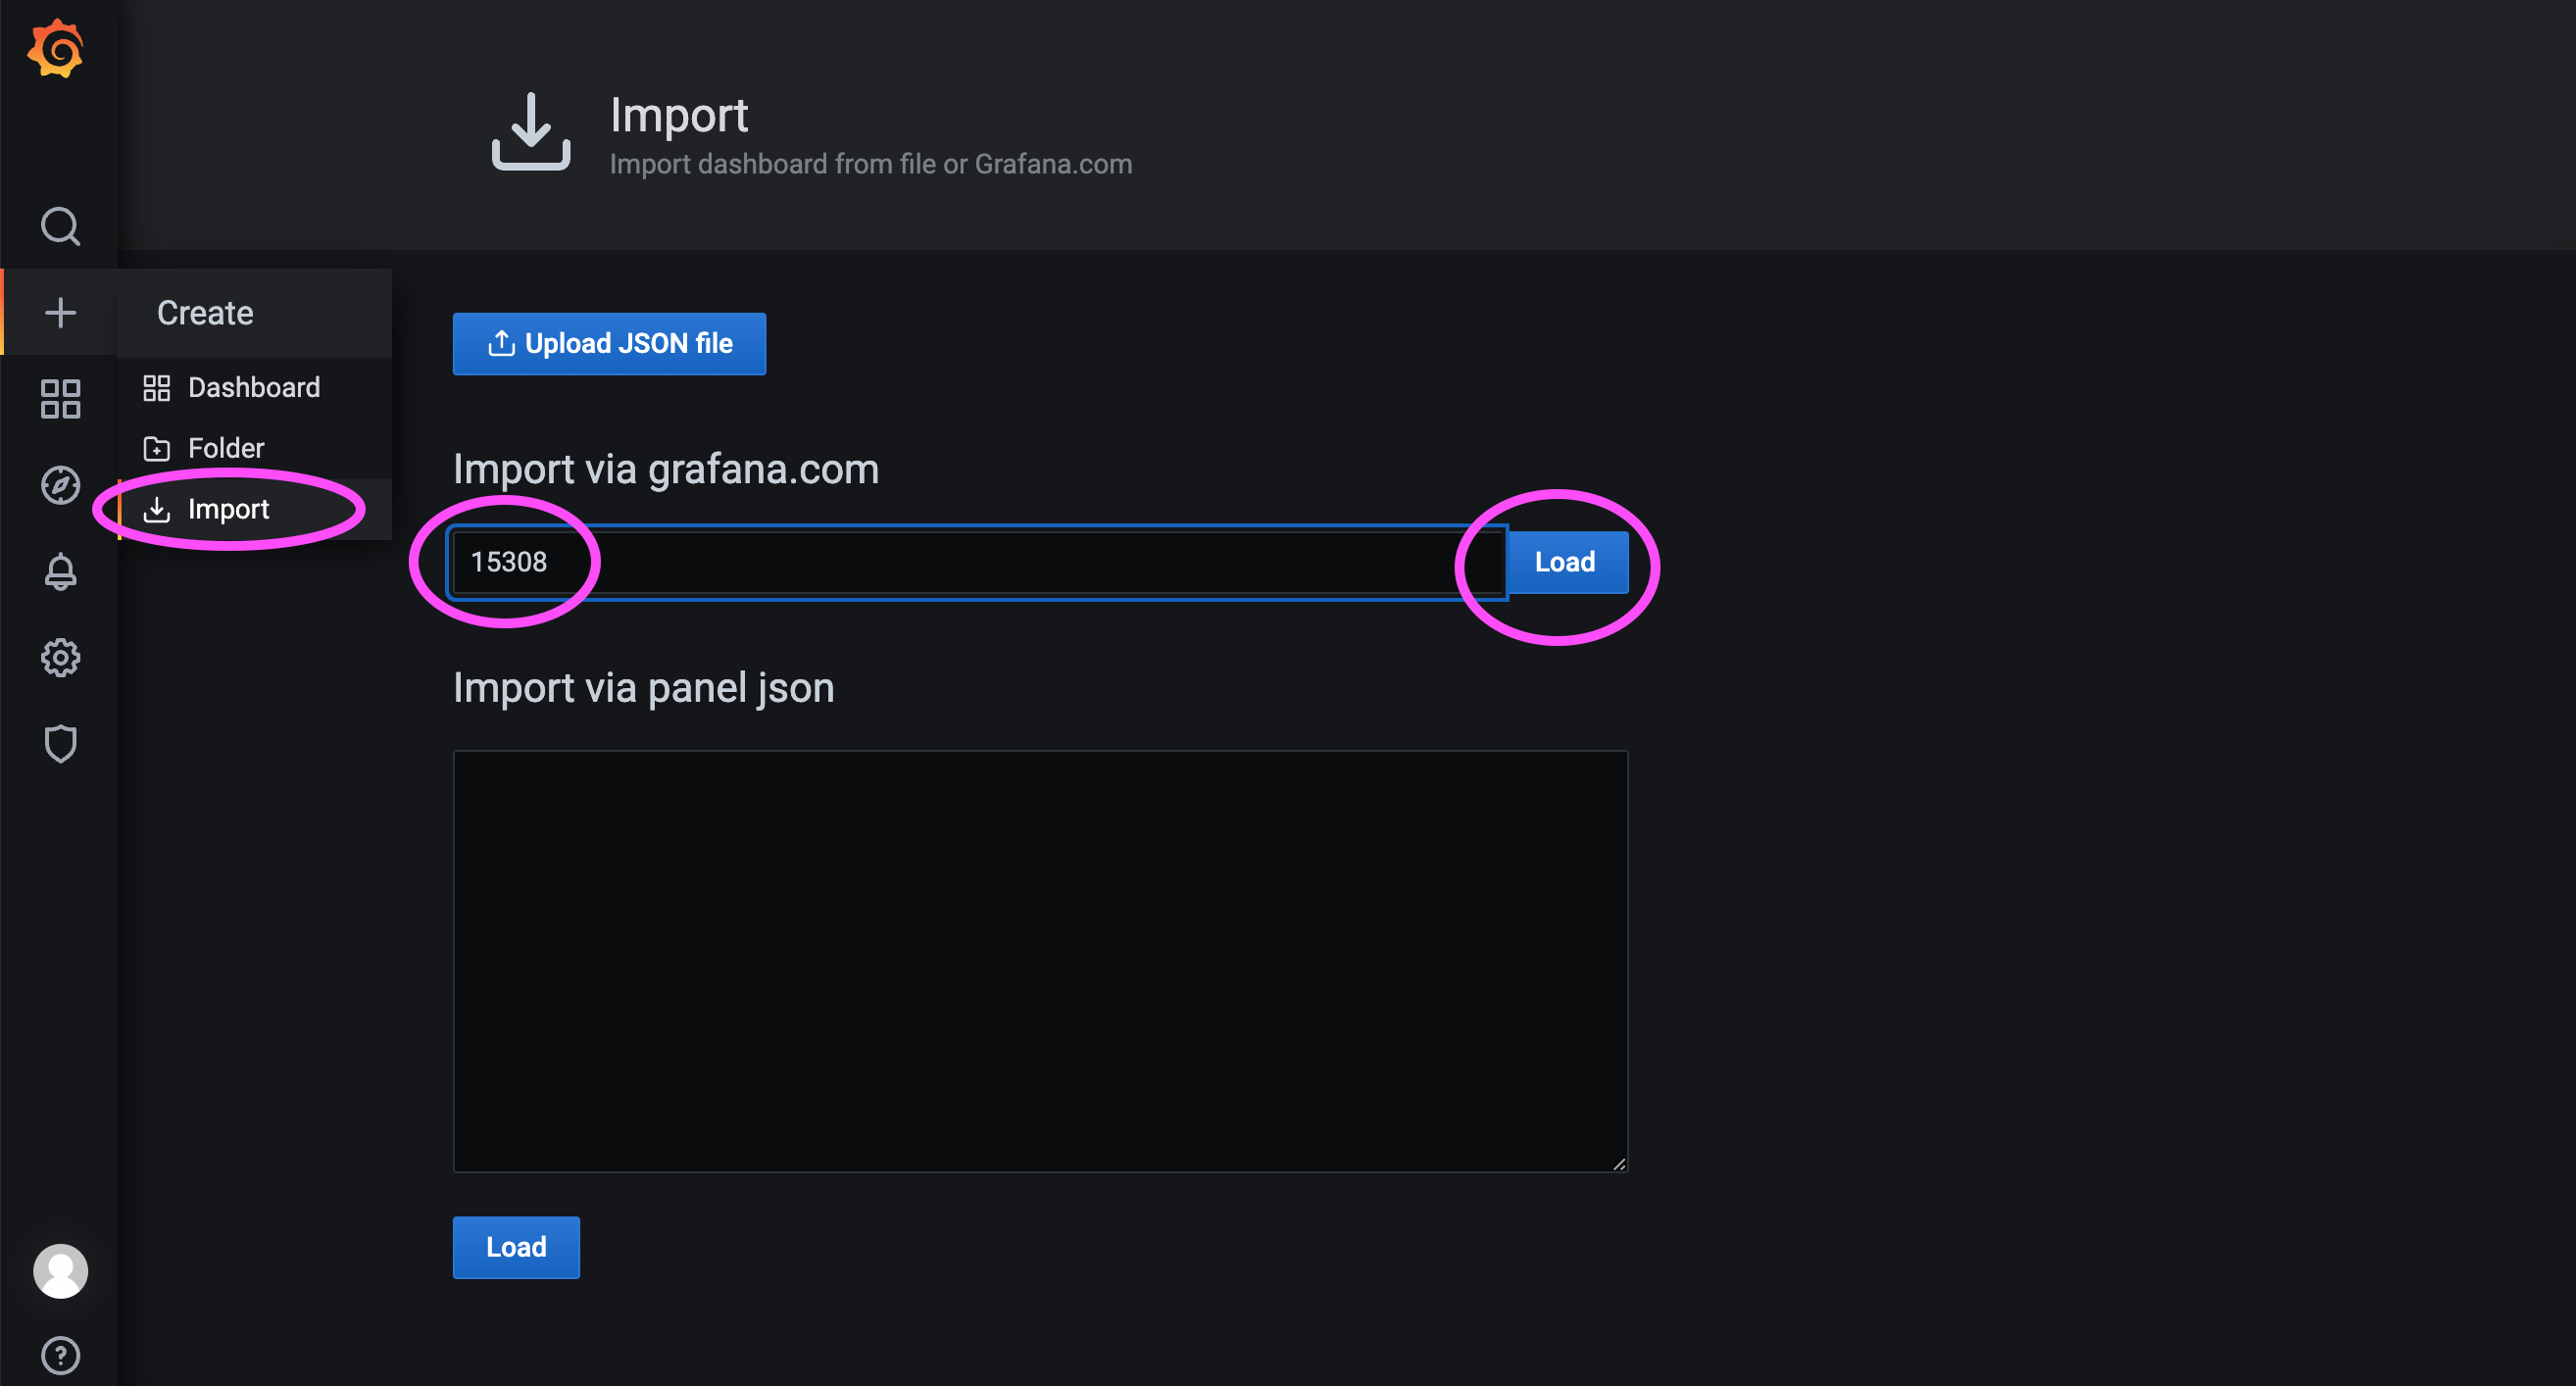
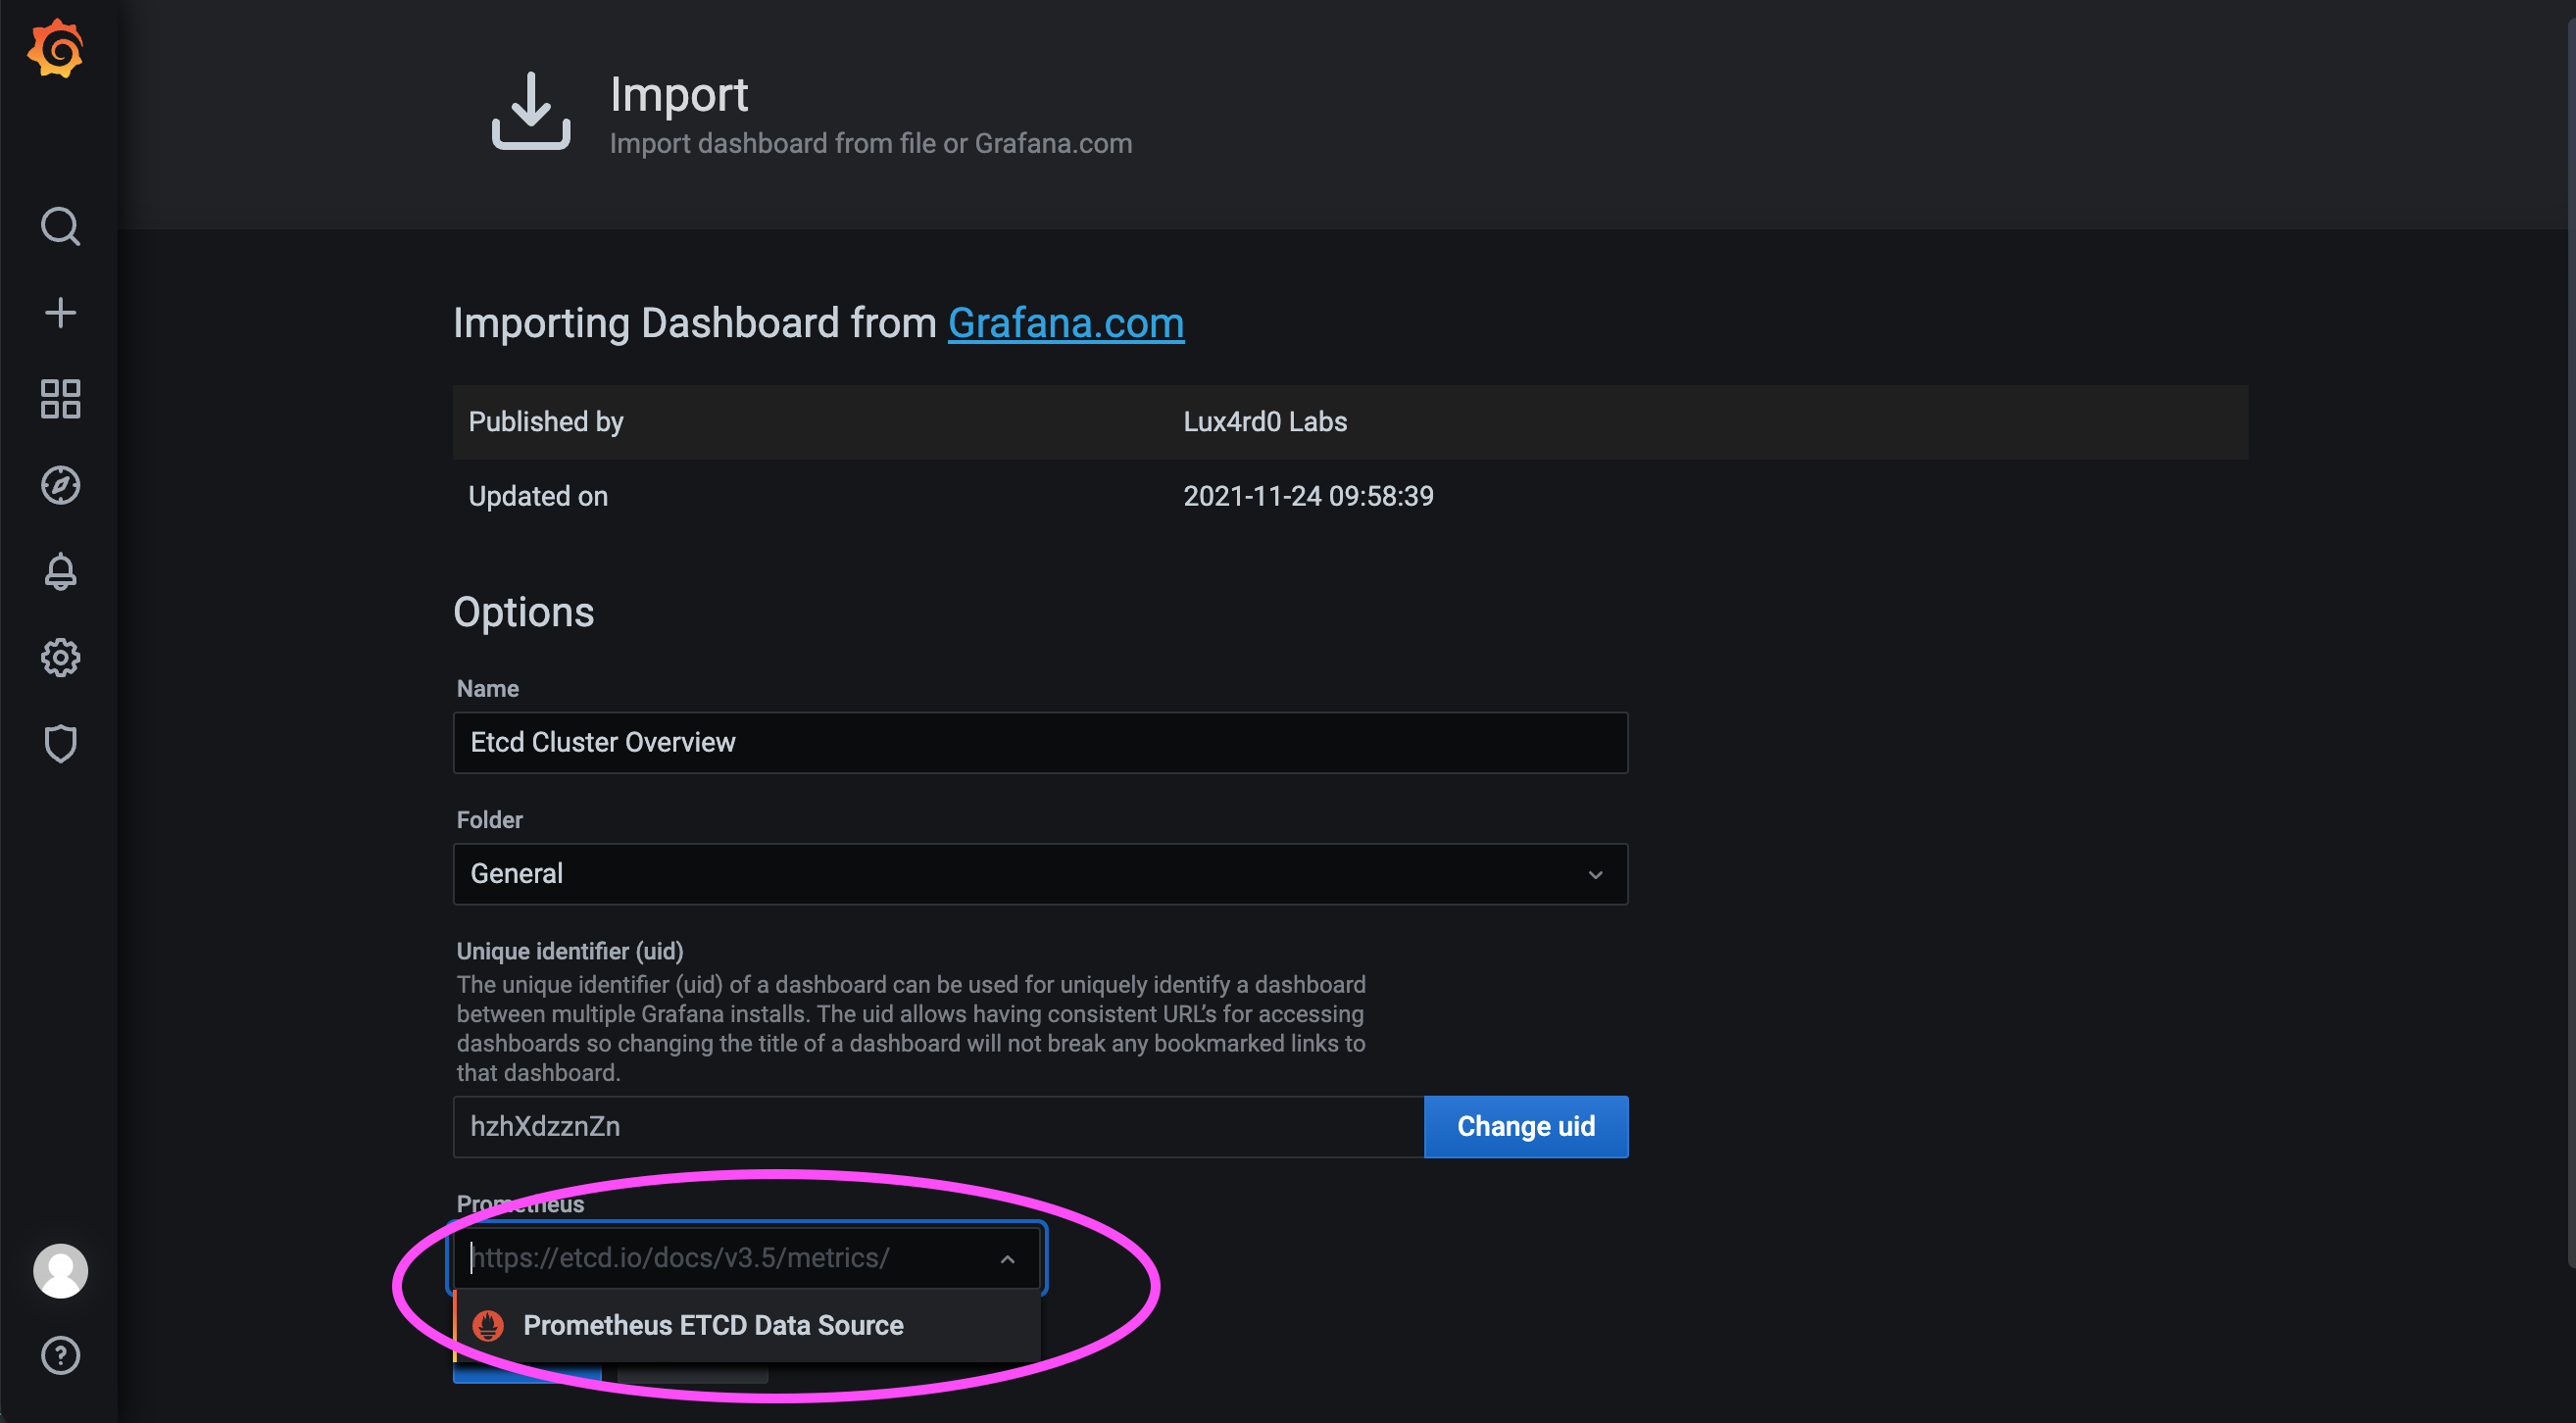
Next, select the data source configured earlier, then load the dashboard:
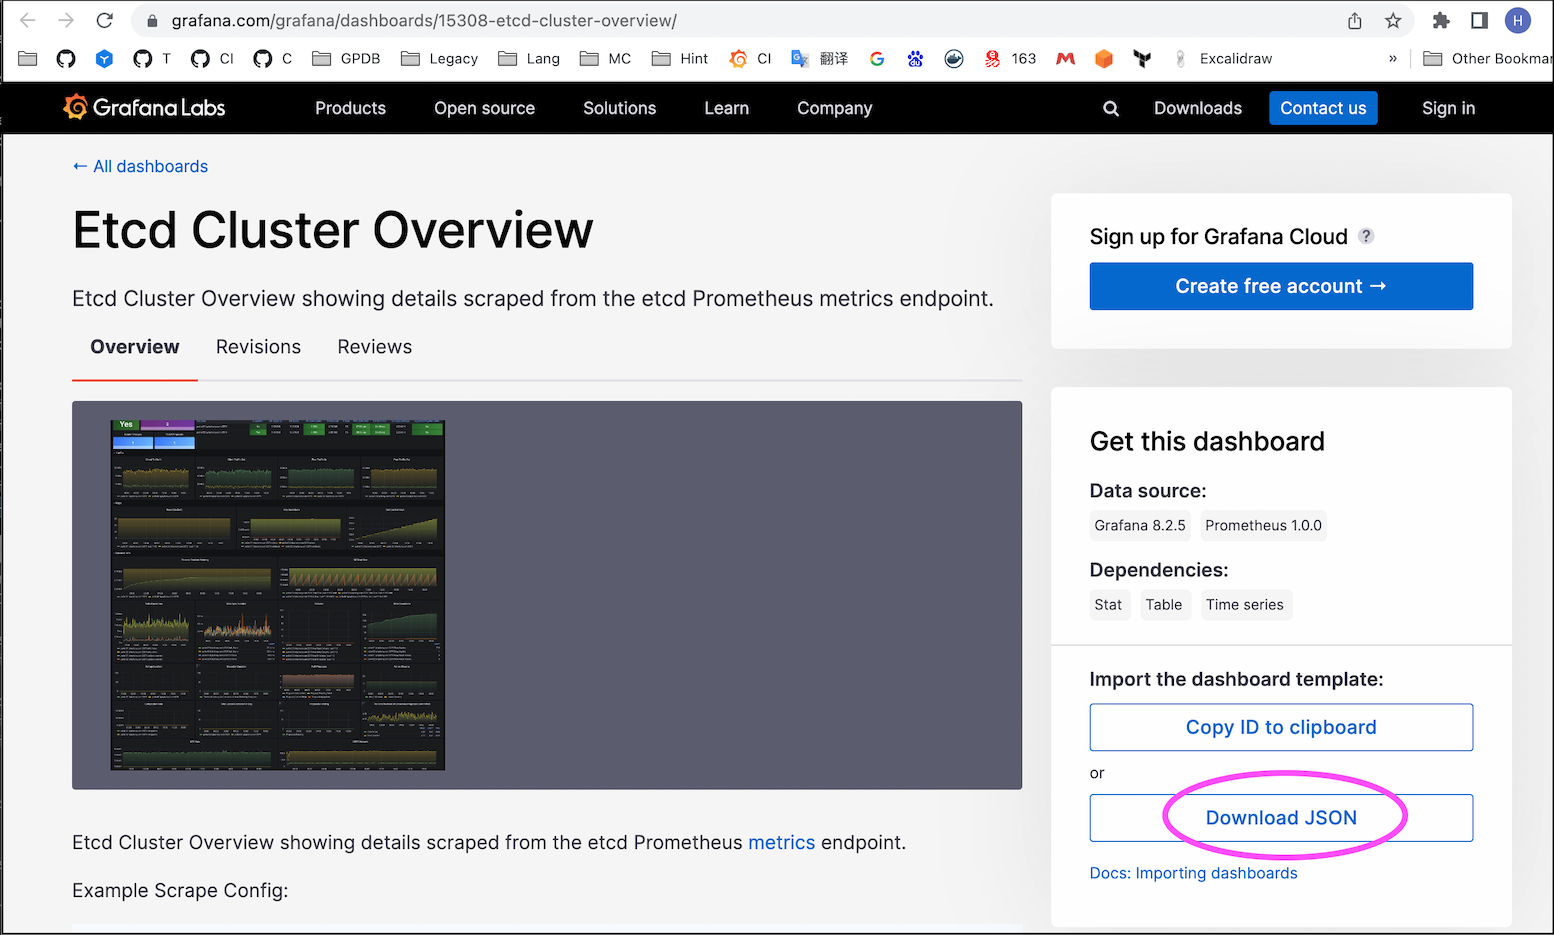
If the server is in an internal network and cannot import by ID 15308, download the JSON file of the Dashboard from an internet-connected machine and import it manually:
For more information on key items in the etcd dashboard, see etcd Documentation.