Quick onboard
Deployment
Data Modeling
Connecting
Migration
Query
Operations and Maintenance
Common Maintenance
Partition
Backup and Restore
Expansion
Mirroring
Resource Management
Security
Monitoring
Performance Tuning
Troubleshooting
Reference Guide
Tool guide
Data type
Storage Engine
Executor
Stream
DR (Disaster Recovery)
Configuration
Index
Extension
SQL Reference
This document introduces the cluster health monitoring functionality of the graphical user interface.
The YMatrix database executes a massive number of SQL statements to support daily operations, which may encounter hardware issues such as network failures or lock waits caused by transaction concurrency. If not addressed promptly, these issues can lead to slow client response times or even direct errors, thereby impacting operational efficiency. To better address these issues, the health monitoring functionality of the graphical user interface can assist you in quickly identifying abnormal behavior within the database cluster.
Health monitoring regularly checks corresponding database system tables based on different monitoring items to verify whether query execution states align with business expectations. If any deviations from expected states are detected, an alert notification is immediately sent. These notifications can be viewed in the graphical interface. If you find it inconvenient to constantly check the page, you can opt for email notifications to receive alerts more promptly.
Enter the IP address of the machine where MatrixGate is located (default is the Master's IP) and the port number in the browser to log in to the graphical interface.
http://<IP>:8240After successfully logging in, enter the Health Monitoring page.
 You can choose whether to configure your email address as needed. If you complete the email configuration, you will receive email notifications.
Graphical Interface Domain Name To facilitate timely access to detailed alert information, we will include a link in the email to redirect to the graphical interface. If the email recipient cannot access the default domain name, this field must be modified.
SMTP Server Address
The SMTP server address consists of an IP address and port number. Example: smtp.example.com:465.
Common Third-Party Email Servers
Notes!
If the email service is set up by the enterprise itself, consult the email administrator or email service provider.
Username
The account used for authentication on the SMTP server. This field is optional and only required when the SMTP server requires a username for authentication. Example: [email protected].
Password
The password for the SMTP username. This field is optional and only required when the SMTP server requires both a username and password for authentication.
Notes!
If the email service is set up by the enterprise itself, consult the email administrator or email service provider.
Sender
If using a third-party email service, this field should be consistent with the “username” content;
if using a self-built email service, just fill in the sender's email address.
Recipient
Enter the recipient's email address; multiple addresses can be entered.

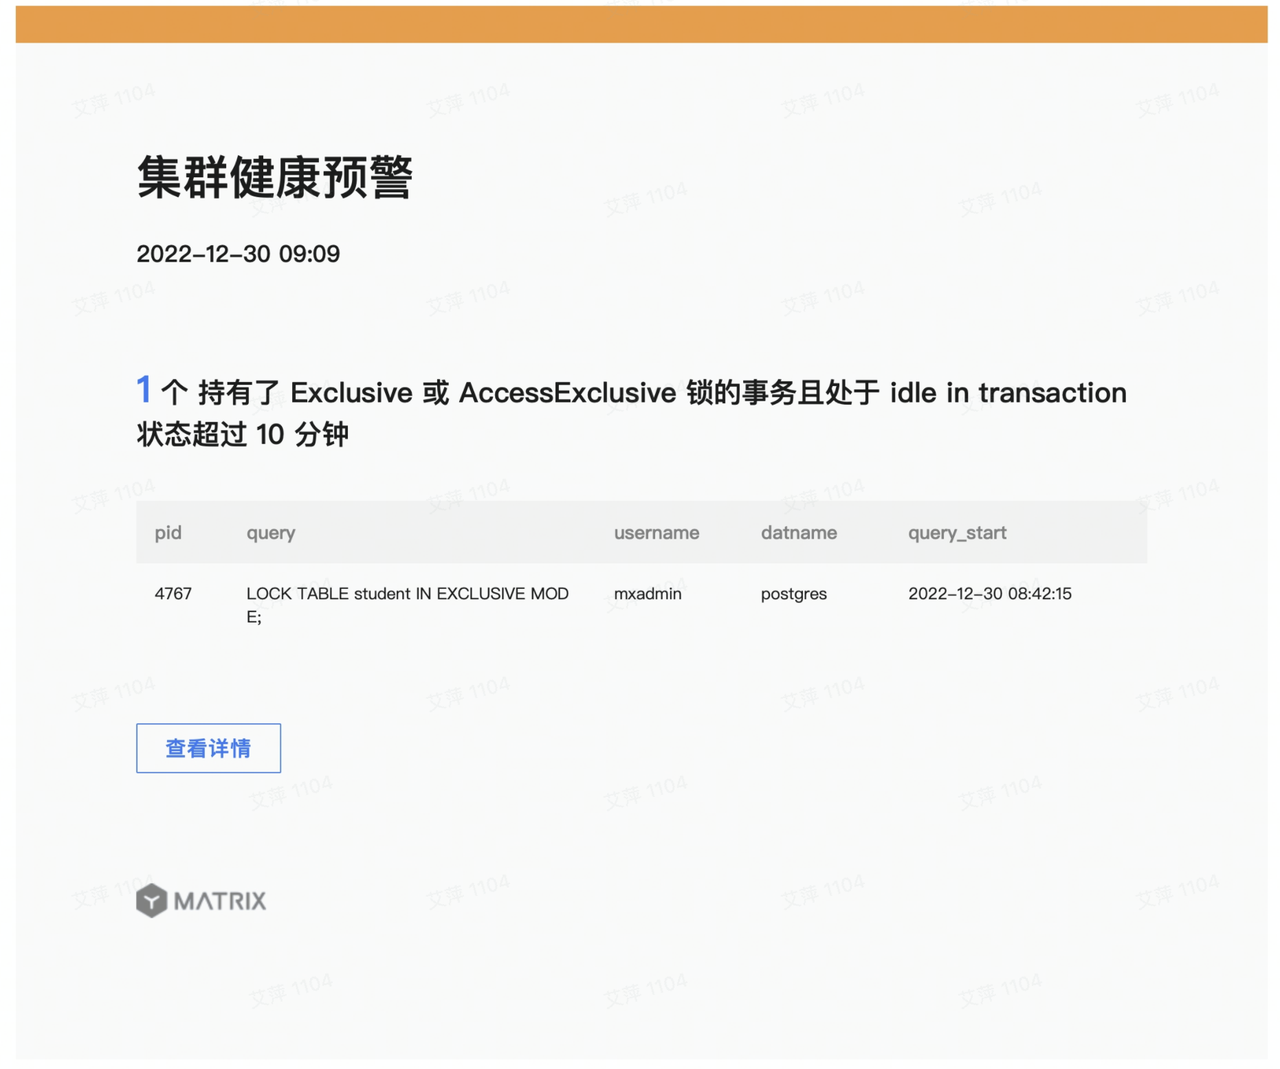
If you have configured an email address, you will receive an email when an event occurs that meets the detection project failure conditions.
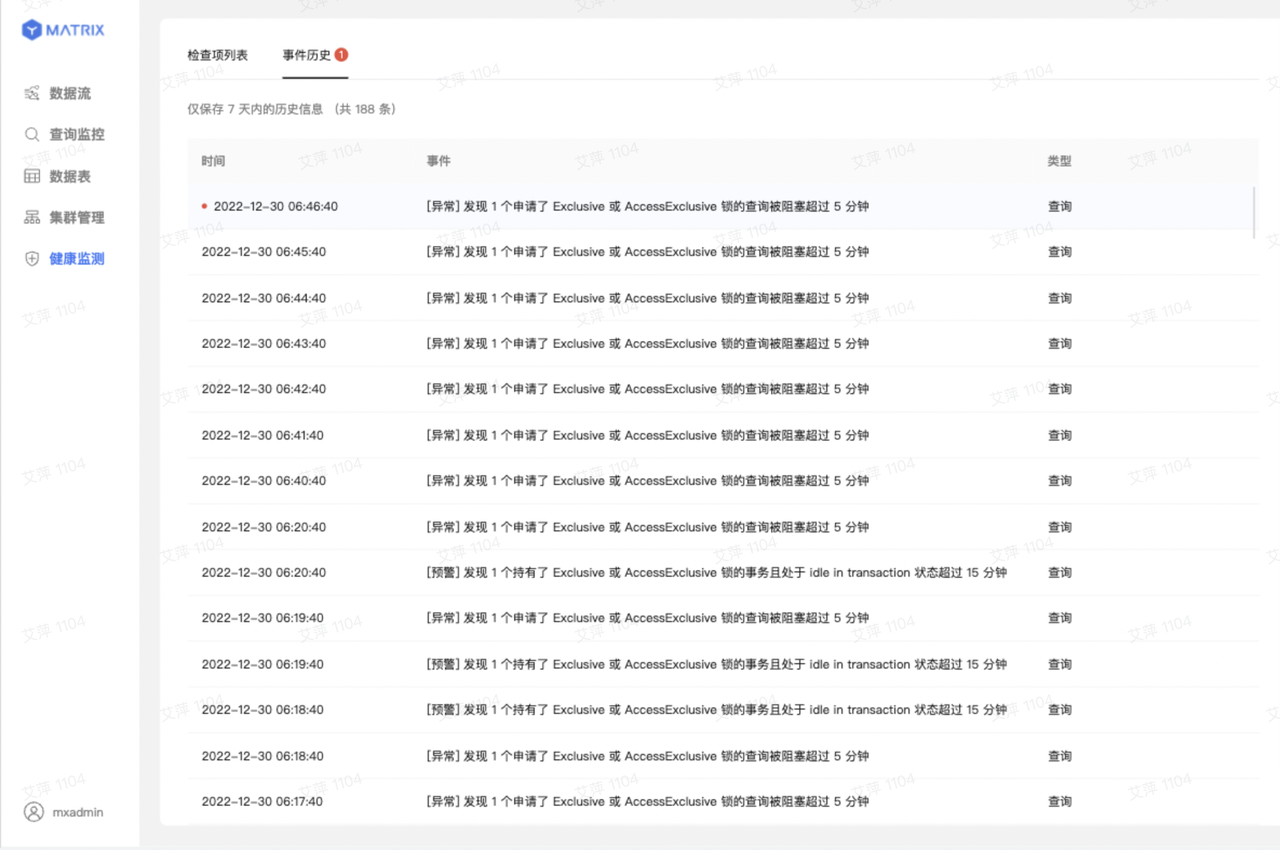
Regardless of whether you have configured an email address, you can view records of events that occurred in the cluster and met the fault conditions of the detection items in the “Event History” section.
The list of monitoring projects provided by YMatrix is as follows:
| Serial number | monitoring projects | Explanation |
| 1 | Cluster unavailable | Periodically run the query SELECT * FROM gp_dist_random('gp_id'); to verify cluster availability. If this query fails three consecutive times, the cluster is most likely down, possibly due to simultaneous failure of the primary and mirror segments, network outages, power failures, or hardware issues. |
| 2 | Segment failure | When a primary segment fails, the corresponding mirror segment’s host becomes resource-skewed, its load increases, and query latency rises; in severe cases the skewed node may exhaust memory and render the cluster unavailable. When a mirror segment fails, the cluster’s high availability is reduced; if the corresponding primary segment subsequently fails, the cluster becomes unavailable. |
| 3 | Query/transaction duration exceeds 12 hours | Long-running queries/transactions can monopolize large amounts of memory and CPU, slowing database responsiveness and potentially triggering OOM (out-of-memory) conditions; they may also delay the VACUUM process. |
| 4 | Transaction idle in transaction for more than 1 hour | A transaction remaining idle in transaction for an extended period blocks most queries on its affected tables and prevents VACUUM from reclaiming dead tuples, causing table bloat. |
| 5 | Single query/transaction blocks more than 5 other queries for over 15 minutes | When one query/transaction blocks many others for a prolonged time, cascading waits can occur, severely degrading service responsiveness. |
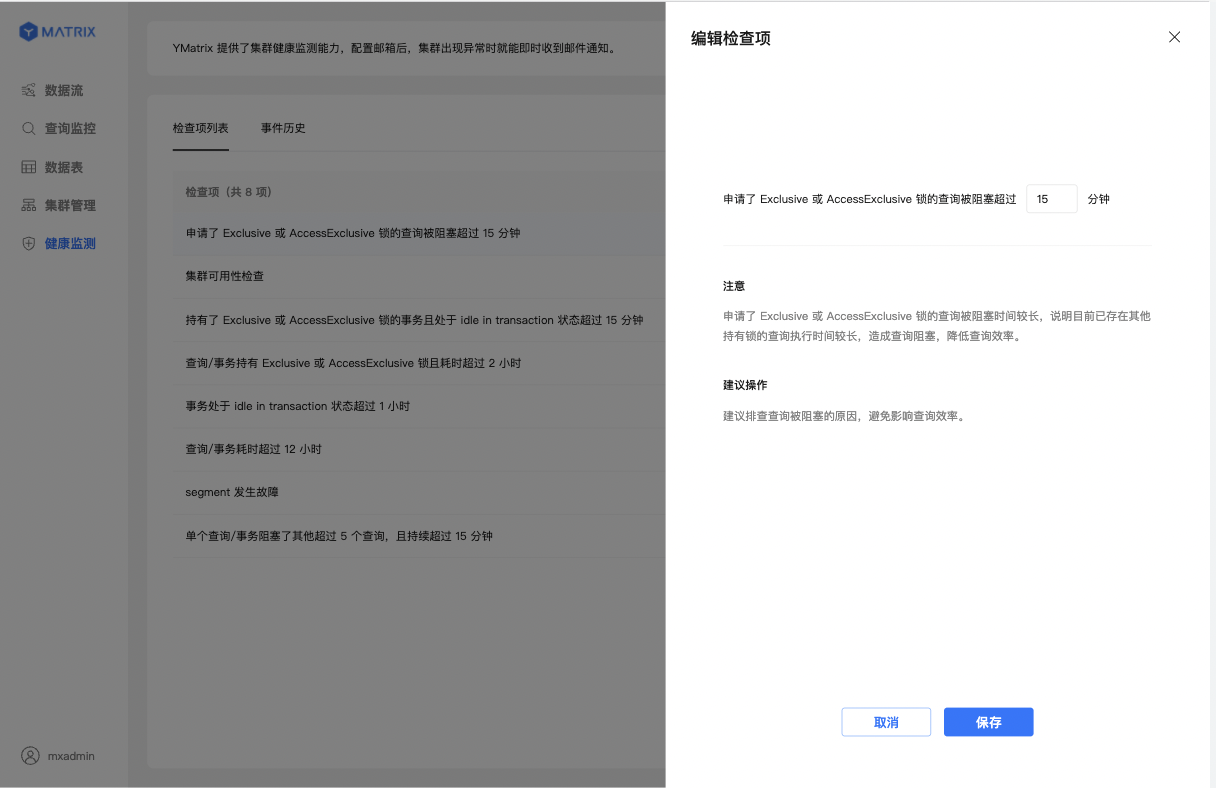
| 6 | Query requesting Exclusive or AccessExclusive lock blocked for more than 15 minutes | A query waiting longer than 15 minutes for an Exclusive or AccessExclusive table-level lock can create a backlog of blocked queries, hurting overall responsiveness. |
| 7 | Query/transaction holding Exclusive or AccessExclusive lock for more than 2 hours | A query/transaction that holds an Exclusive or AccessExclusive table-level lock for an extended period blocks every query that touches the locked table, degrading responsiveness. |
| 8 | Transaction holding Exclusive or AccessExclusive lock and idle in transaction for more than 15 minutes | A transaction that holds an Exclusive or AccessExclusive table-level lock and remains idle in transaction for 15 minutes blocks most queries on the affected tables, reducing responsiveness. |
| 9 | Disk | Quickly enable/disable monitoring checks including “disk full,” “disk space below 20%,” “disk will exhaust within 7 days,” and “abnormal growth in the past 24 hours.” Click “Edit” to tailor thresholds to business needs. |
The default setting is enabled, and it can be enabled as needed.
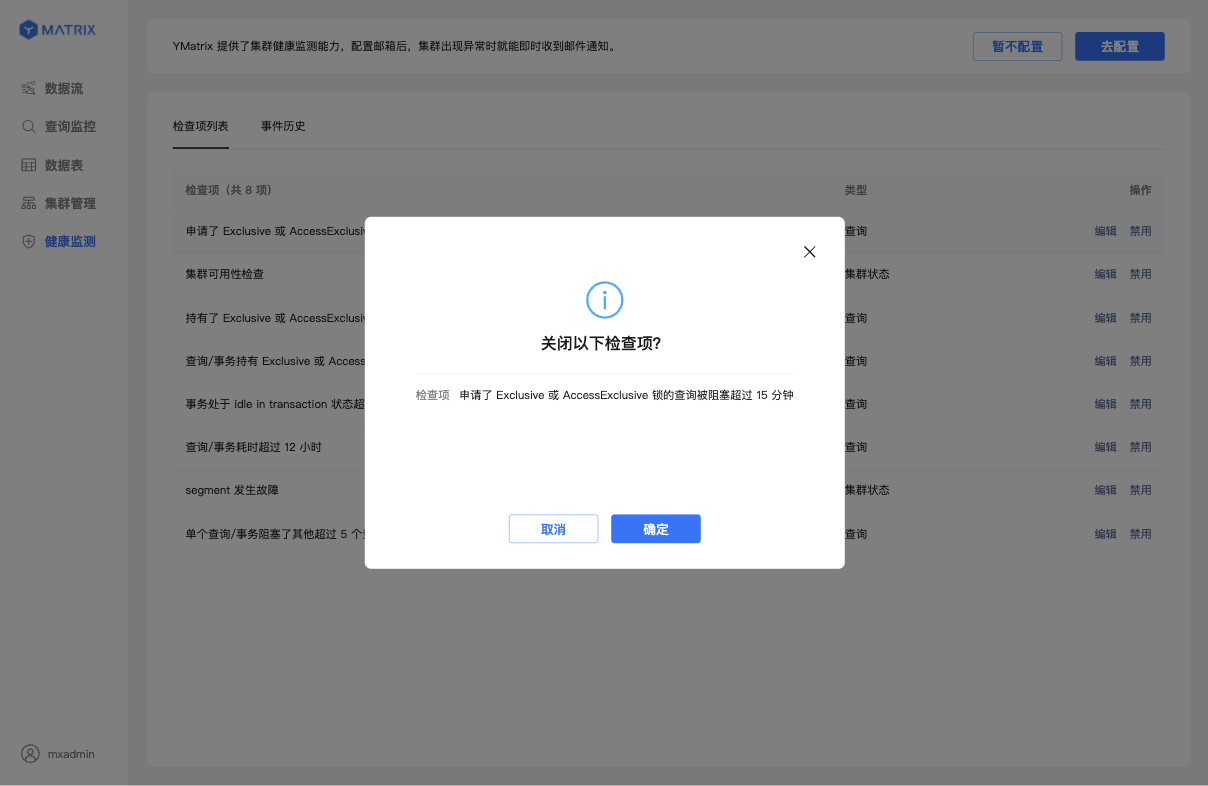
If you believe that the default parameters for the detection project do not meet your business needs, you can also edit them.
More
For Grafana alert settings, please refer to Grafana Cluster Alerts for configuration and usage.