This document describes the cluster health monitoring feature in the graphical user interface (GUI).
While supporting day-to-day operations, MatrixDB databases execute a large volume of SQL statements. Issues such as hardware failures (e.g., network outages) or lock contention due to transaction concurrency may occur. If not addressed promptly, these issues can slow down client responses or cause direct errors, negatively impacting business efficiency. To better address such problems, the GUI-based health monitoring feature helps you quickly identify abnormal behaviors in the database cluster.
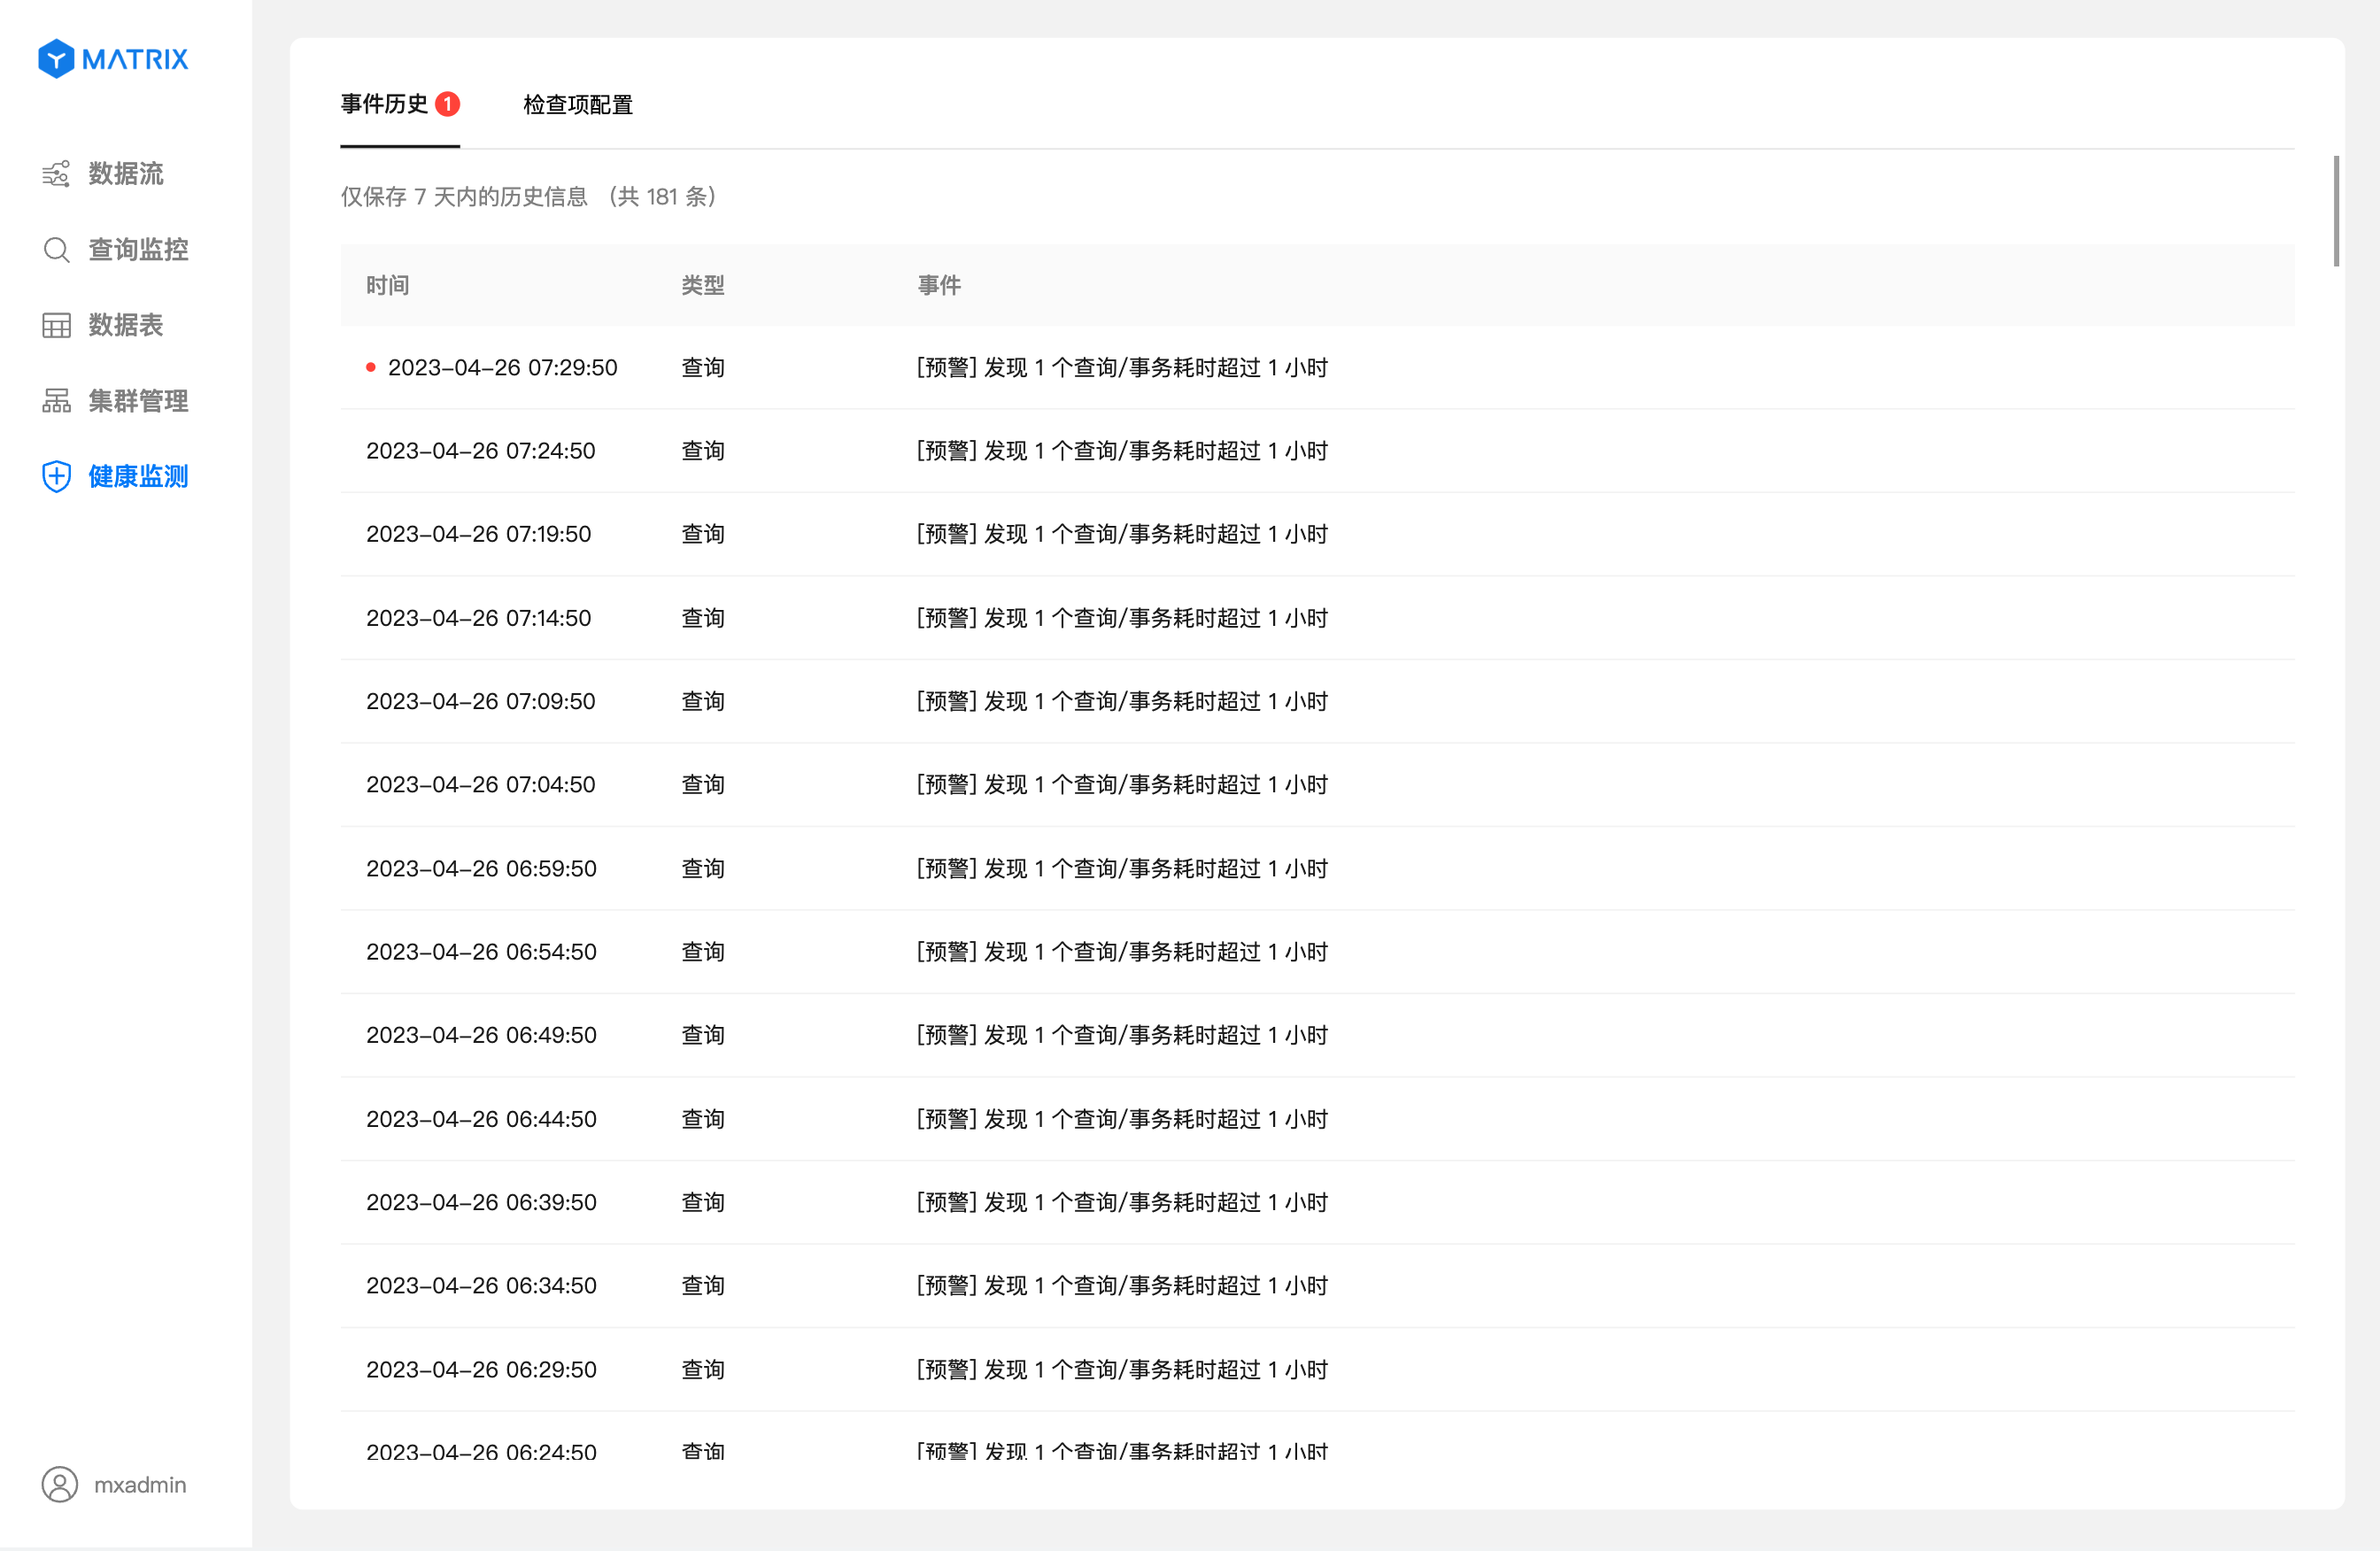
Health monitoring periodically checks relevant system catalog tables based on different inspection items. It verifies whether query execution states meet business expectations. Once a deviation from expected conditions is detected, an alert notification is immediately generated. Notifications can be viewed within the GUI. For more timely alerts, you may also choose to receive email notifications if checking the web interface is inconvenient.
Enter the IP address of the machine where MatrixGate is running (by default, the Master host IP) and the port number into your browser to log in to the graphical interface.
http://<IP>:8240 After logging in successfully, navigate to Health Monitoring → Check Item Configuration.
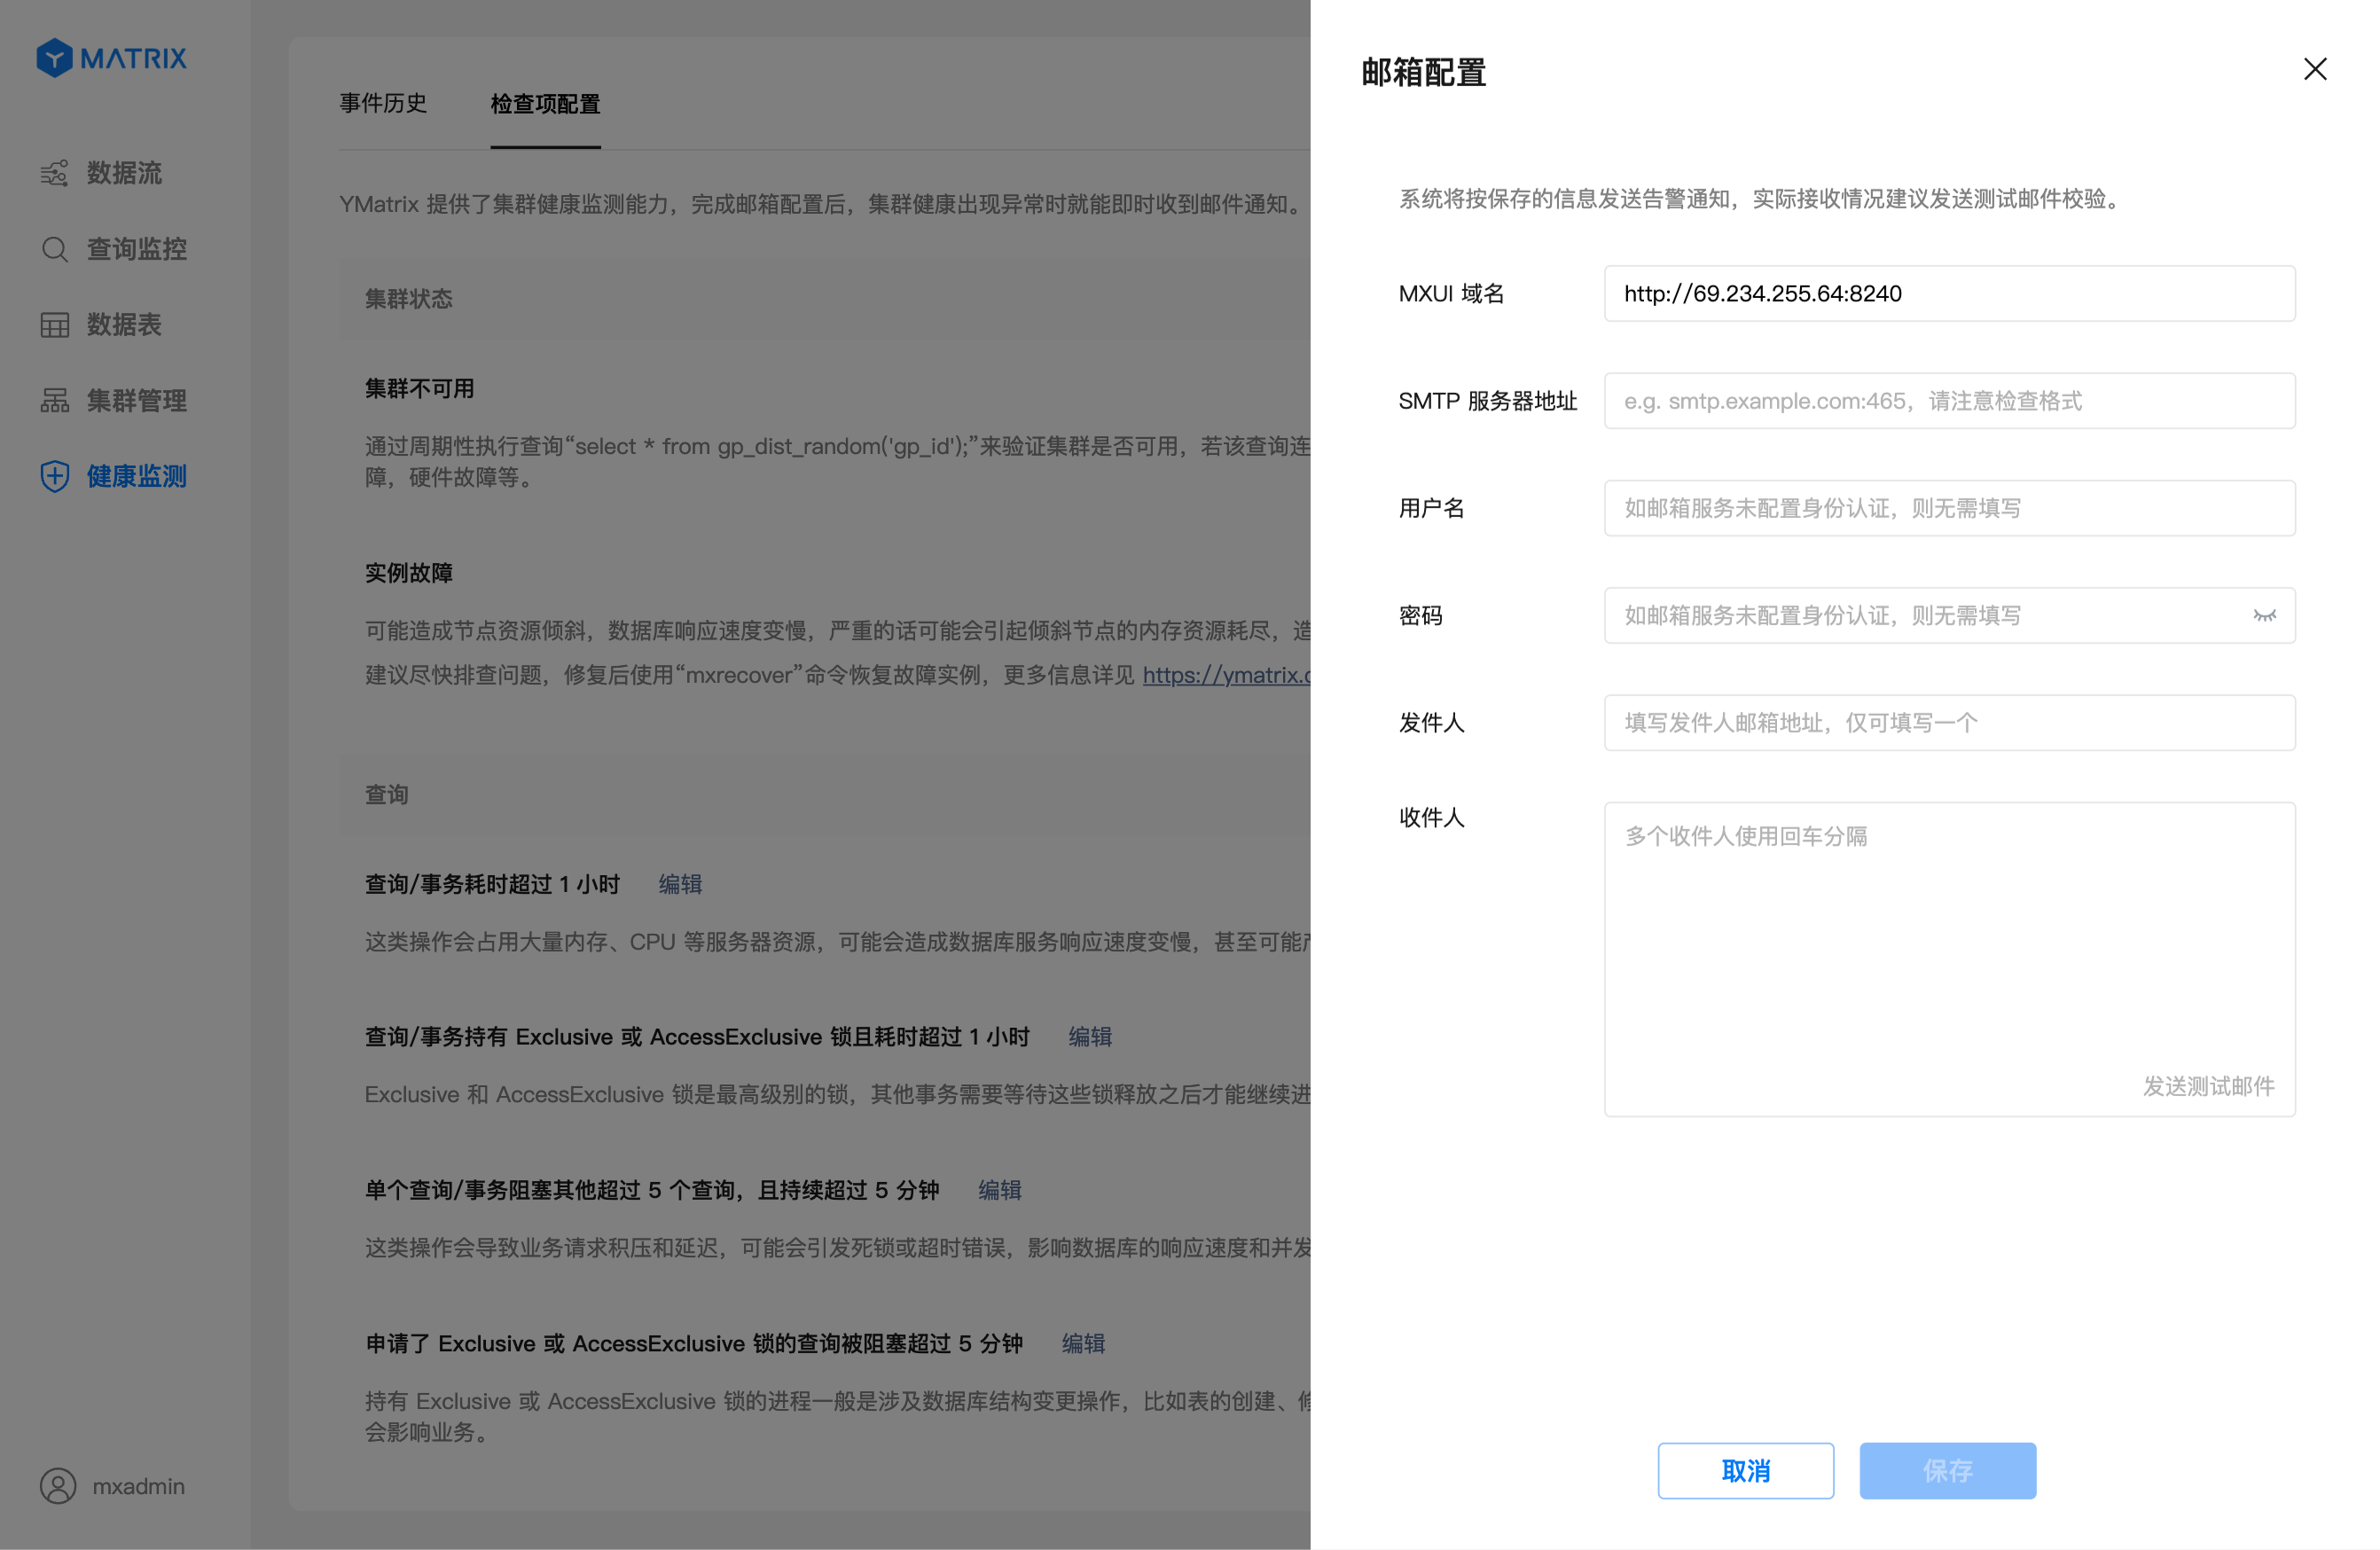
You may choose whether to configure an email service based on your needs. After configuring the email settings, you will receive alert notifications via email.
GUI Domain Name
To facilitate quick access to detailed alert information, a link to the GUI is included in the email. If recipients cannot access the GUI using the default domain name, modify this field accordingly.
SMTP Server Address
The SMTP server address consists of an IP address and port number. Example: smtp.example.com:465.
Common third-party email service addresses:
Note!
If the email service is self-hosted, consult your email administrator or service provider.
Username
Account used for authentication on the SMTP server. This field is optional and required only when the SMTP server requires username authentication. Example: [email protected].
Password
Password for the SMTP user account. This field is optional and required only when the SMTP server requires both username and password for authentication.
Note!
If the email service is self-hosted, consult your email administrator or service provider.
Sender
For third-party email services, this field should match the "Username".
For self-hosted email services, enter the sender's email address.
Recipients
Enter one or more recipient email addresses.
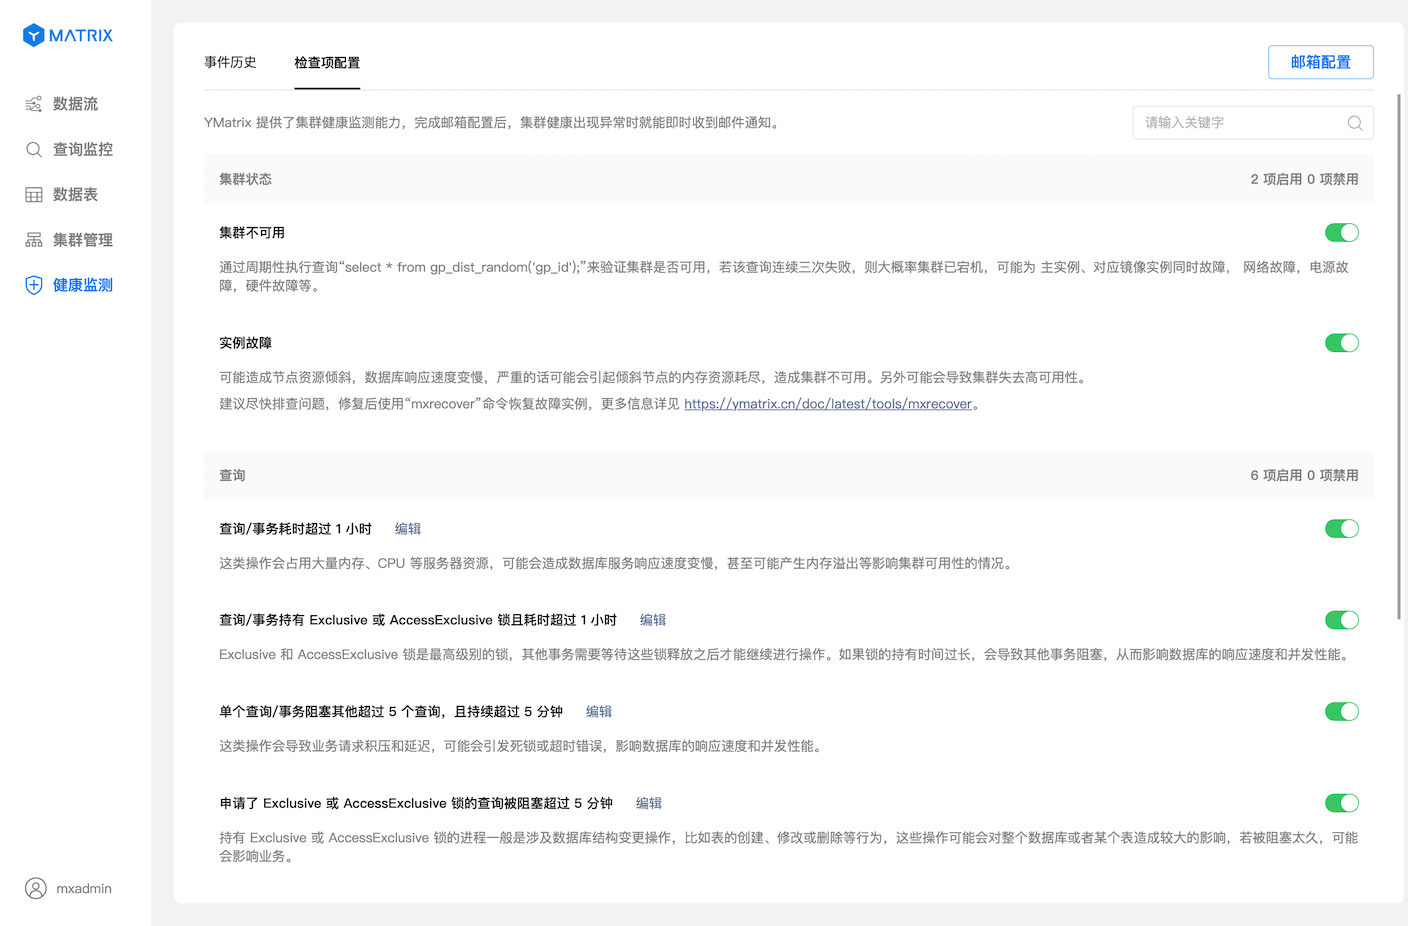
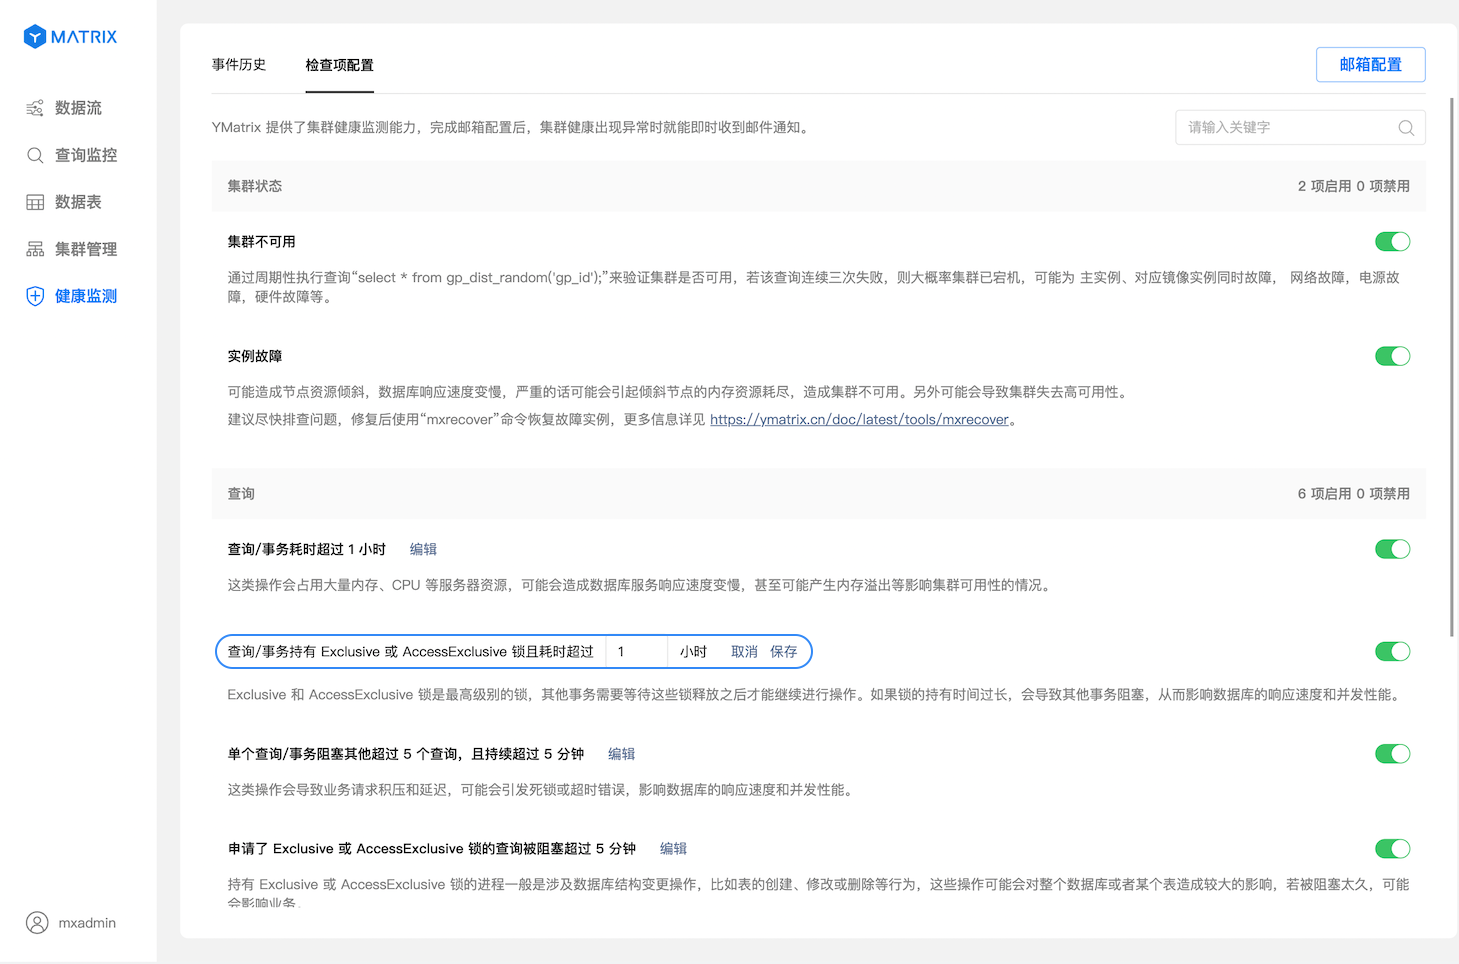
The list shows all monitoring items currently provided by YMatrix. All items are enabled by default. You can enable or disable them as needed.
If the default parameters of a monitoring item do not suit your business scenario, you can modify them manually.
| No. | Check Item | Description |
| 1 | Cluster Unavailable | Periodically runs the query `SELECT * FROM gp_dist_random('gp_id');` to verify cluster availability. If this query fails three times consecutively, the cluster is likely down. Possible causes include failure of both primary and mirror Segments, network issues, power failure, or hardware faults. |
| 2 | Segment Failure | May cause node resource skew, slow database response, and in severe cases, memory exhaustion on the affected node, leading to cluster unavailability. High availability may also be compromised. It is recommended to diagnose and fix the issue promptly, then use the `mxrecover` command to restore the failed instance. For more information, see Disaster Recovery. |
| 3 | Query/Transaction Running Over 12 Hours | Long-running queries or transactions may consume excessive memory and CPU resources, slowing down database responses, triggering OOM (out-of-memory), or even affecting cluster availability. |
| 4 | Transaction in "idle in transaction" State Over 1 Hour | Such transactions hold resources and block others. They also contribute to database age growth, which impacts performance. |
| 5 | A Single Query/Transaction Blocks More Than 5 Others for Over 15 Minutes | This may cause request backlog and latency, potentially leading to deadlocks or timeouts, affecting response time and concurrency performance. |
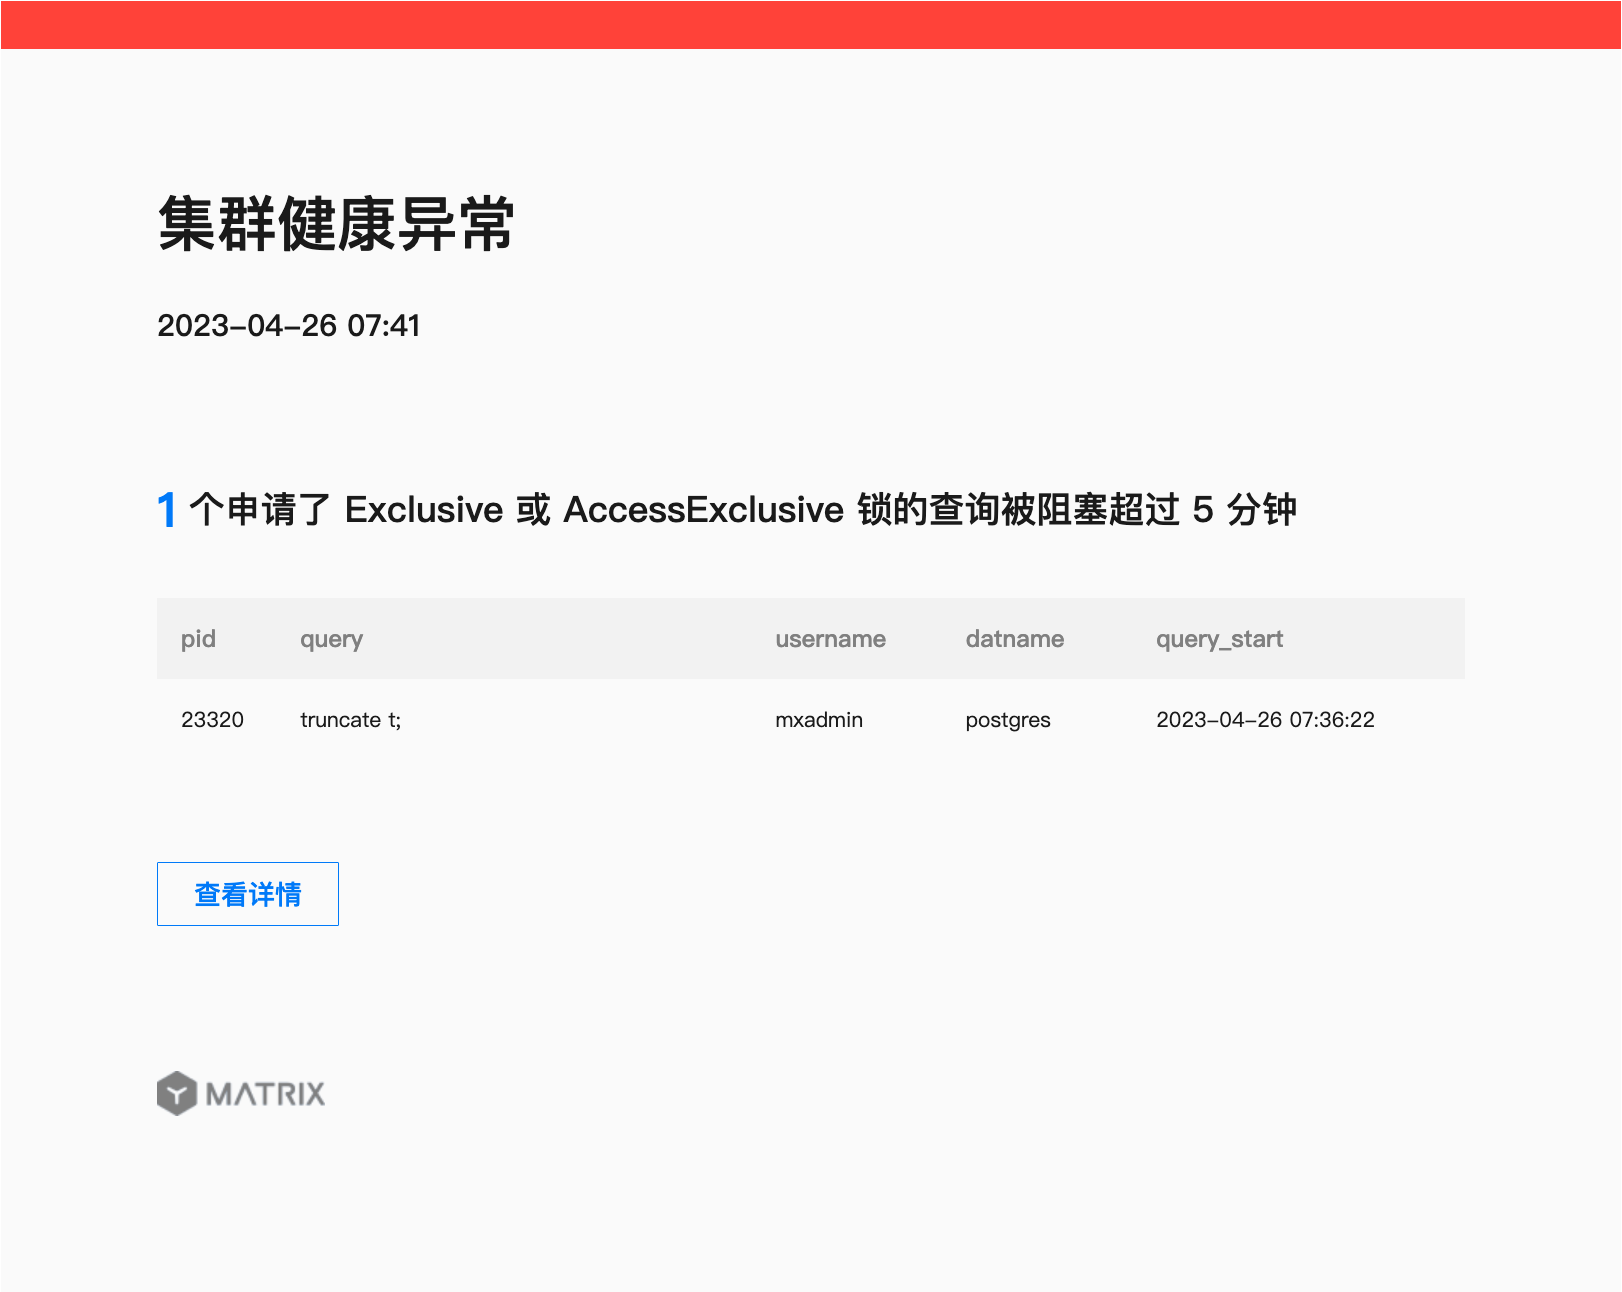
| 6 | Query Holding Exclusive or AccessExclusive Lock Blocked for Over 15 Minutes | Processes holding Exclusive or AccessExclusive locks typically involve schema changes (e.g., creating, altering, or dropping tables), which can significantly impact the entire database or specific tables. Prolonged blocking may affect business operations. |
| 7 | Query/Transaction Holding Exclusive or AccessExclusive Lock Running Over 2 Hours | Exclusive and AccessExclusive are the highest-level locks. Other transactions must wait until they are released. Long-held locks cause blocking, degrading response time and concurrency performance. |
| 8 | Transaction Holding Exclusive or AccessExclusive Lock in "idle in transaction" State Over 15 Minutes | These high-level locks block other transactions. Being idle while holding such locks leads to blocking or deadlocks and accelerates database age growth, negatively affecting performance. |
If you have configured email settings, you will receive an email alert when an event meets the failure condition of any monitoring item.
Regardless of whether email notifications are configured, you can view historical records of events that met the failure conditions in the Event History section.