This document describes how to configure custom monitoring in YMatrix. This feature is supported starting from version v4.8.2.
First, you should understand how to deploy Grafana monitoring or Prometheus monitoring.
Taking local Grafana monitoring as an example (matrixdb@mxagent),
one to two minutes after the monitoring deployment completes, you can query the monitoring data in the local.system table under the matrixmgr database.

This data is collected by telegraf and inserted into the table via mxgate. The telegraf and mxgate processes are deployed as background services by the matrixdb function, as shown in the output of the supervisorctl status command:
$ supervisorctl status
Status:
1. pc_id:{group:"mxui_collector" name:"mxui_collector"} describe:"pid 8223, uptime 2:27:36" now:1682517012 state:"Running" log_file:"/var/log/matrixdb/mxui_collector_5432.log" stdout_log_file:"/var/log/matrixdb/mxui_collector_5432.log" pid:8223
2. pc_id:{group:"mxmgr_gate_ctrl" name:"mxmgr_gate_ctrl"} describe:"pid 10295, uptime 2:25:28" now:1682517012 state:"Running" log_file:"/var/log/matrixdb/mxmgr_gate_ctrl_5432.log" stdout_log_file:"/var/log/matrixdb/mxmgr_gate_ctrl_5432.log" pid:10295
3. pc_id:{group:"mxmgr_telegraf_ctrl" name:"mxmgr_telegraf_ctrl"} describe:"pid 10350, uptime 2:25:26" now:1682517012 state:"Running" log_file:"/var/log/matrixdb/mxmgr_telegraf_ctrl_5432.log" stdout_log_file:"/var/log/matrixdb/mxmgr_telegraf_ctrl_5432.log" pid:10350
4. pc_id:{group:"cylinder" name:"cylinder"} describe:"pid 6038, uptime 2:33:30" now:1682517012 state:"Running" log_file:"/var/log/matrixdb/cylinder.log" stdout_log_file:"/var/log/matrixdb/cylinder.log" pid:6038
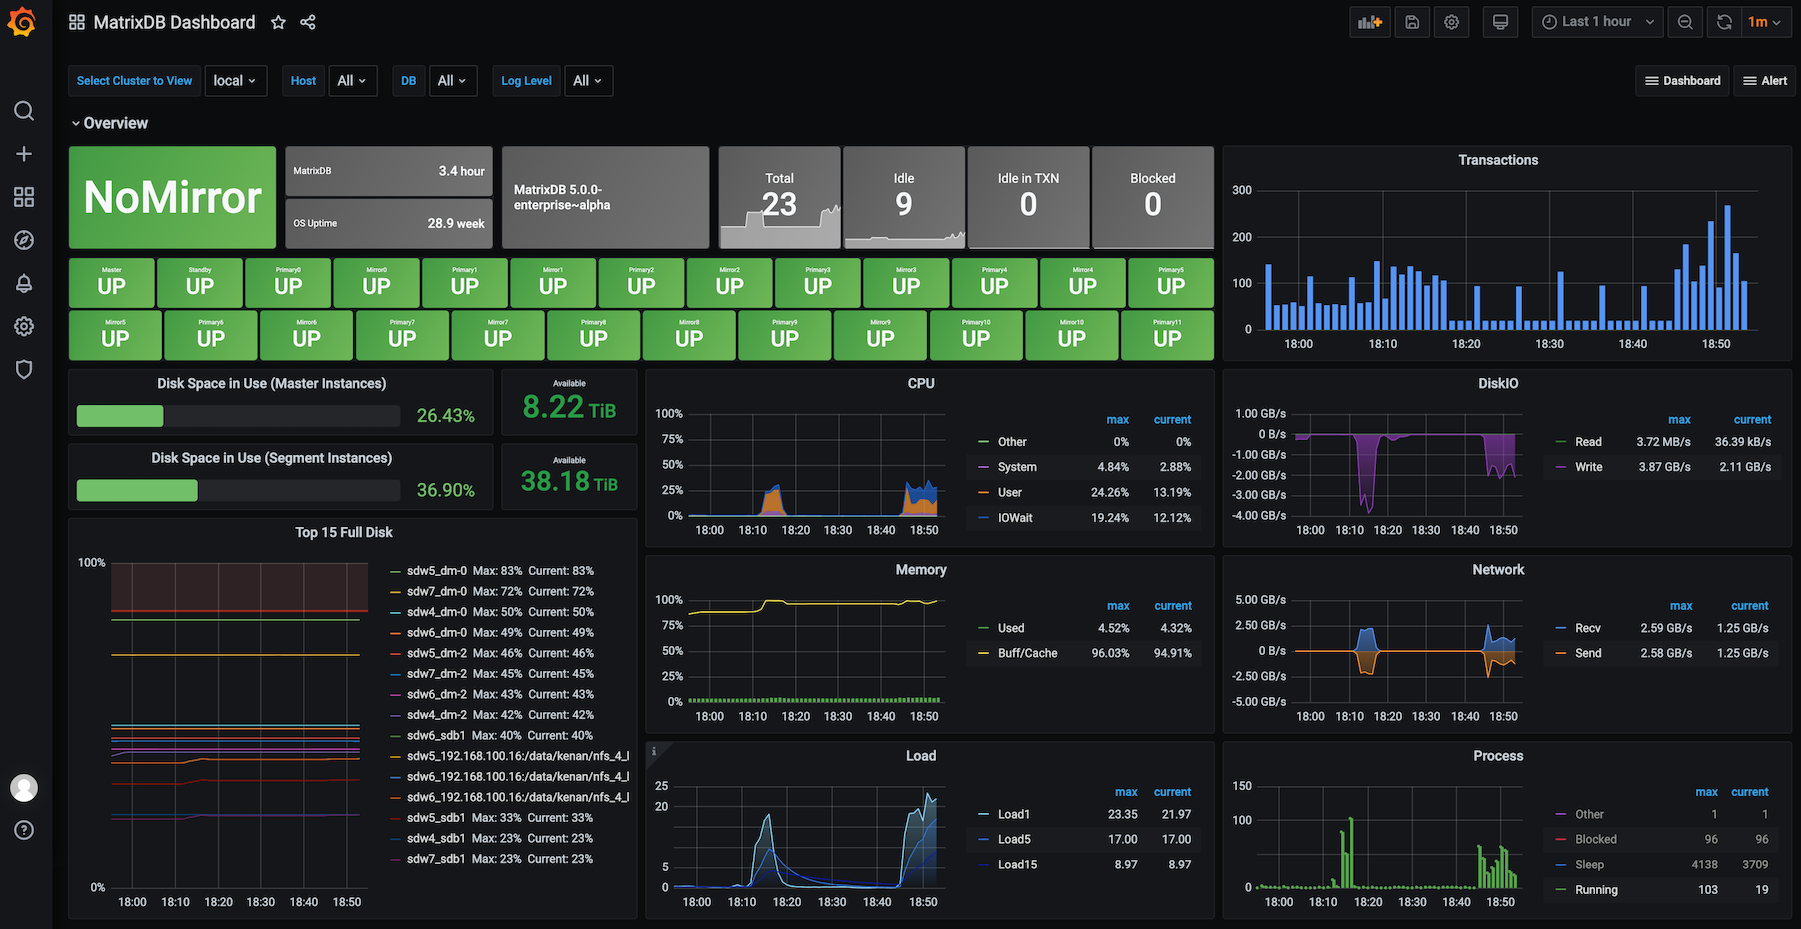
5. pc_id:{group:"mxui" name:"mxui"} describe:"pid 6041, uptime 2:33:30" now:1682517012 state:"Running" log_file:"/var/log/matrixdb/mxui.log" stdout_log_file:"/var/log/matrixdb/mxui.log" pid:6041The data stored in the local.system table is primarily used to display cluster monitoring charts on Grafana Dashboards.
The system information collected in the local.system table includes the following 24 categories of runtime metrics. If you have operational experience, you may explore their contents:
matrixmgr=# select distinct category from local.system order by 1;
   category
---------------
 cpu
 disk
 diskio
 kernel
 mem
 net
 netstat
 postgresql
 processes
 sar_cpu
 sar_cpu_util
 sar_disk
 sar_hugepages
 sar_inode
 sar_io
 sar_mem
 sar_network
 sar_paging
 sar_queue
 sar_swap
 sar_swap_util
 sar_task
 swap
 system
(24 rows)Starting from v4.8.2, YMatrix supports user-defined custom monitoring. You can define your own monitoring scripts, which can either be inserted into the local.system table or reported to Prometheus. After successful setup, you can create custom Dashboard panels and alerts in Grafana.
After deploying the monitoring components, you can find the custom monitoring scripts in the following directory: /etc/matrixdb/scripts.
This directory contains:
monitor_bootstrap.sh
This is the entry point for custom monitoring. The content is pre-written and should not be modified by users. The telegraf process calls this script periodically to collect custom monitoring data.
monitor_plugins/
This directory is for user-defined scripts. For security reasons, only the root user has write permissions to this directory.
Below are two example custom monitoring scripts placed in the monitor_plugins/ directory:
nic.sh to display NIC (network interface) statistics:#!/bin/bash
style=grafana
#######################################################################
# NIC statistics
#######################################################################
nic_stats_output() {
METRIC="net_dev";
for NIC in $(ls /sys/class/net/ | grep -E 'eth|enp|ens|bond')
do
VAL=""
for f in $(ls /sys/class/net/$NIC/statistics/); do
v=$(cat /sys/class/net/$NIC/statistics/$f);
if [ "#$style" == "#prometheus" ];then
echo "matrixdb,device=$NIC,metric=$f $METRIC=$v"
continue
fi
if [ ! -z $VAL ];then
VAL+=","
fi
VAL+="$f=$v";
done
if [ "#$style" == "#grafana" ];then
echo "$METRIC,device=$NIC $VAL"
fi
done
}
nic_stats_outputThis script outputs statistics from /sys/class/net/<NIC>/statistics/ on the local host. A standalone run produces output like:
net_dev,device=eth0 collisions=0,multicast=0,rx_bytes=54701811772,rx_compressed=0,rx_crc_errors=0,rx_dropped=0,rx_errors=0,rx_fifo_errors=0,rx_frame_errors=0,rx_length_errors=0,rx_missed_errors=0,rx_nohandler=0,rx_over_errors=0,rx_packets=328974378,tx_aborted_errors=0,tx_bytes=89613462060,tx_carrier_errors=0,tx_compressed=0,tx_dropped=0,tx_errors=0,tx_fifo_errors=0,tx_heartbeat_errors=0,tx_packets=283871697,tx_window_errors=0Output format rules for the script: each line of data must follow this structure:
net_dev.key=value tags may appear before the first space. These are labels for the metric, such as device=eth0.key=value pairs represent the actual metric values.interrupts.sh to display hardware interrupt statistics:#!/bin/bash
style=grafana
#######################################################################
# Hardware Interrupts
#######################################################################
interrupts_output() {
PATTERN=$(awk -F ':' '{i++; if(i>2){print $1}}' /proc/net/dev | sed 's/ //g' | tr '\n' '|' | sed 's/|$//')
egrep "$PATTERN" /proc/interrupts | awk -v style="#$style" \
'{ for (i=2;i<=NF-2;i++) sum[i]+=$i;}
END {
for (i=2;i<=NF-2; i++)
{
if(style=="#prometheus"){
print("matrixdb,device=cpu" i-2 " net_interrupts_by_cpu="sum[i]);
continue;
}
val=sprintf(val "cpu" i-2 "=" sum[i]);
if(i!=NF-2 )
val=sprintf(val ",");
}
if(style=="#grafana")
print("net_interrupts_by_cpu,device=all " val)
}'
egrep "$PATTERN" /proc/interrupts | awk -v style="#$style" \
'{ for (i=2;i<=NF-2; i++)
sum+=$i;
tags=sprintf("%s", $NF);
if (NR!=1)
val=sprintf(val ",");
val=sprintf(val tags "=" sum);
if(style=="#prometheus"){
print("matrixdb,device=" $NF " net_interrupts_by_queue=" sum)
}
sum=0;
} END{ if(style=="#grafana") print("net_interrupts_by_queue,device=all " val) }'
}
interrupts_outputA single execution produces:
net_interrupts_by_cpu,device=all cpu0=284551104,cpu1=308556439
net_interrupts_by_queue,device=all eth0-Tx-Rx-0=298072844,eth0-Tx-Rx-1=295034700
Note: Scripts placed in the monitor_plugins/ directory must have execute permissions:
$ ls -l /etc/matrixdb/scripts/monitor_plugins/
-rwxr-xr-x 1 root root 1491 Apr 26 12:51 interrupts.sh
-rwxr-xr-x 1 root root  855 Apr 26 12:45 nic.sh
If execute permissions are removed, the script will be effectively disabled and will not be executed during periodic collection.
After placing the custom monitoring scripts and verifying the output format, you can test them using telegraf --test.
First, locate the telegraf configuration file in /tmp:
$ ls -l /tmp | grep telegraf
-rw-r--r-- 1 root     root      12676 Apr 26 11:24 telegraf_5432.conf
Run telegraf in test mode:
$ sudo /usr/local/matrixdb/bin/telegraf --config /tmp/telegraf_5432.conf --testThe output will include the results from your custom scripts, confirming they are properly loaded:

Once the scripts are in place, they will be automatically executed during each system monitoring collection cycle. Wait 1–2 minutes, then query the local.system table to verify the custom monitoring data has been inserted.
local.system to confirm new categories net_dev, net_interrupts_by_cpu, and net_interrupts_by_queue have appeared:matrixmgr=# SELECT distinct category FROM local.system ORDER BY 1;
category
-------------------------
cpu
disk
diskio
kernel
mem
net
net_dev
net_interrupts_by_cpu
net_interrupts_by_queue
netstat
postgresql
processes
sar_cpu
sar_cpu_util
sar_disk
sar_hugepages
sar_inode
sar_io
sar_mem
sar_network
sar_paging
sar_queue
sar_swap
sar_swap_util
sar_task
swap
system
(27 rows)Query the actual collected data:
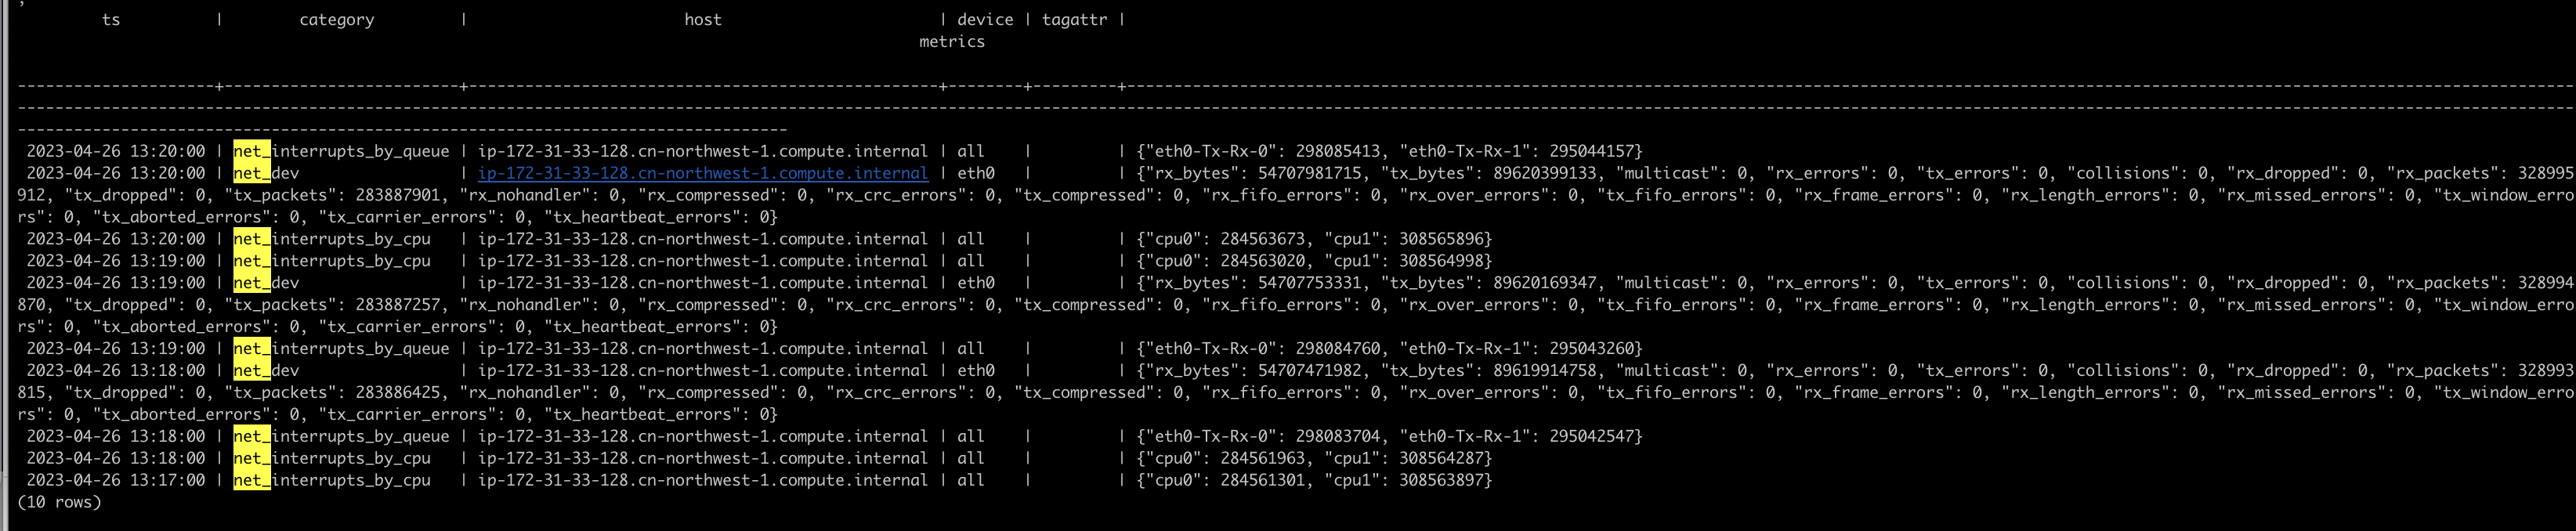
matrixmgr=# SELECT * FROM local.system
WHERE category IN ('net_interrupts_by_cpu', 'net_interrupts_by_queue', 'net_dev')
ORDER BY ts DESC LIMIT 10;
The output shows that the custom script data has been stored as structured records, ready for analysis:
For Prometheus users, visit http://<prometheus-server>:9090 to verify that the custom metrics are present.
After the data is ingested into the database or Prometheus, you can create custom panels in Grafana Dashboards and design visualizations as needed.
This is not the focus of this document, so only basic steps are provided.
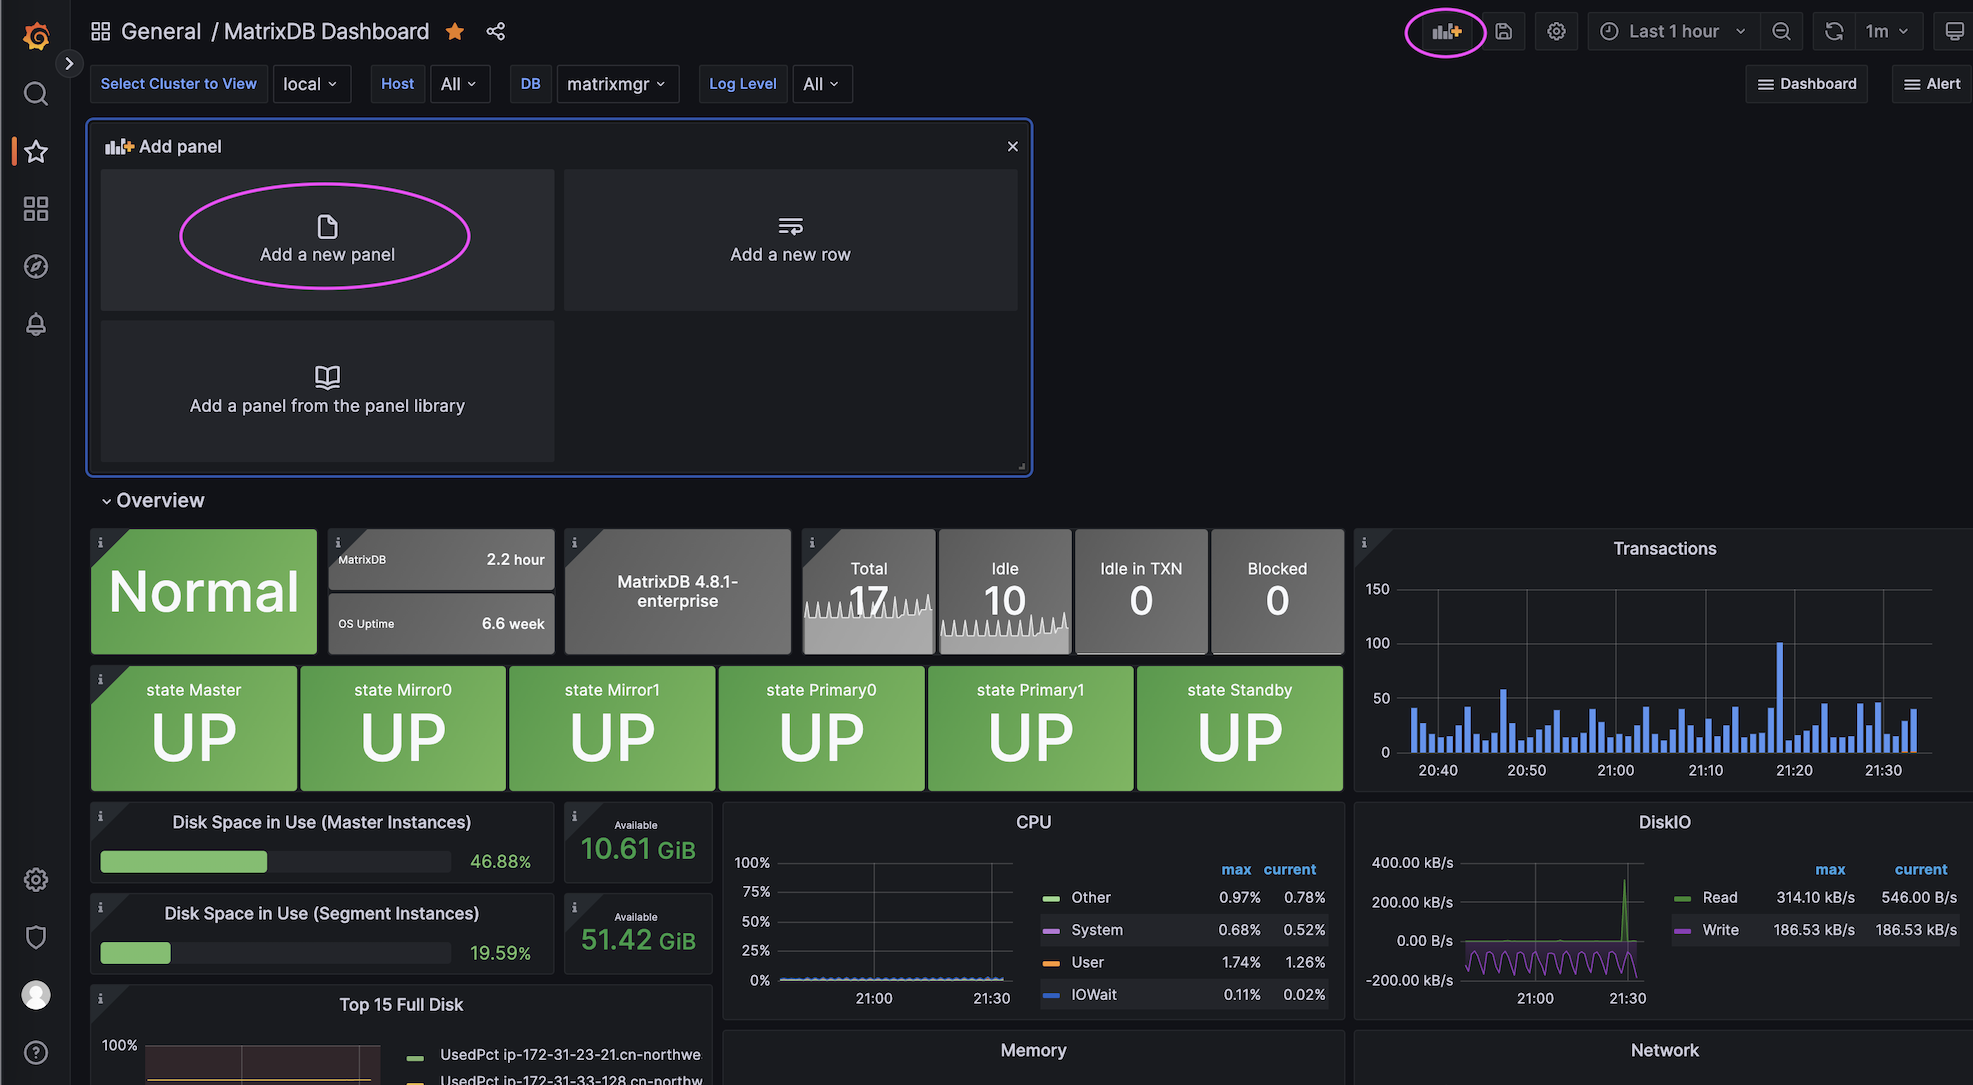
As an example for non-Prometheus users, write a SQL query to retrieve monitoring data:

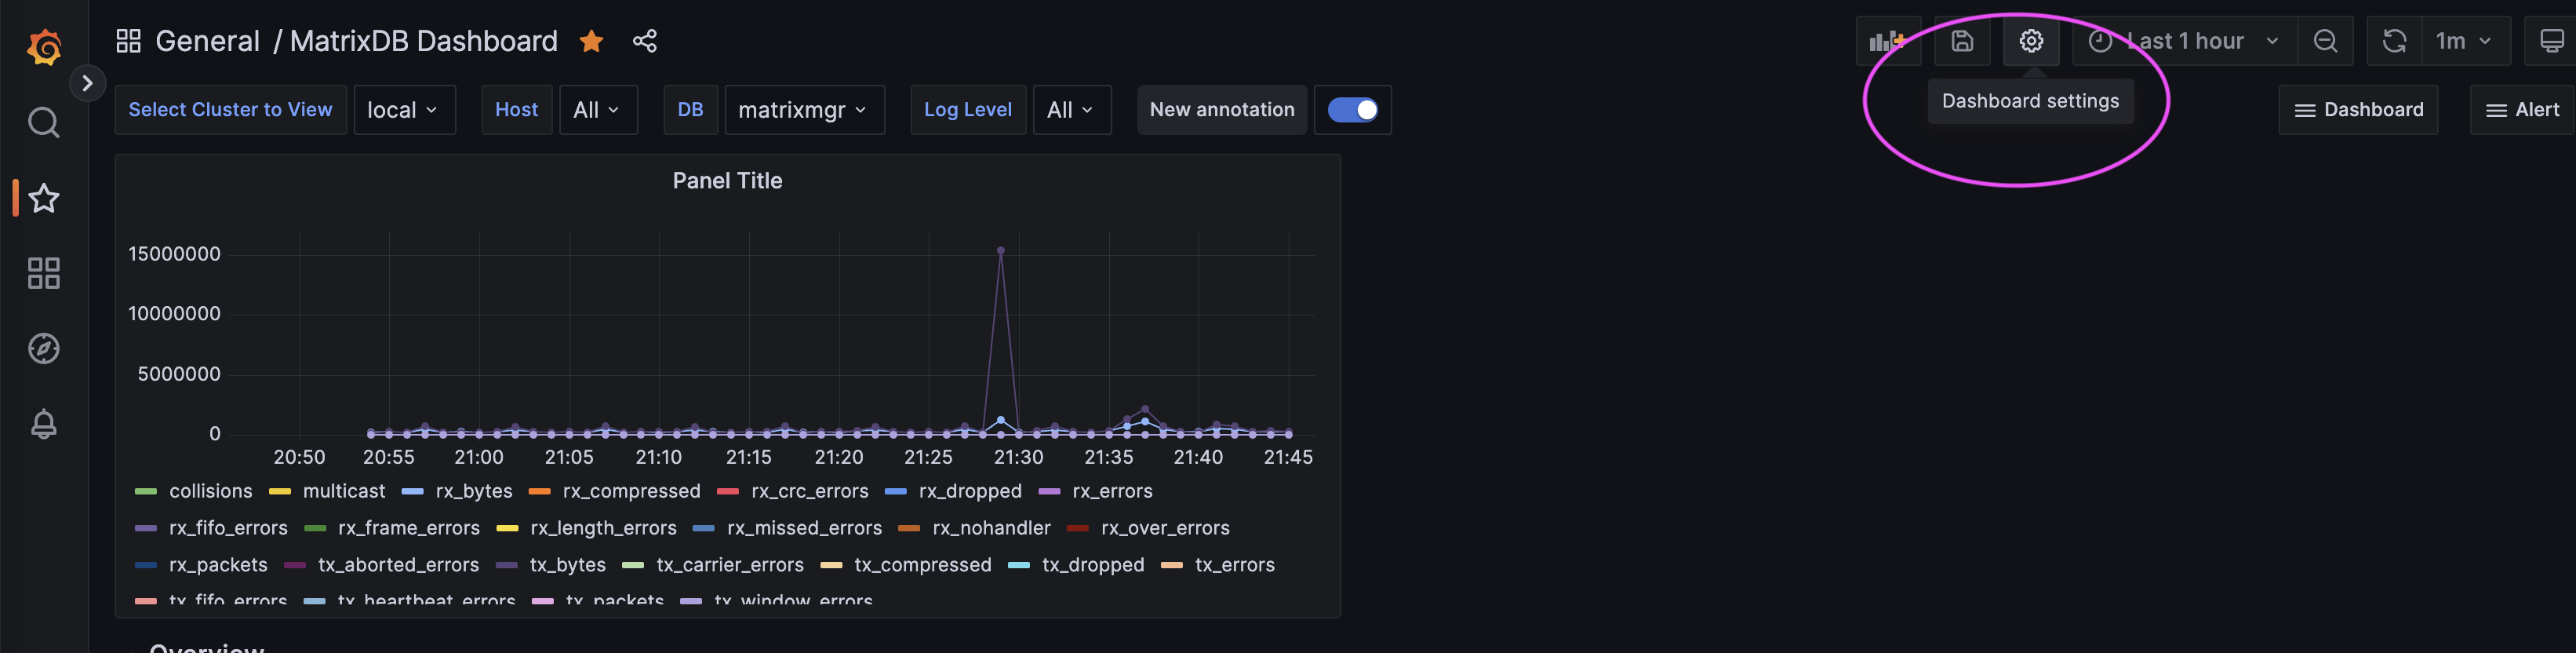
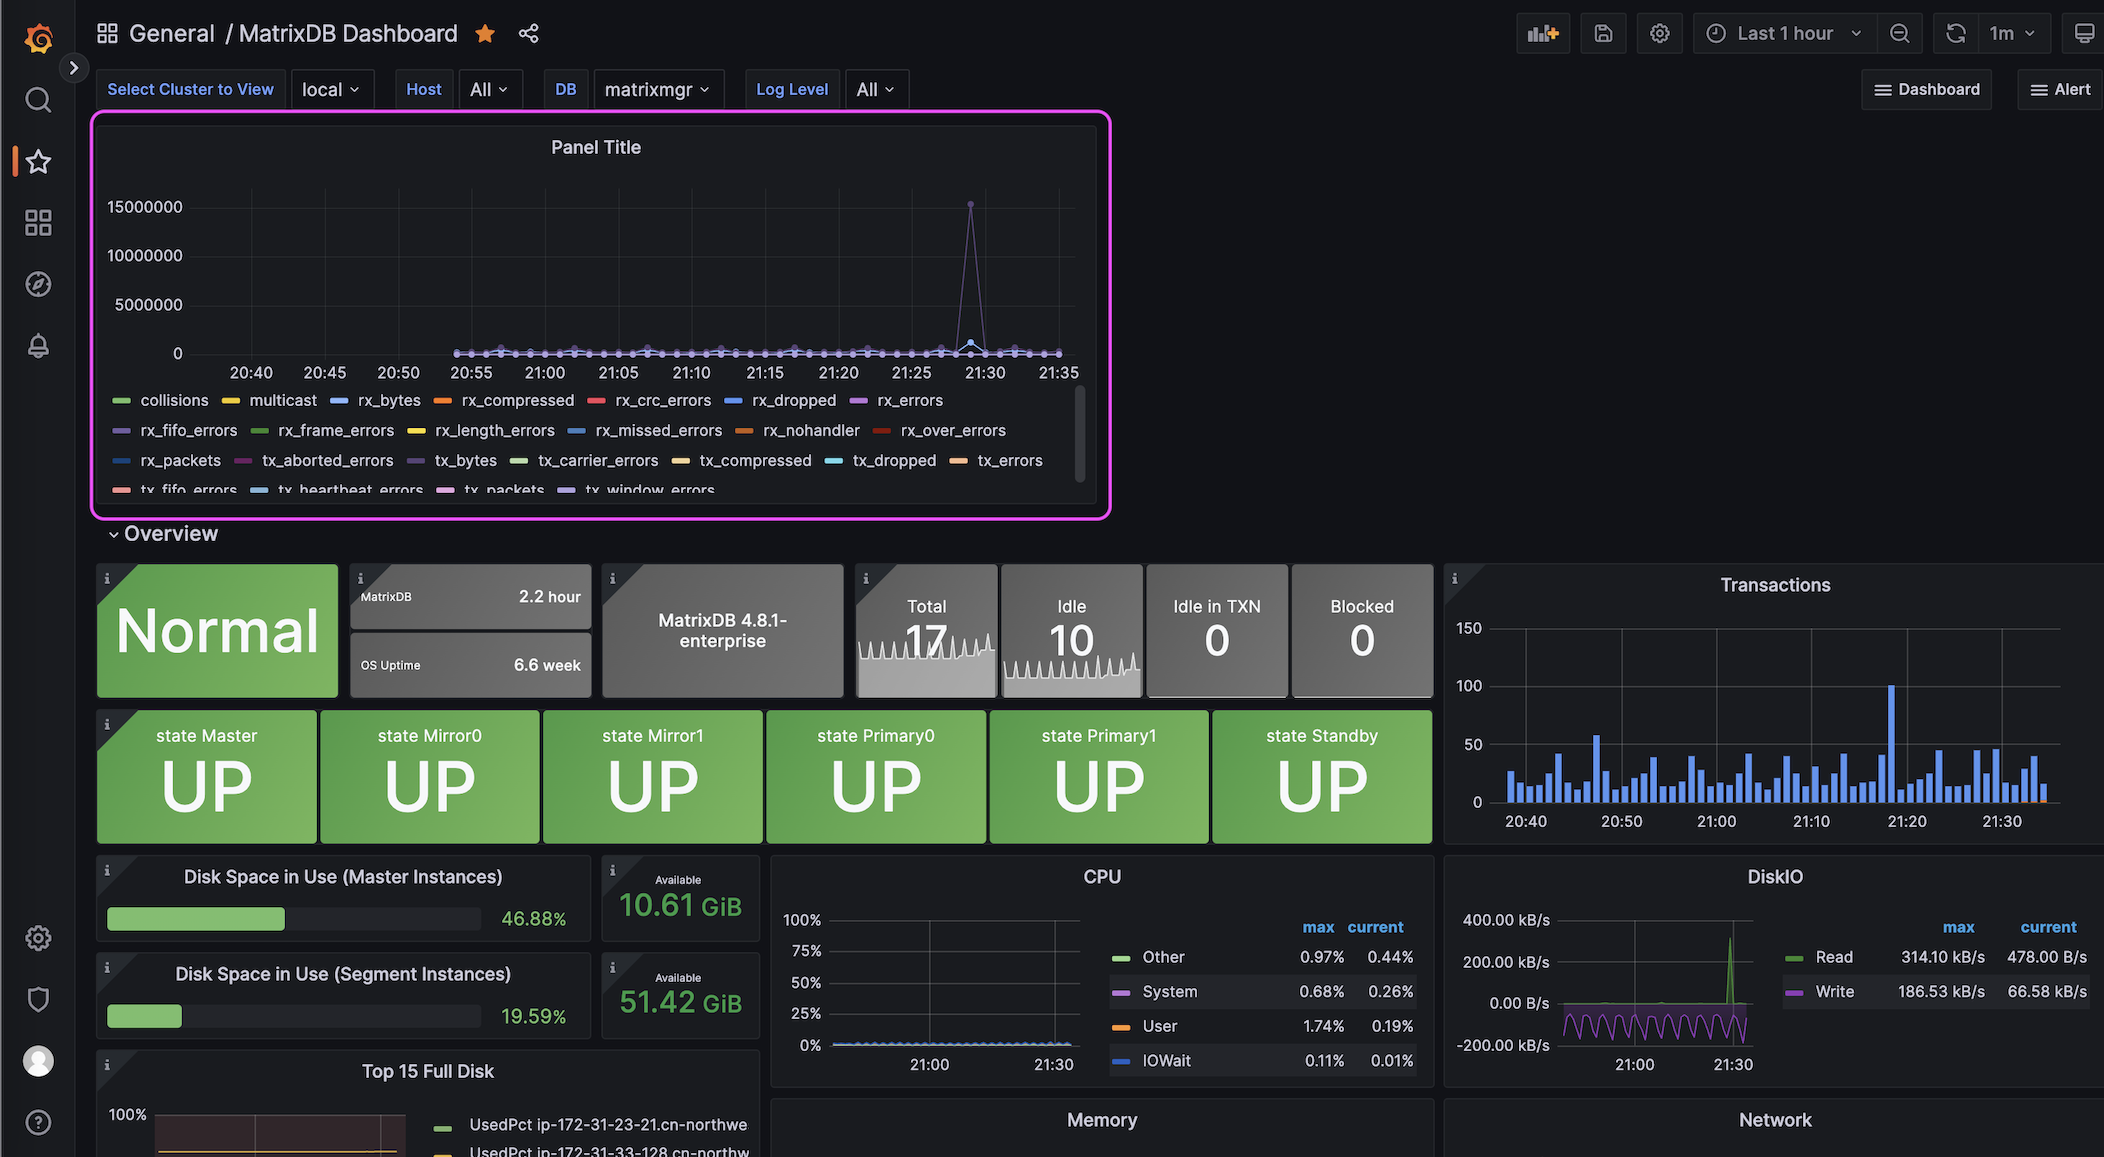
After adding the panel, your custom monitoring data will be visualized, for example as a line chart:
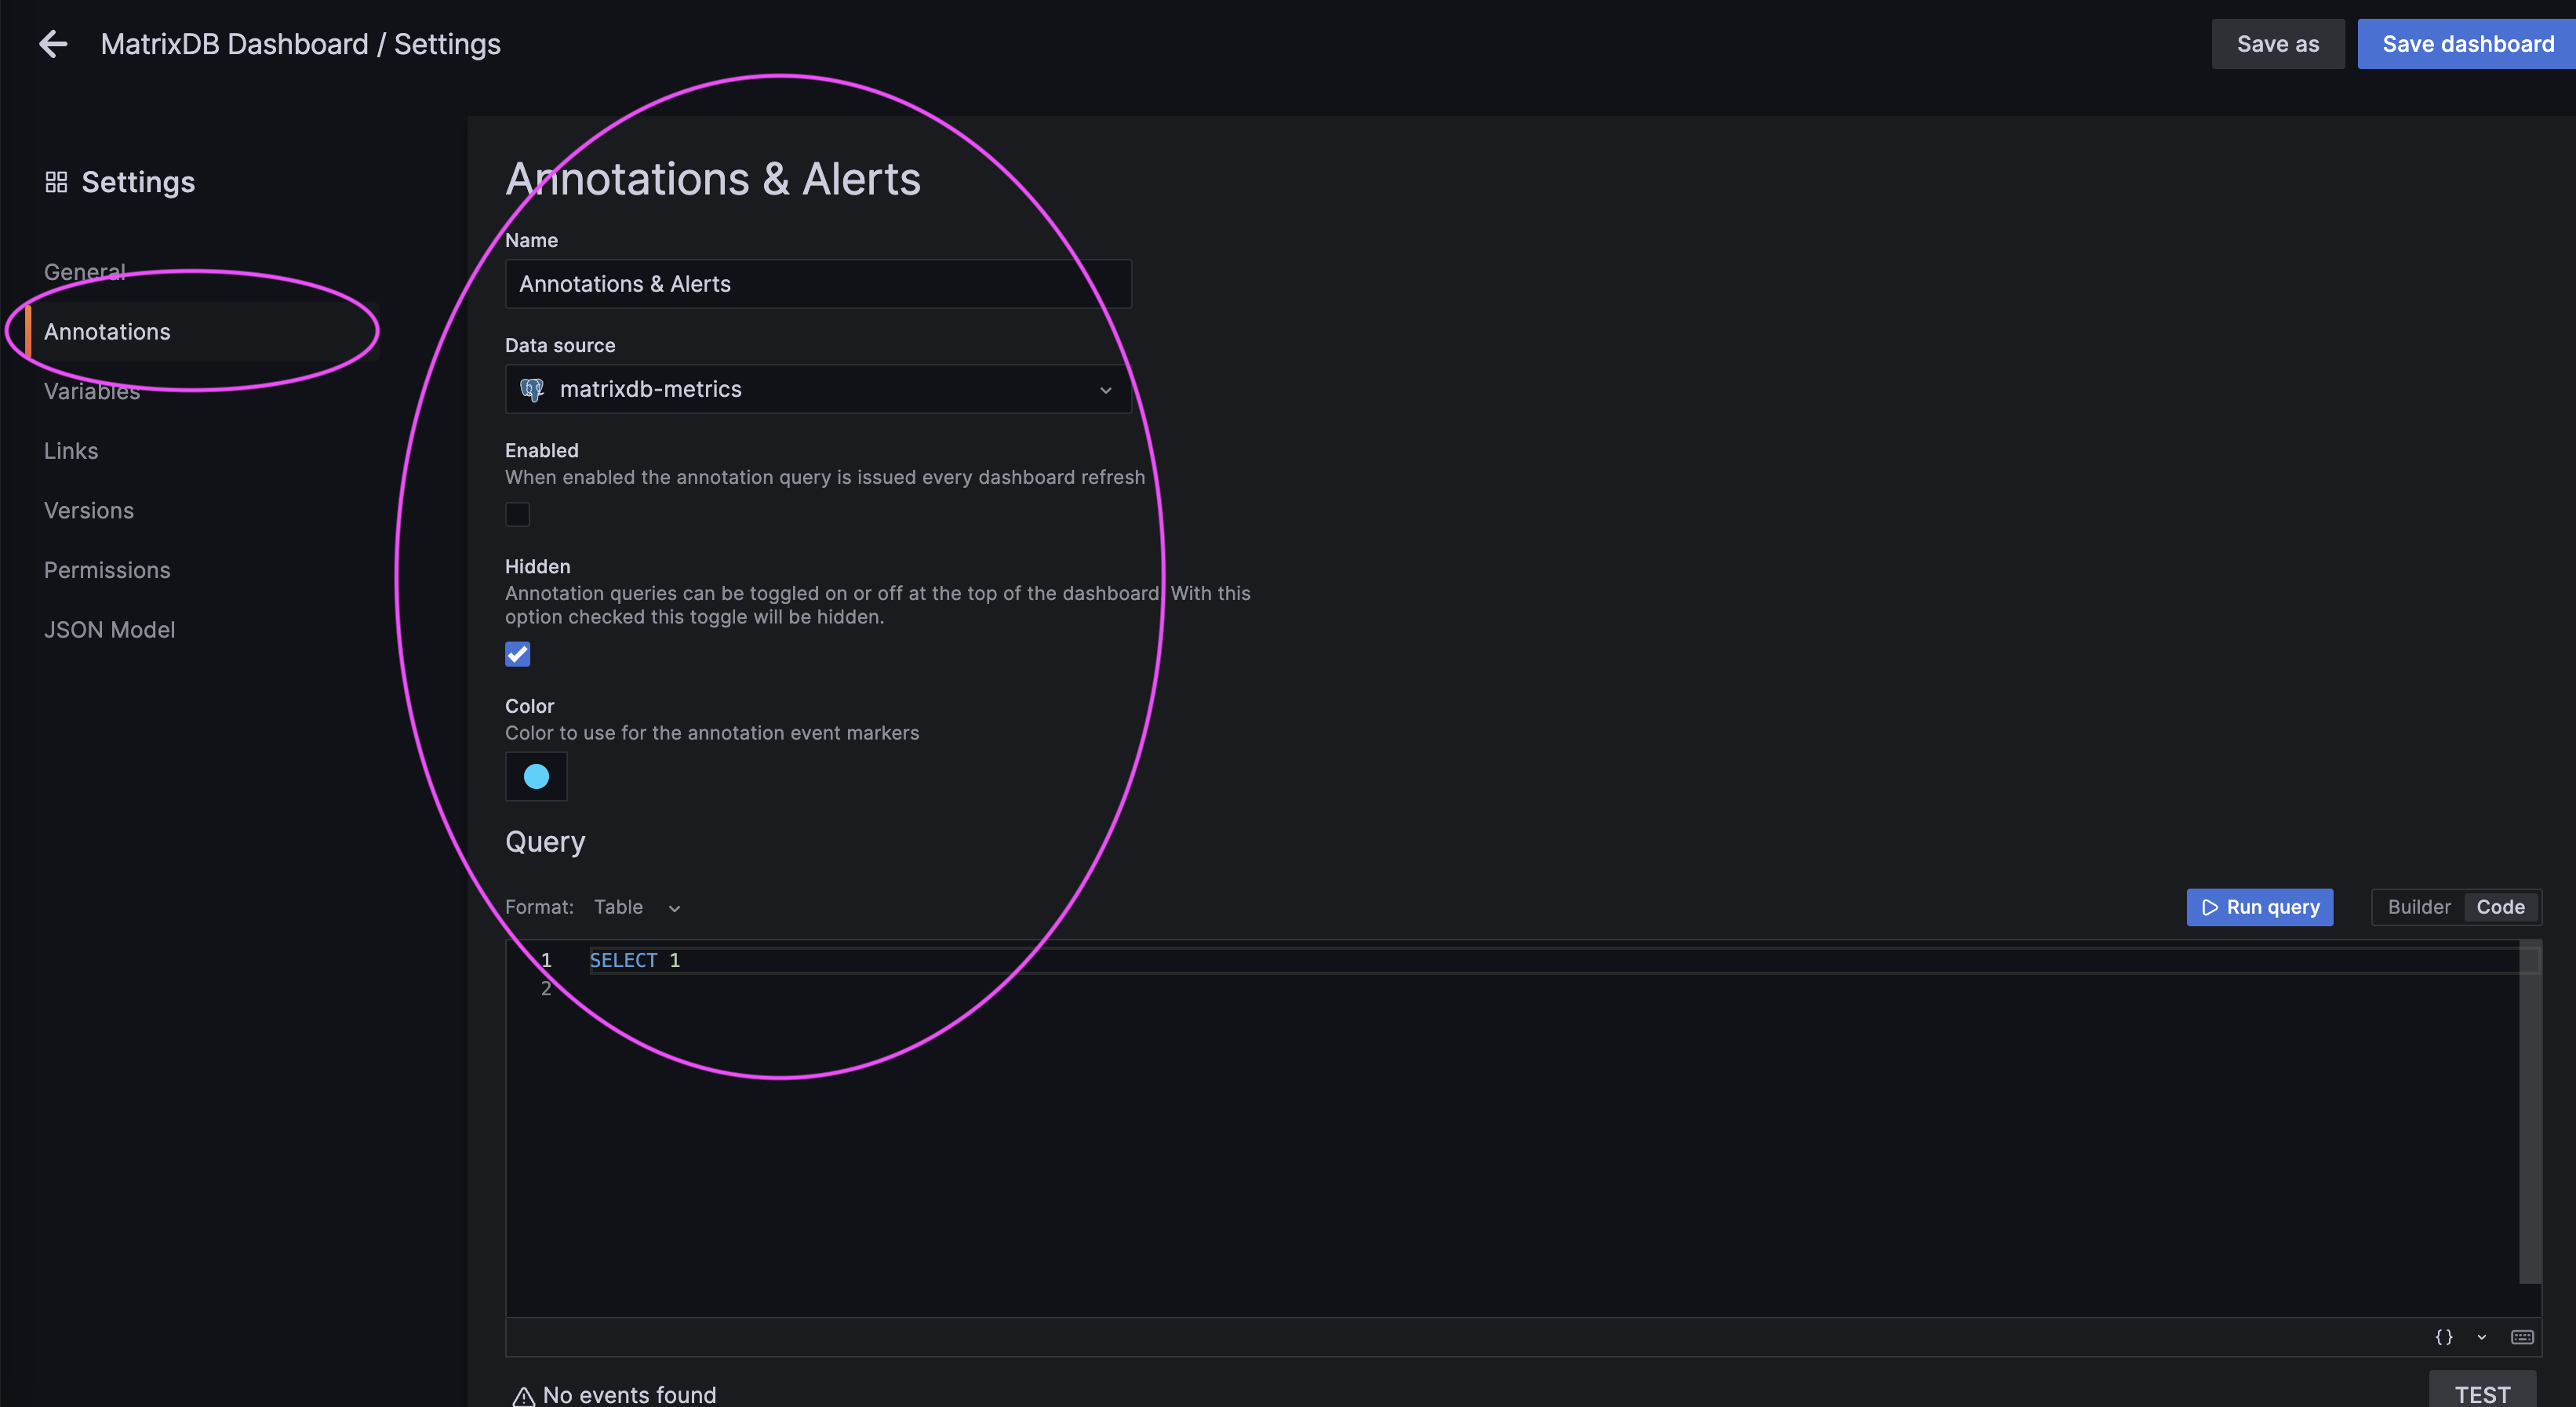
Click the gear icon to configure alerts: