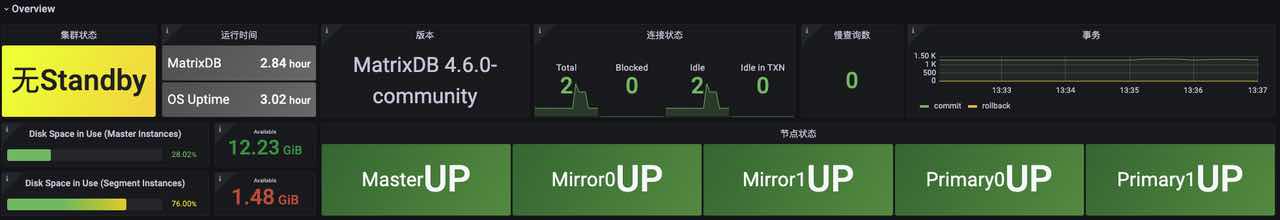
 The Overview panel displays the overall operational status of the cluster, including:
| Parameter | Description | Recommended Alert Threshold |
|---|---|---|
| Cluster Status | Node status of the cluster, including: 0: Normal 1: No Standby 2: No Mirror 10: Imbalanced Distribution (after a node recovery, primary-mirror roles have not been rebalanced) 11: Primary-Mirror Out of Sync (some mirror nodes are out of sync with their primaries) 12: Master Only (only the Master node is running, typically used during diagnostics) 20: Segment Down (unavailable Segment nodes exist, cluster is unusable) |
Segment down is a critical event; an alert is required |
| Uptime | MatrixDB uptime since last start and the operating system uptime of the master host | |
| Version | MatrixDB version | |
| Connection Status | Database connection statistics, including: total connections, blocked queries, idle connections, idle in transaction | |
| Slow Queries | Number of queries currently running longer than 1 day | Alert if greater than 0 |
| Transactions | Statistics on transaction commits and rollbacks | Set alert threshold for rollbacks |
| Disk Usage | Disk usage and available space on master and segment nodes | Recommended to set alerts directly in node_exporter |
| Node Status | Status of each node, including: 0: UP (normal) 10: Switched (role switch occurred; rebalancing needed) 11: Resync (synchronizing primary and mirror) 20: Down (node down) |
Alert on values 11 and 20 |
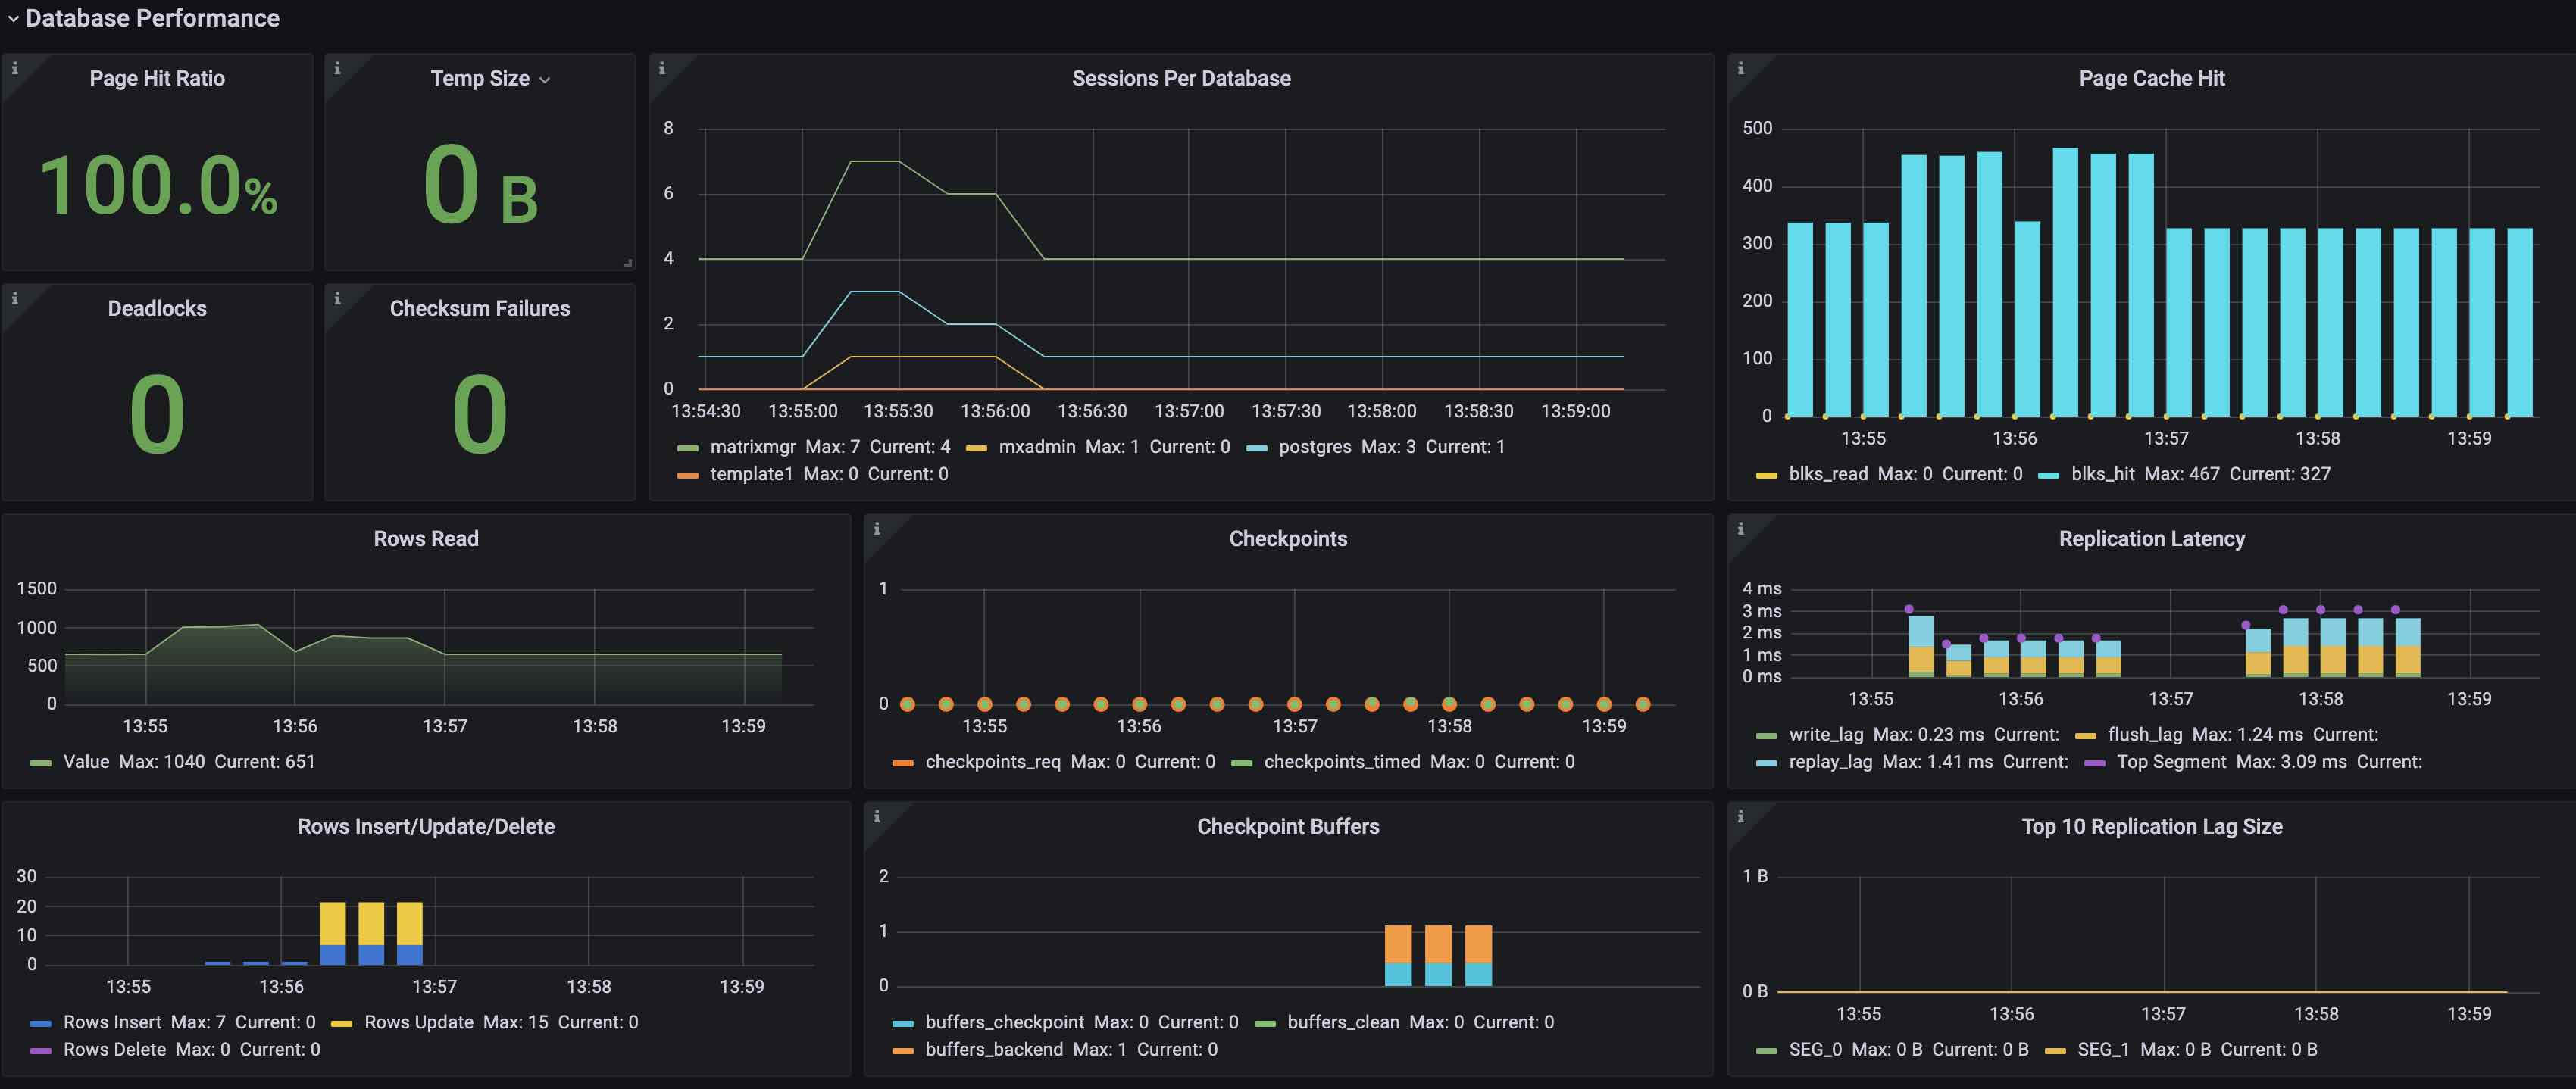 The Database Performance panel shows key database performance metrics:
| Parameter | Description | Recommended Alert Threshold |
|---|---|---|
| Page Hit Ratio | Ratio of buffer hits during data page reads | |
| Temp Size | Temporary file usage | |
| Deadlocks | Number of deadlocks occurred | Alert if greater than 0 |
| Checksum Failures | Number of data page checksum failures | Alert if greater than 0 |
| Sessions Per Database | Number of connections per database | |
| Page Cache Hit | blks_hit: number of buffer hits during data reads blks_read: number of disk reads due to cache miss |
|
| Rows Read | Number of tuples read and returned by queries | |
| Checkpoints | Number of checkpoint events, including: checkpoints_req: manually triggered checkpoints_timed: time-based triggers |
|
| Replication Latency | Primary-mirror replication lag in milliseconds write_lag: delay in writing logs to mirror's file cache flush_lag: delay in flushing logs to mirror's disk replay_lag: delay in replaying logs on mirror Top Segment: sum of write_lag + flush_lag + replay_lag for the node with highest total |
Set alert threshold based on requirements |
| Rows Insert/Update/Delete | Row operation statistics Rows Insert: number of inserted rows Rows Update: number of updated rows Rows Delete: number of deleted rows |
|
| Checkpoint Buffers | Statistics on dirty page writes buffers_checkpoint: number of dirty pages written during checkpoints buffers_clean: number written by bgwriter buffers_backend: number written by backend processes |
|
| Top 10 Replication Lag Size | Replication lag for top 10 nodes, calculated as difference between sent LSN and replayed LSN | Set alert threshold based on requirements |
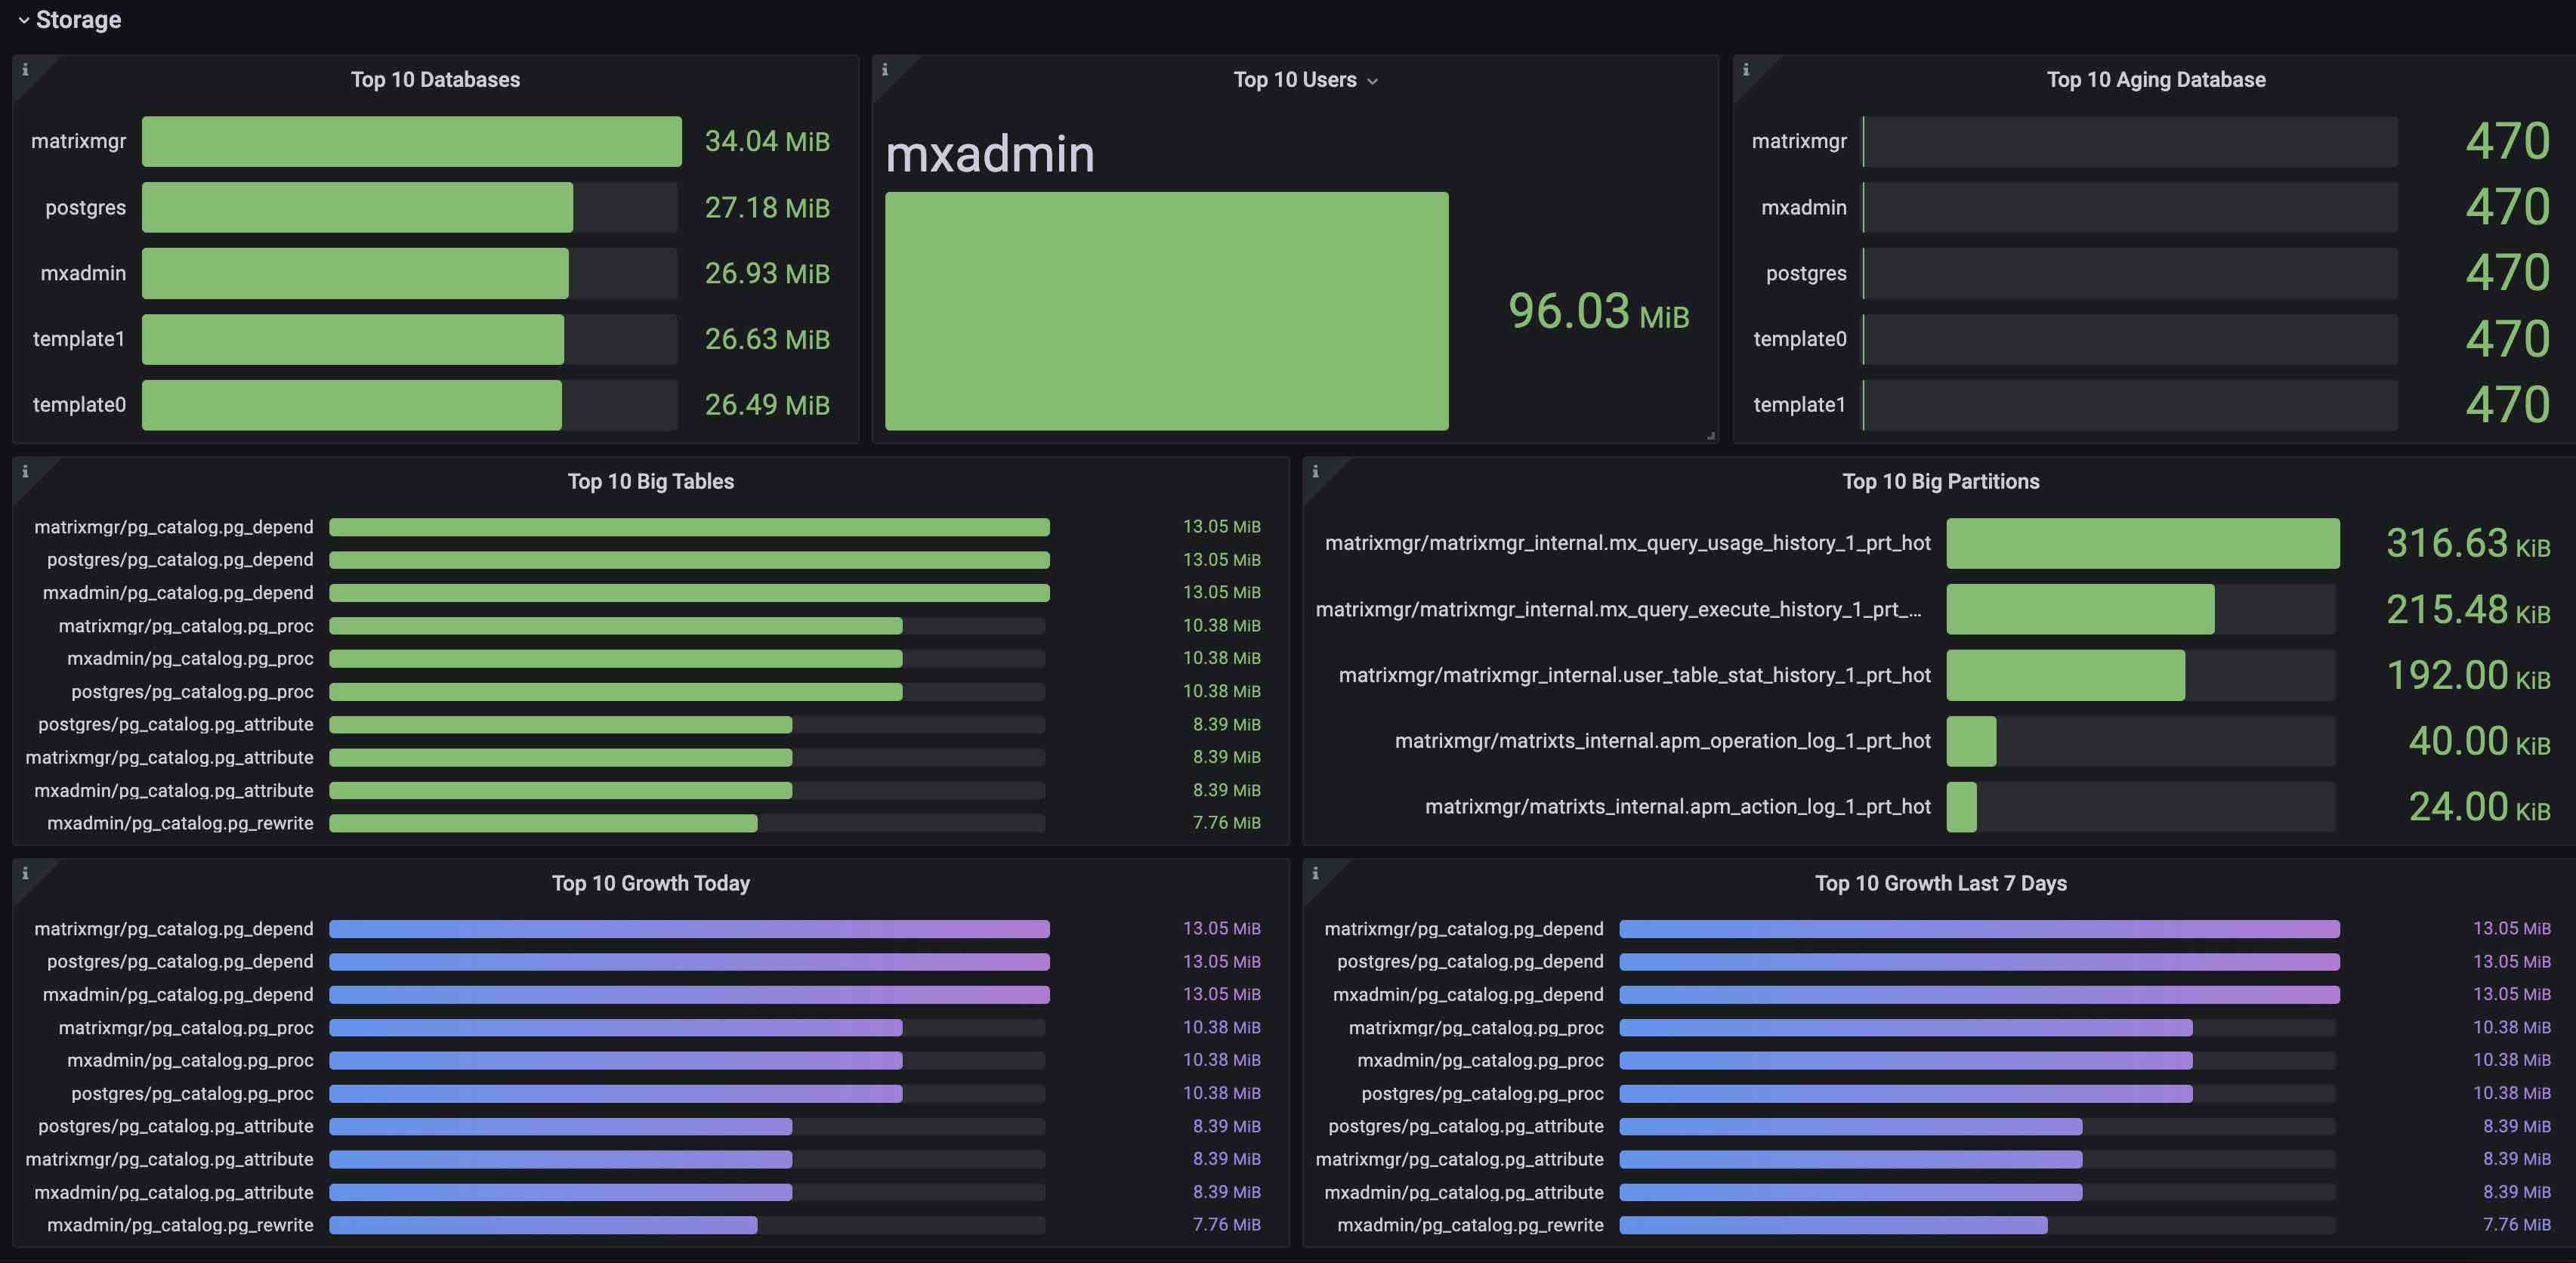 The Storage panel displays storage-related statistics:
| Parameter | Description | Recommended Alert Threshold |
|---|---|---|
| Top 10 Databases | Largest 10 databases by size | |
| Top 10 Users | Top 10 users by data volume generated | |
| Top 10 Aging Database | Top 10 databases by age (transaction IDs below this value are replaced with FrozenXID) | |
| Top 10 Big Tables | Largest 10 tables by size | |
| Top 10 Big Partitions | Largest 10 partitioned tables by size | |
| Top 10 Growth Today | Top 10 tables with the highest size increase today | |
| Top 10 Growth Last 7 Days | Top 10 tables with the highest size increase over the past 7 days |