Quick onboard
Deployment
Data Modeling
Connecting
Migration
Query
Operations and Maintenance
Common Maintenance
Partition
Backup and Restore
Expansion
Mirroring
Resource Management
Security
Monitoring
Performance Tuning
Troubleshooting
Reference Guide
Tool guide
Data type
Storage Engine
Executor
Stream
DR (Disaster Recovery)
Configuration
Index
Extension
SQL Reference
YMatrix provides a native graphical monitoring tool based on Grafana. This document describes the steps for deploying monitoring components and managing their use. YMatrix provides a default monitoring dashboard that monitors the following information. Users can also create new dashboards in Grafana based on the data collected by the system to customize the monitoring items they need.
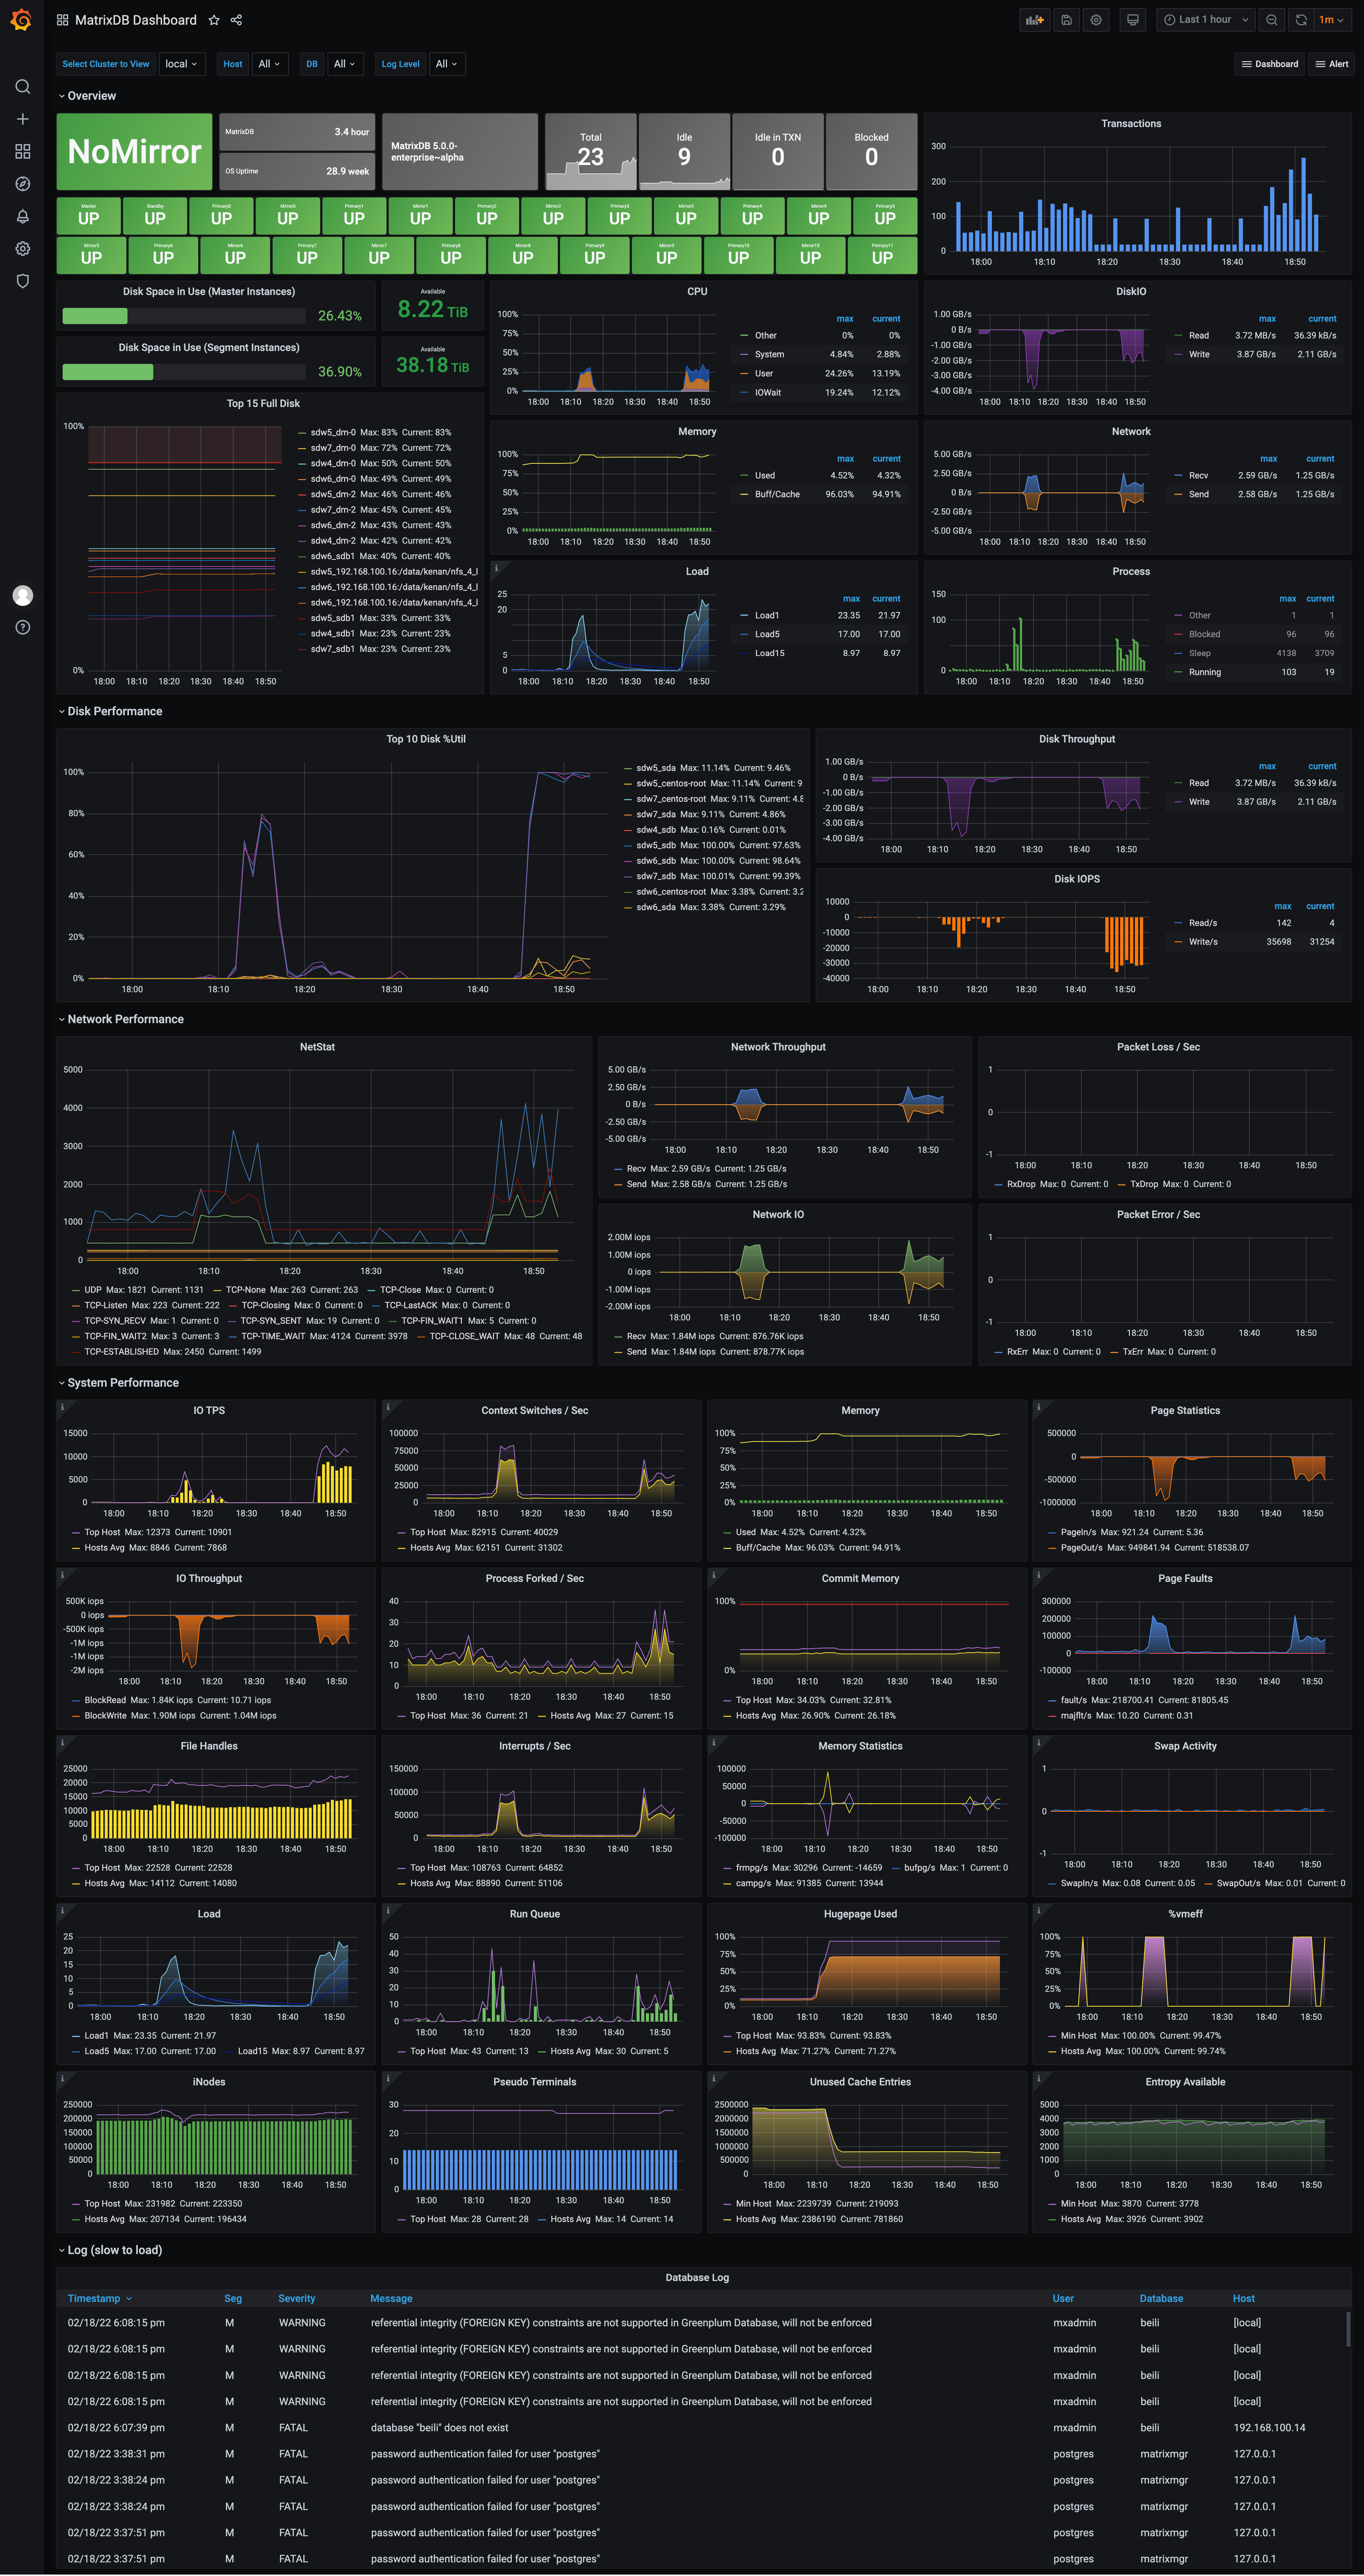
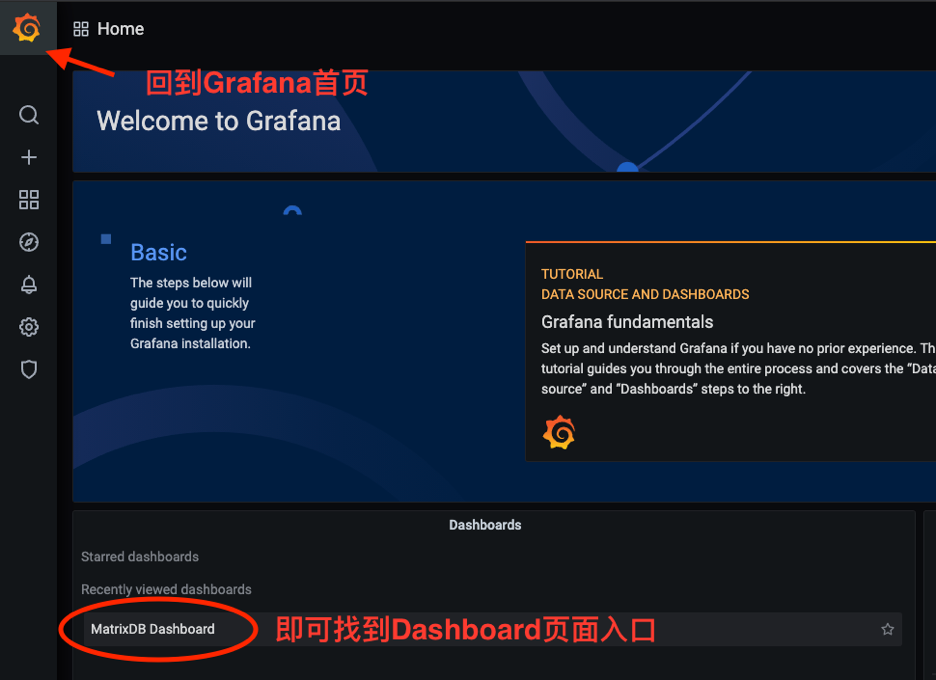
The post-deployment effect diagram is shown below. Starting from version 4.4, monitoring has been divided into two panels: MatrixDB Dashboard and MatrixDB Database.
MatrixDB Dashboard:
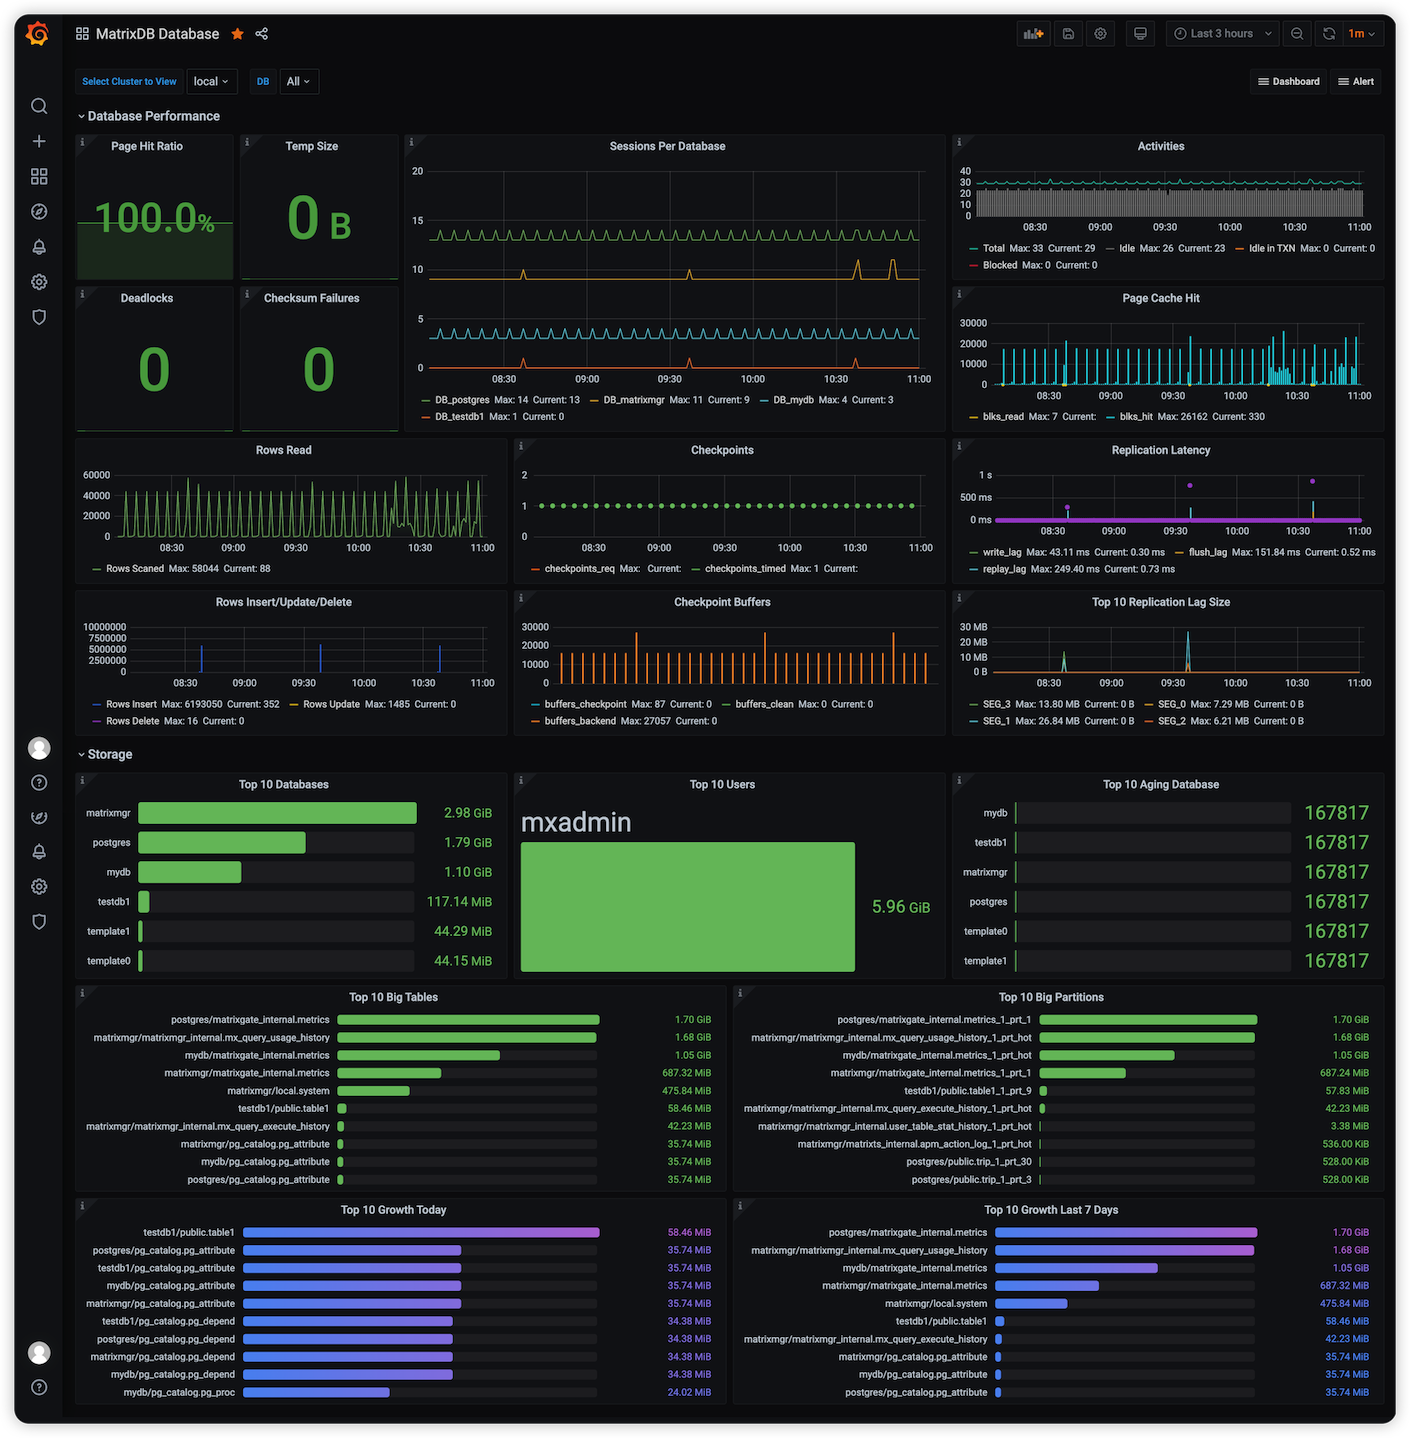
 MatrixDB Database:
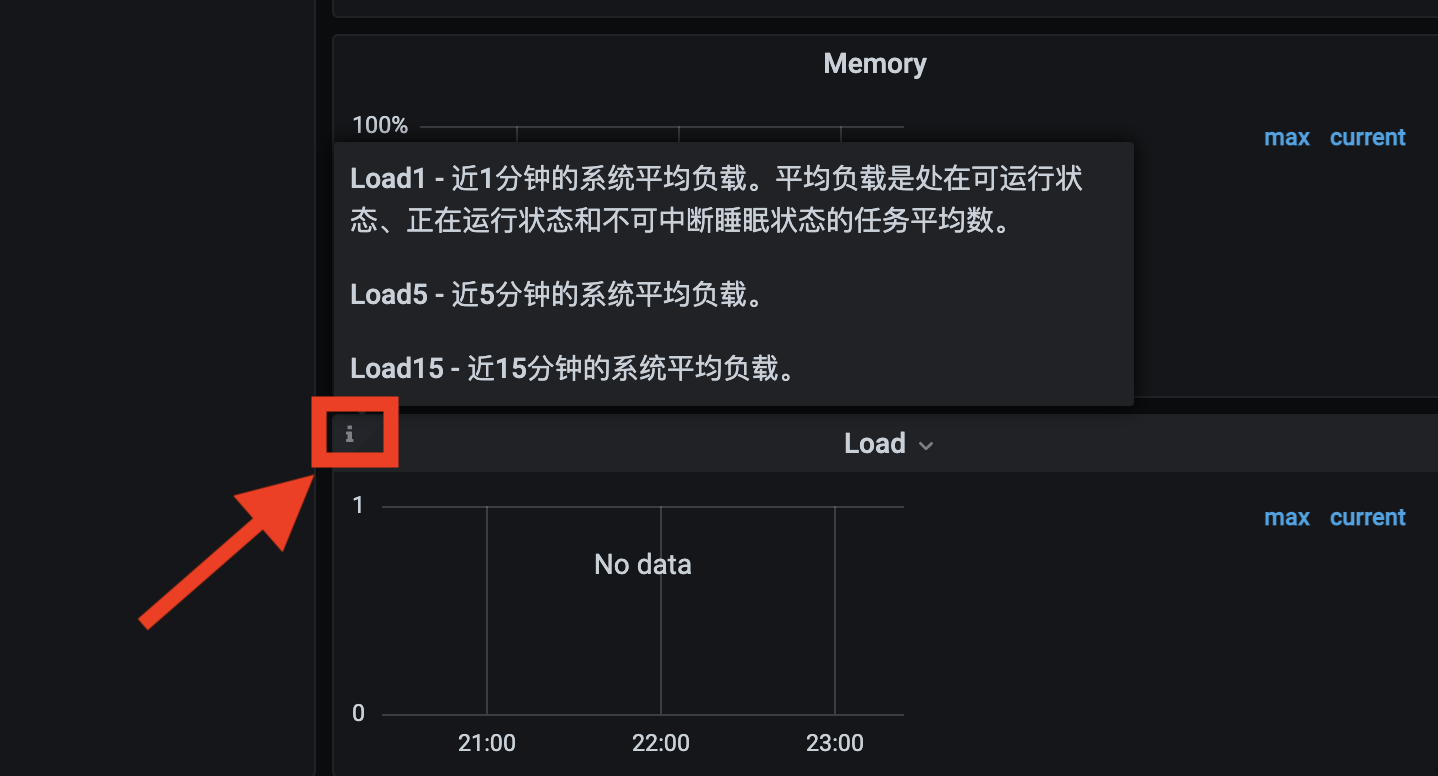
Additionally, descriptions have been added for panels that may be more difficult to understand. Hovering the mouse over the icon in the top-left corner of the panel will display the description:
Monitoring-related components are included in the YMatrix installation package. After deploying YMatrix, complete the monitoring deployment in two steps: activating metric collection and installing and configuring Grafana.
The following operations activate metric collection for YMatrix and system resource usage, and store the collected data in the newly created YMatrix database matrixmgr. In the following example, the Master is mdw.
[<ordinary user>@mdw ~]$ sudo su - mxadmin[mxadmin@mdw ~]$ psql -d matrixmgr
matrixmgr=# SELECT mxmgr_init_local();After successful completion, a new schema named “local” will appear under the matrixmgr database. The tables and views within this schema contain monitoring and configuration information for the cluster. Do not modify the definitions or contents of these tables and views.
Prepare a host that can access both the Master and the external network. This can be a Master or Standby Master node, or a separate machine (Linux, MacOS, Windows, etc.).
Install the Grafana software, preferably version 7.3 or higher. The official download link is https://grafana.com/grafana/download.
The commands below are described using CentOS 7 as an example. For commands on other operating systems, please refer to the corresponding operating system user guide.
Notes!
YMatrix supports offline installation of Grafana. For specific steps, please refer to Monitoring and Alerting FAQ.
wget https://dl.grafana.com/oss/release/grafana-7.3.6-1.x86_64.rpm
sudo yum install grafana-7.3.6-1.x86_64.rpm[mxadmin@mdw ~]$ sudo systemctl daemon-reload
[mxadmin@mdw ~]$ sudo systemctl start grafana-server
[mxadmin@mdw ~]$ sudo systemctl status grafana-server
[mxadmin@mdw ~]$ sudo systemctl enable grafana-serverNotes!
- The Grafana version provided by yum in CentOS 7 is usually outdated (6.x), so it is not recommended to directly use
sudo yum install grafana.- For the complete official installation and configuration process, refer to the following link https://grafana.com/docs/grafana/latest/installation/rpm
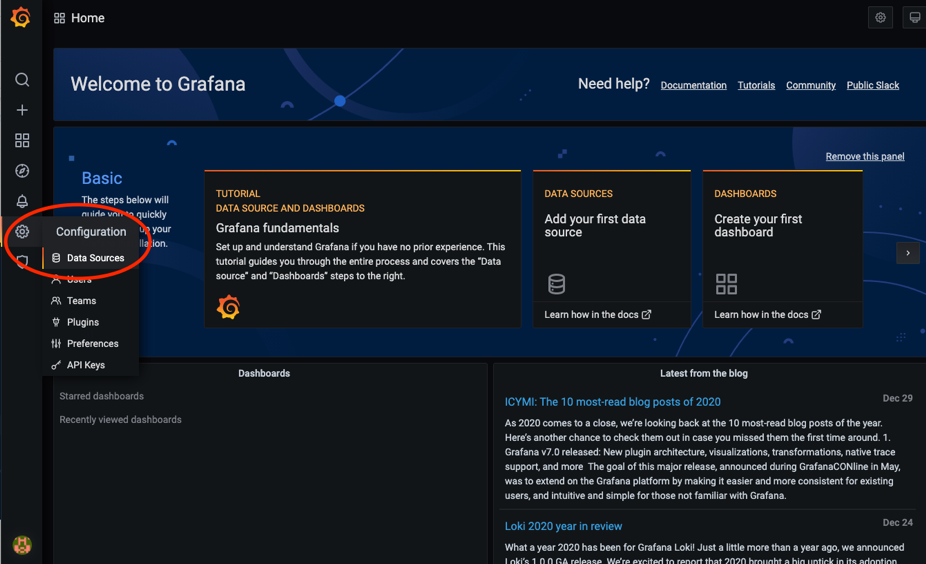
After installation, access the following URL using a browser to view the Grafana homepage. Here, 3000 is the default Grafana access port, which users can modify. Log in using the default username and password (admin / admin). For security reasons, please change the password after logging in. You can access the password change interface by clicking the user avatar icon in the bottom-left corner.
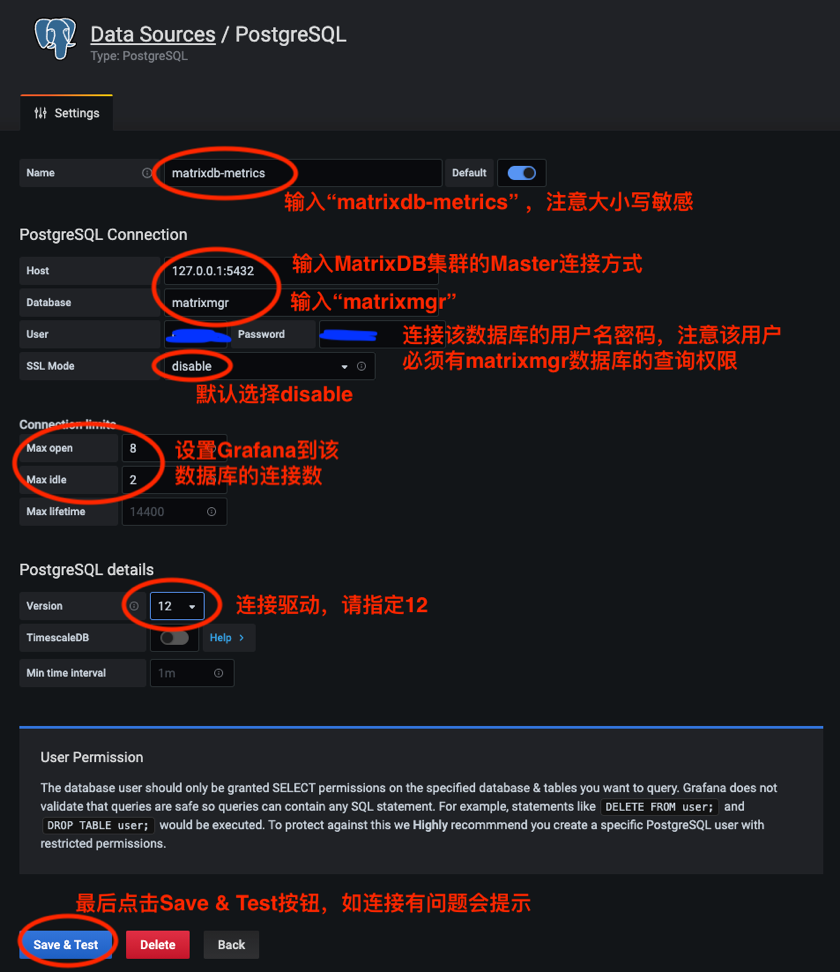
http://<installation node's IP or domain name>:3000After Grafana is installed, you need to add the matrixmgr database in YMatrix as a data source and import the predefined monitoring dashboard.
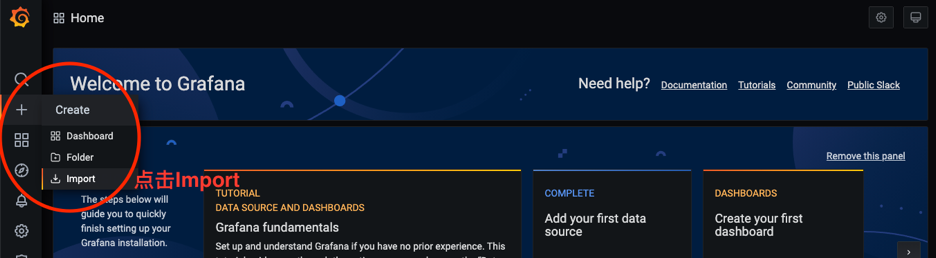
The steps to add a data source are as follows:

Before importing the predefined alert dashboard for deployment configuration, you need to copy the dashboard.json and database.json files to your local machine. The process is as follows: first locate the files on the server, then copy them, and finally import and upload them locally. The specific steps are as follows:
First, log in to the server and switch to the mxadmin user. Locate the dashboard.json and database.json files at the path shown in the image. You can use the cd command, the find command, or any other method you are familiar with. Here, the find command is used as an example for the database.json file.
[mxadmin@mdw ~]$ cd /opt/ymatrix/matrixdb5/share/doc/postgresql/extension

##or

[mxadmin@mdw ~]$ find /opt/ymatrix/matrixdb5/share/doc/postgresql/extension -name database.json
Next, use the scp command to copy the file to your local machine. This may involve permission issues, so you may want to consider copying the file to the public area /tmp/ first, and then copying the file from /tmp/ to your local machine. Here, we use the database.json file as an example.
Note!
When copying files from /tmp/ to your local machine, be sure to switch users to avoid permission issues.
[mxadmin@mdw]$ scp mxadmin@< server IP address >:/opt/ymatrix/matrixdb5/share/doc/postgresql/extension/“database.json” mxadmin@< server IP address >:/tmp/

~ scp waq@< server IP address >:/tmp/“database.json” /Users/akkepler/workplace/Grafana
Finally, open the local folder directly or use the command line to check whether the file has been copied successfully. If successful, import the uploaded file into the Grafana interface.
Note!
If the import is not successful, please add the following variable modification steps.
Replace all instances of ${cluster} in the dashboard.json file with “local,” and set $host to the actual full hostname. For example, if you have a cluster with a master node and two segment nodes named mdw, sdw1, and sdw2, you need to replace all instances of $host in your dashboard.json file with ‘mdw,’ 'sdw1,' and 'sdw2.' For database.json, only the former needs to be modified. After making the changes, you can import and upload the file in the Grafana interface.
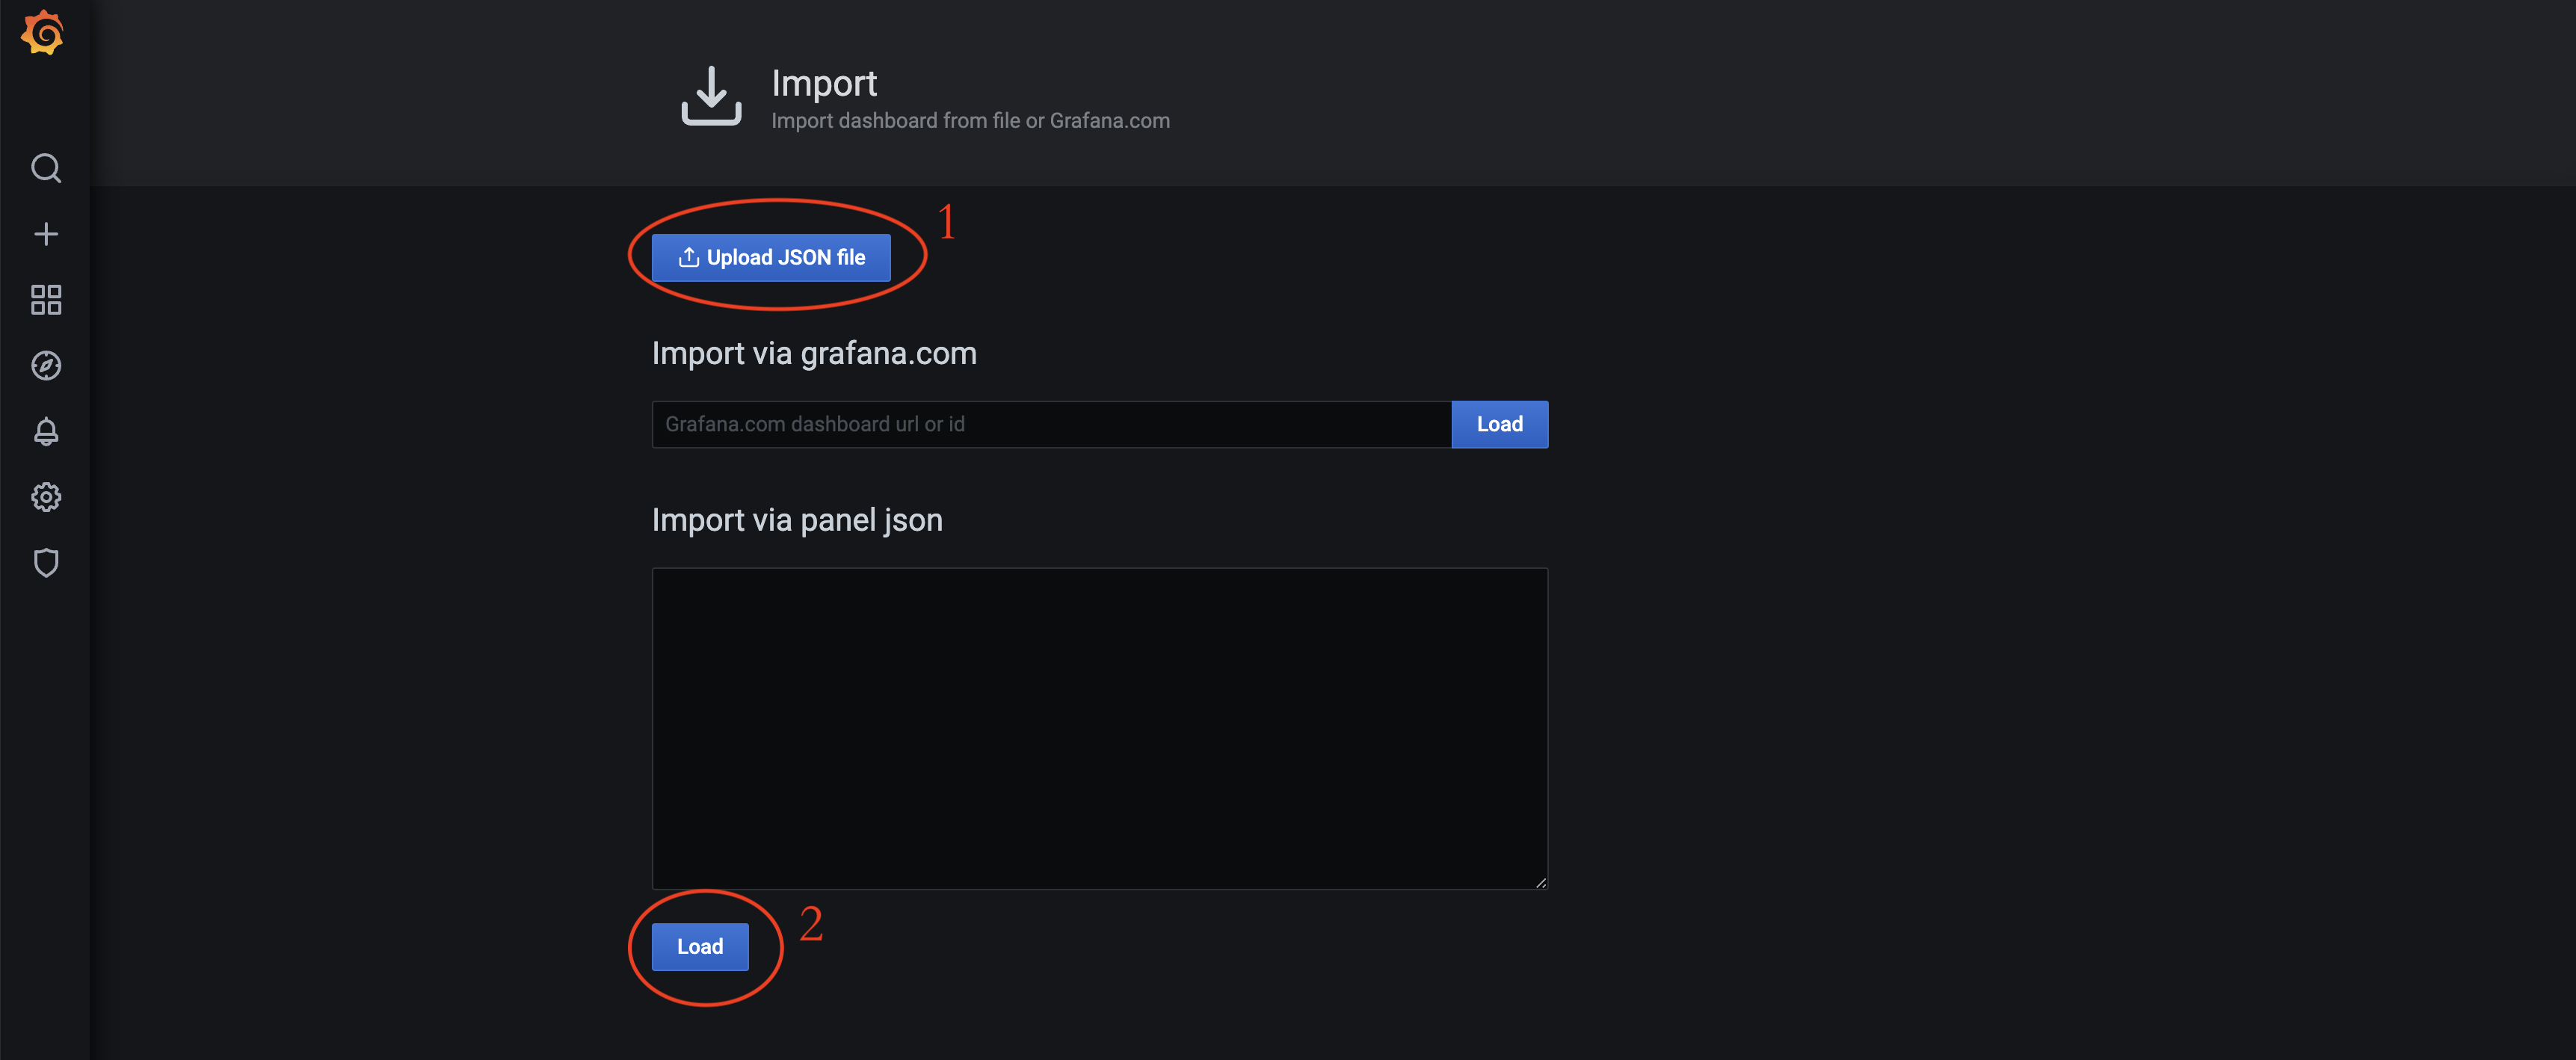 Click the “Upload JSON file” button to select the dashboard.json and database.json files to import. These files are located by default in the /opt/ymatrix/matrixdb5/share/doc/postgresql/extension directory.
Notes!
For more information on YMatrix dashboard configuration, node_exporter dashboard addition, MatrixGate monitoring dashboard deployment, and etcd monitoring dashboard deployment, refer to Grafana Monitoring Dashboard.
For more alert settings, refer to Grafana Cluster Alerts.
After enabling cluster status collection, each host will run the collection service, and the relevant logs will be saved in the /var/log/matrixdb directory.
If you restart YMatrix, or restart the server and then start YMatrix, the data collection service will also start automatically without manual intervention.
To terminate the data collection service, connect to the matrixmgr database and execute the mxmgr_remove_all command. After termination, the collected data will be retained:
[mxadmin@mdw ~]$ psql -d matrixmgr

matrixmgr=# SELECT mxmgr_remove_all(‘local’);
If the data collection service is manually terminated or YMatrix is reinstalled, you need to reactivate data collection by connecting to the matrixmgr database and executing the mxmgr_deploy command:
matrixmgr=# SELECT mxmgr_deploy(‘local’);