Grafana's alerting feature detects whether corresponding monitoring metrics meet the set trigger criteria based on monitoring configuration, and is used to notify and help you promptly discover and fix issues to ensure the security and stability of your cluster. This section describes the steps for configuring monitoring alert components and managing their use. YMatrix provides monitoring alert functionality for the following metrics.
Four alerting methods are configured for each metric, which you can select or combine as needed. These are:
To use the alerting functionality, you must first deploy and enable monitoring. For detailed steps, please refer to: Grafana Installation and Management
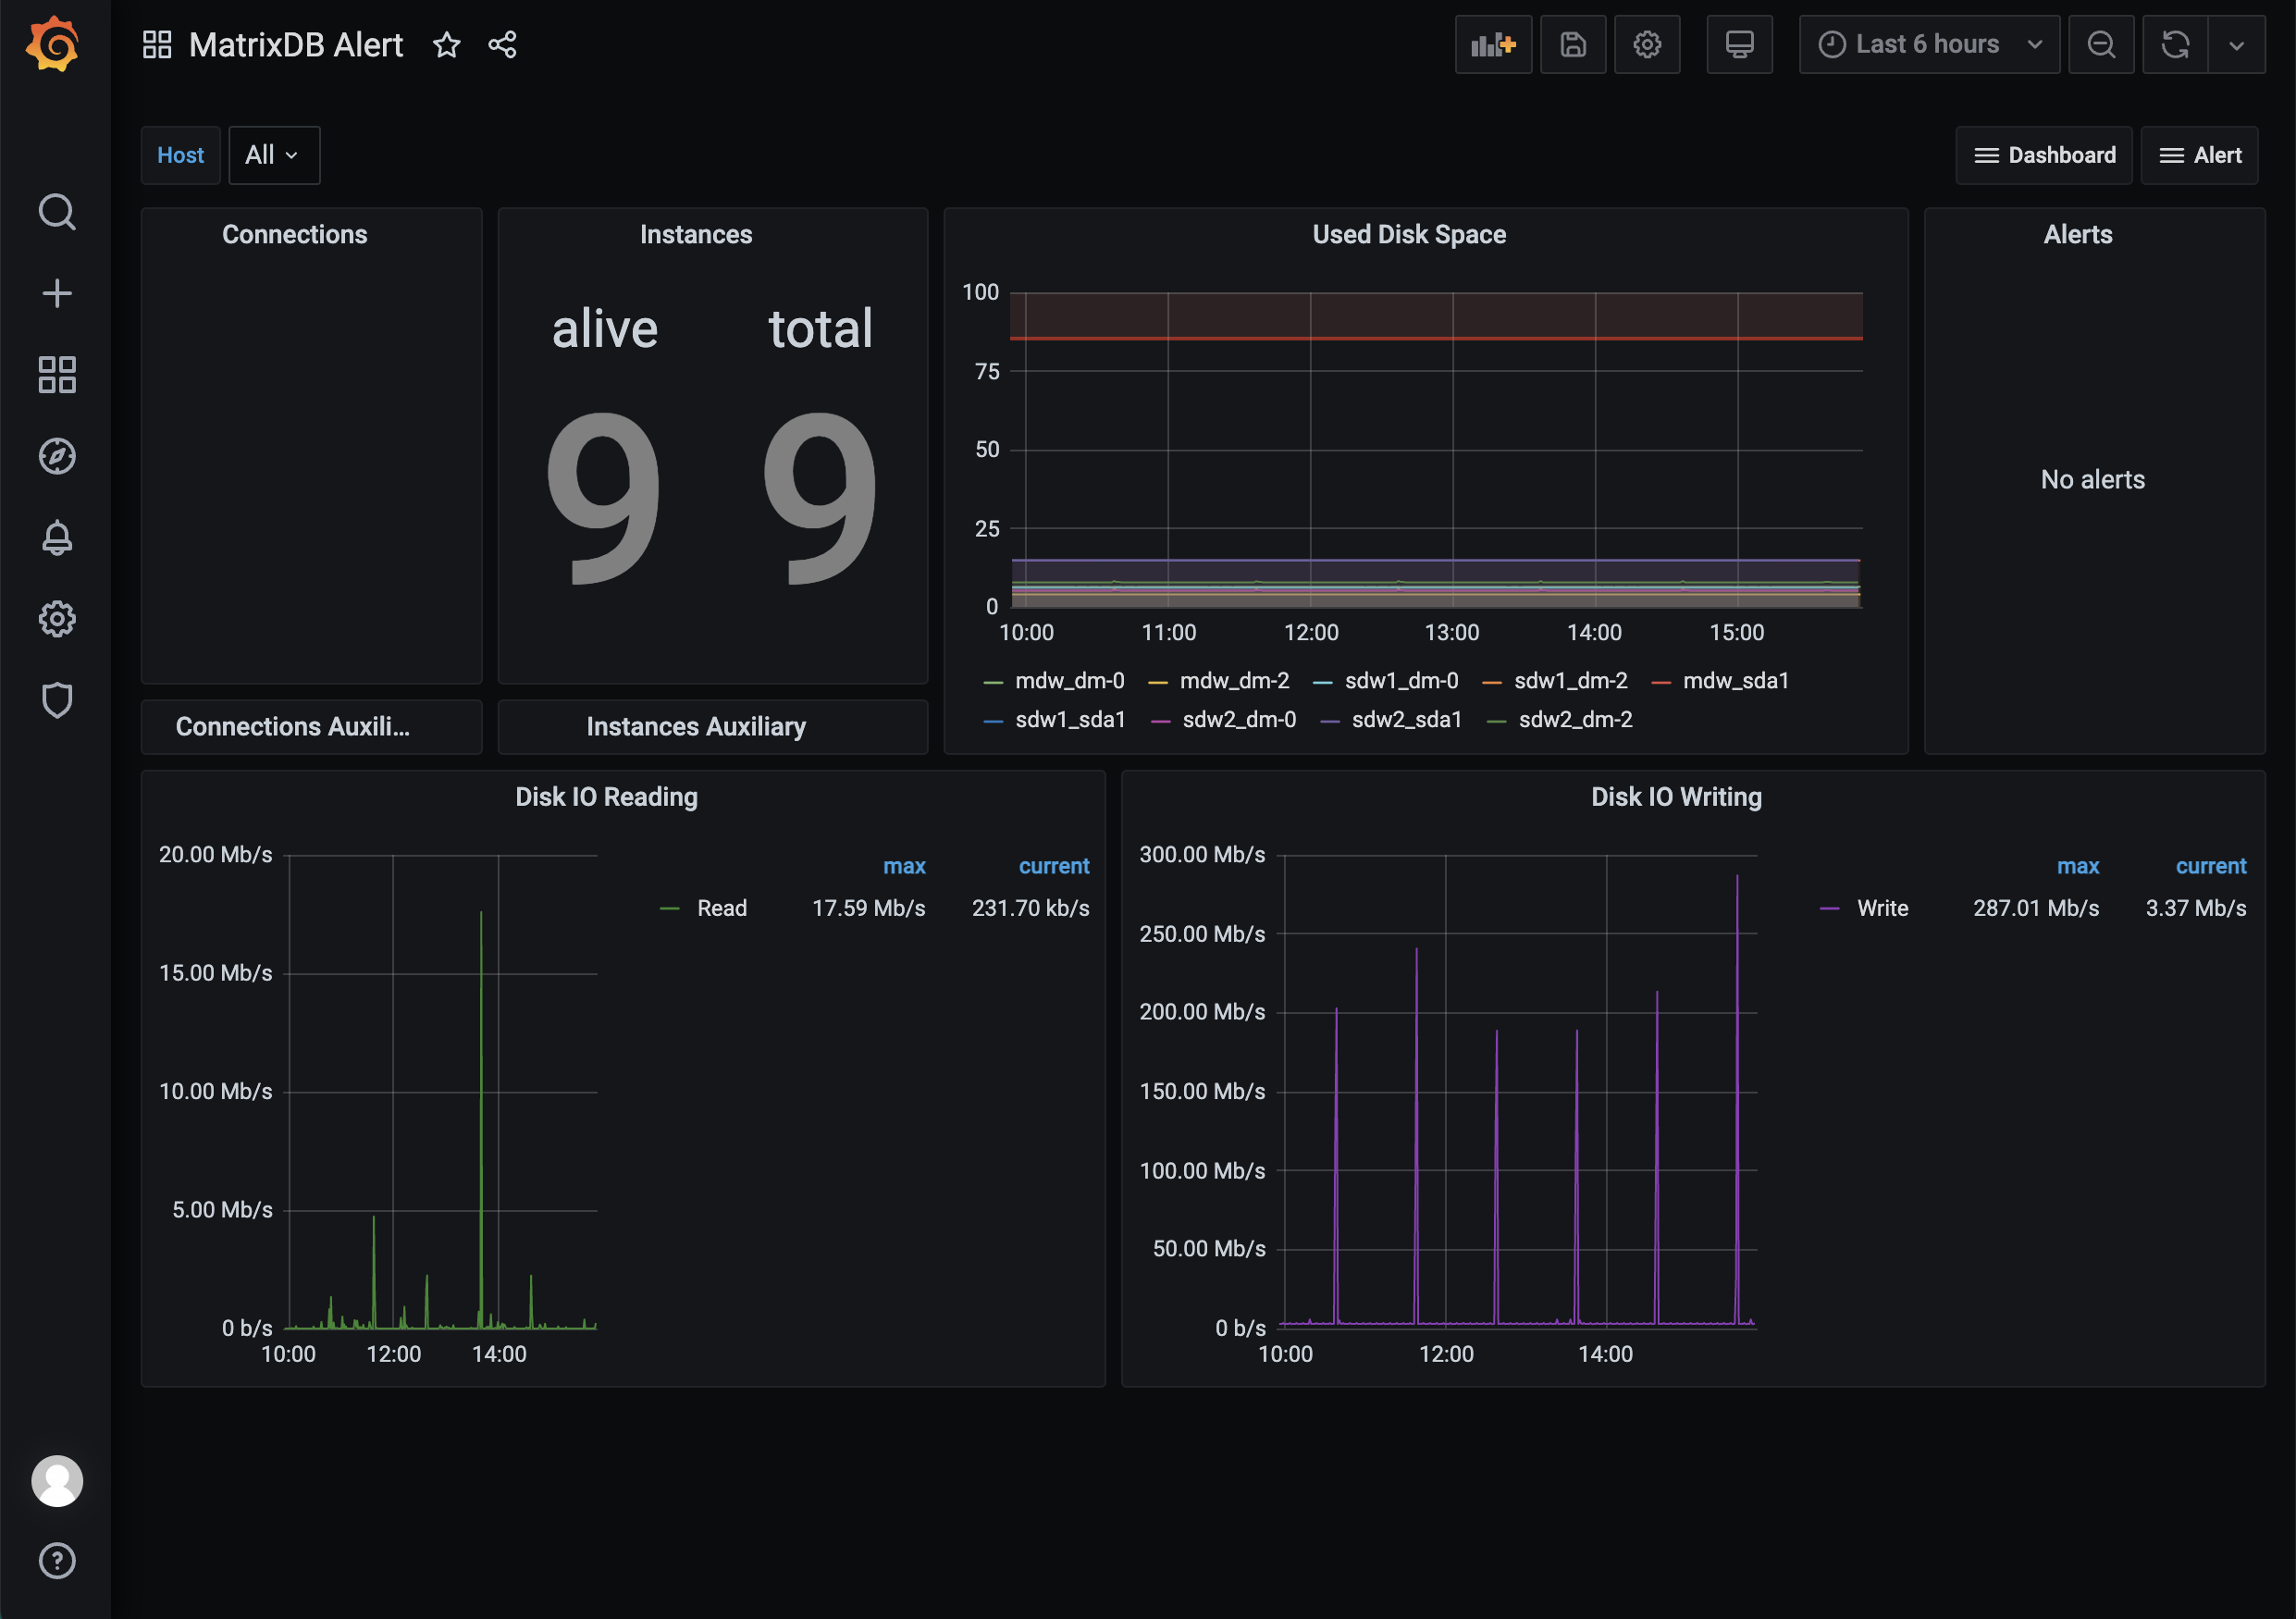
After deployment, you will see the following interface:
Before importing the predefined alert panel for deployment configuration, you need to copy the alert.json file from the server to your local machine. Similar to importing the dashboard.json and database.json files in Grafana, the process is as follows: first locate the file on the server, then copy it, and finally import and upload it locally. The specific steps are as follows:
First, log in to the server, switch to the mxadmin user, and locate the alert.json file at the path shown in the image. You can use the cd command, the find command, or any other method you are familiar with.
[mxadmin@mdw ~]$ cd /opt/ymatrix/matrixdb5/share/doc/postgresql/extension

##or

[mxadmin@mdw ~]$ find /opt/ymatrix/matrixdb5/share/doc/postgresql/extension -name alert.json
Second, use the scp command to copy the file to your local machine. This may involve permission issues, so you may want to consider copying the file to the public area /tmp/ first, and then copying the file from /tmp/ to your local machine.
Notes!
When copying files from /tmp/ to your local machine, be sure to switch users to avoid permission issues.
[mxadmin@mdw]$ scp mxadmin@< server IP address >:/opt/ymatrix/matrixdb5/share/doc/postgresql/extension/“alert.json” mxadmin@< server IP address >:/tmp/

~ scp waq@< server IP address >:/tmp/“alert.json” /Users/akkepler/workplace/Grafana
Finally, open the local folder directly or use the command line to check if the file has been copied successfully. After successful copying, you need to batch modify the $host variable in the alert.json file to the actual hostname. For example, if you currently have a cluster consisting of a master node and two segment nodes named mdw, sdw1, and sdw2, you need to change all instances of $host in the alert.json file to ‘mdw’, ‘sdw1’, and ‘sdw2’. After making the changes, import and upload the file in the Grafana interface.
Notes!
When deploying your Grafana interface, the dashboard.json and database.json files also need to be modified, and they must be uploaded before the alert.json file. In dashboard.json, all ${cluster} need to be changed to local, and $host needs to be changed to the actual host name. In database.json, only the former needs to be modified.
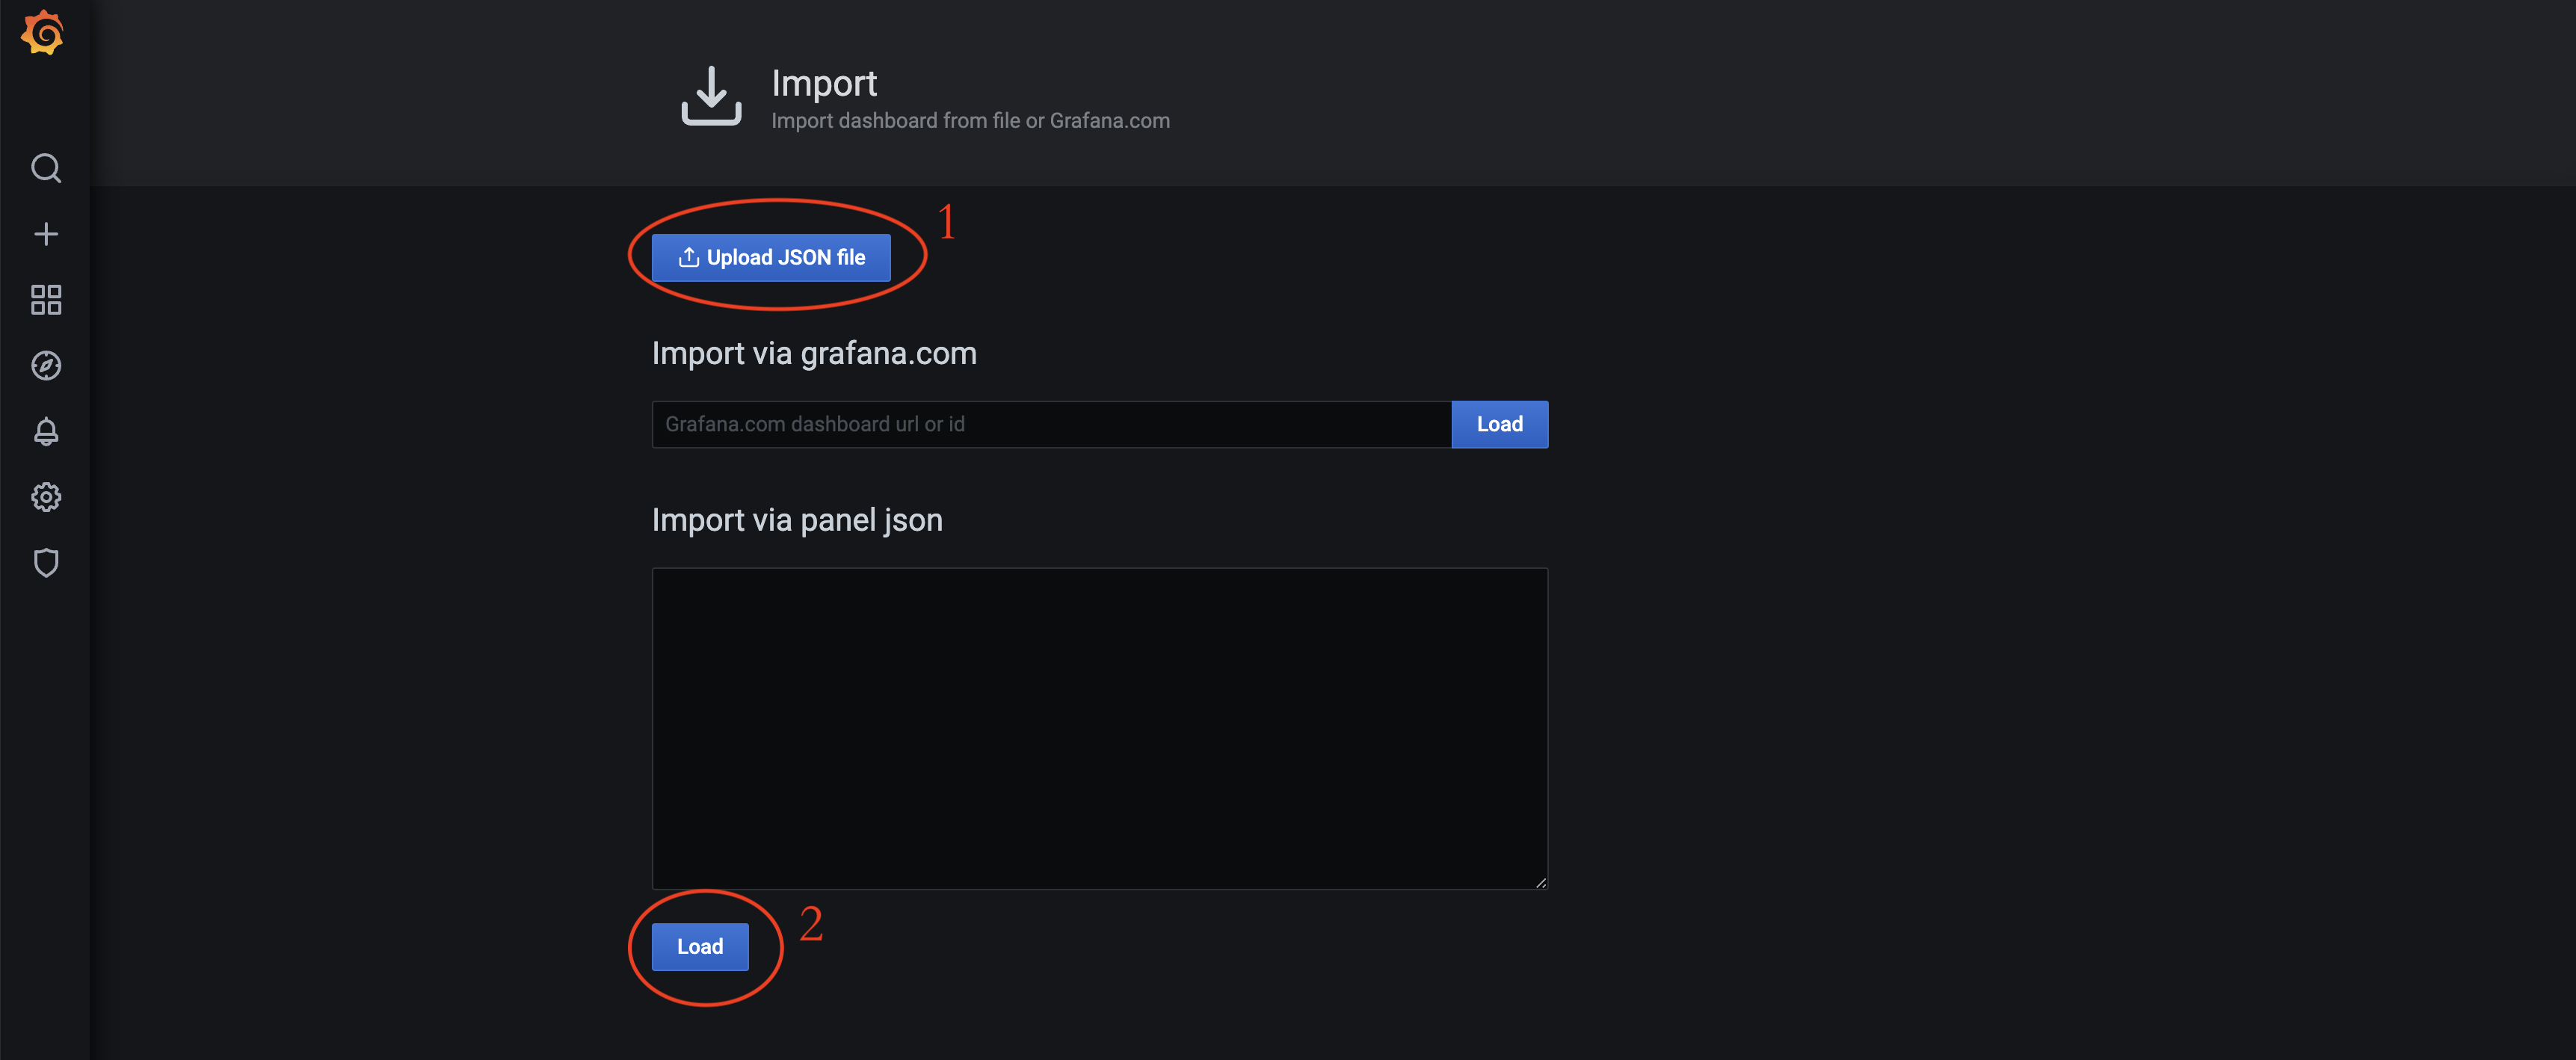 Select the alert.json file, located at /opt/ymatrix/matrixdb5/share/doc/postgresql/extension.
The alert panel and monitoring panel are used in the same way and can be switched between using the dropdown menu. The dropdown menu is located in the top-right corner of each panel.
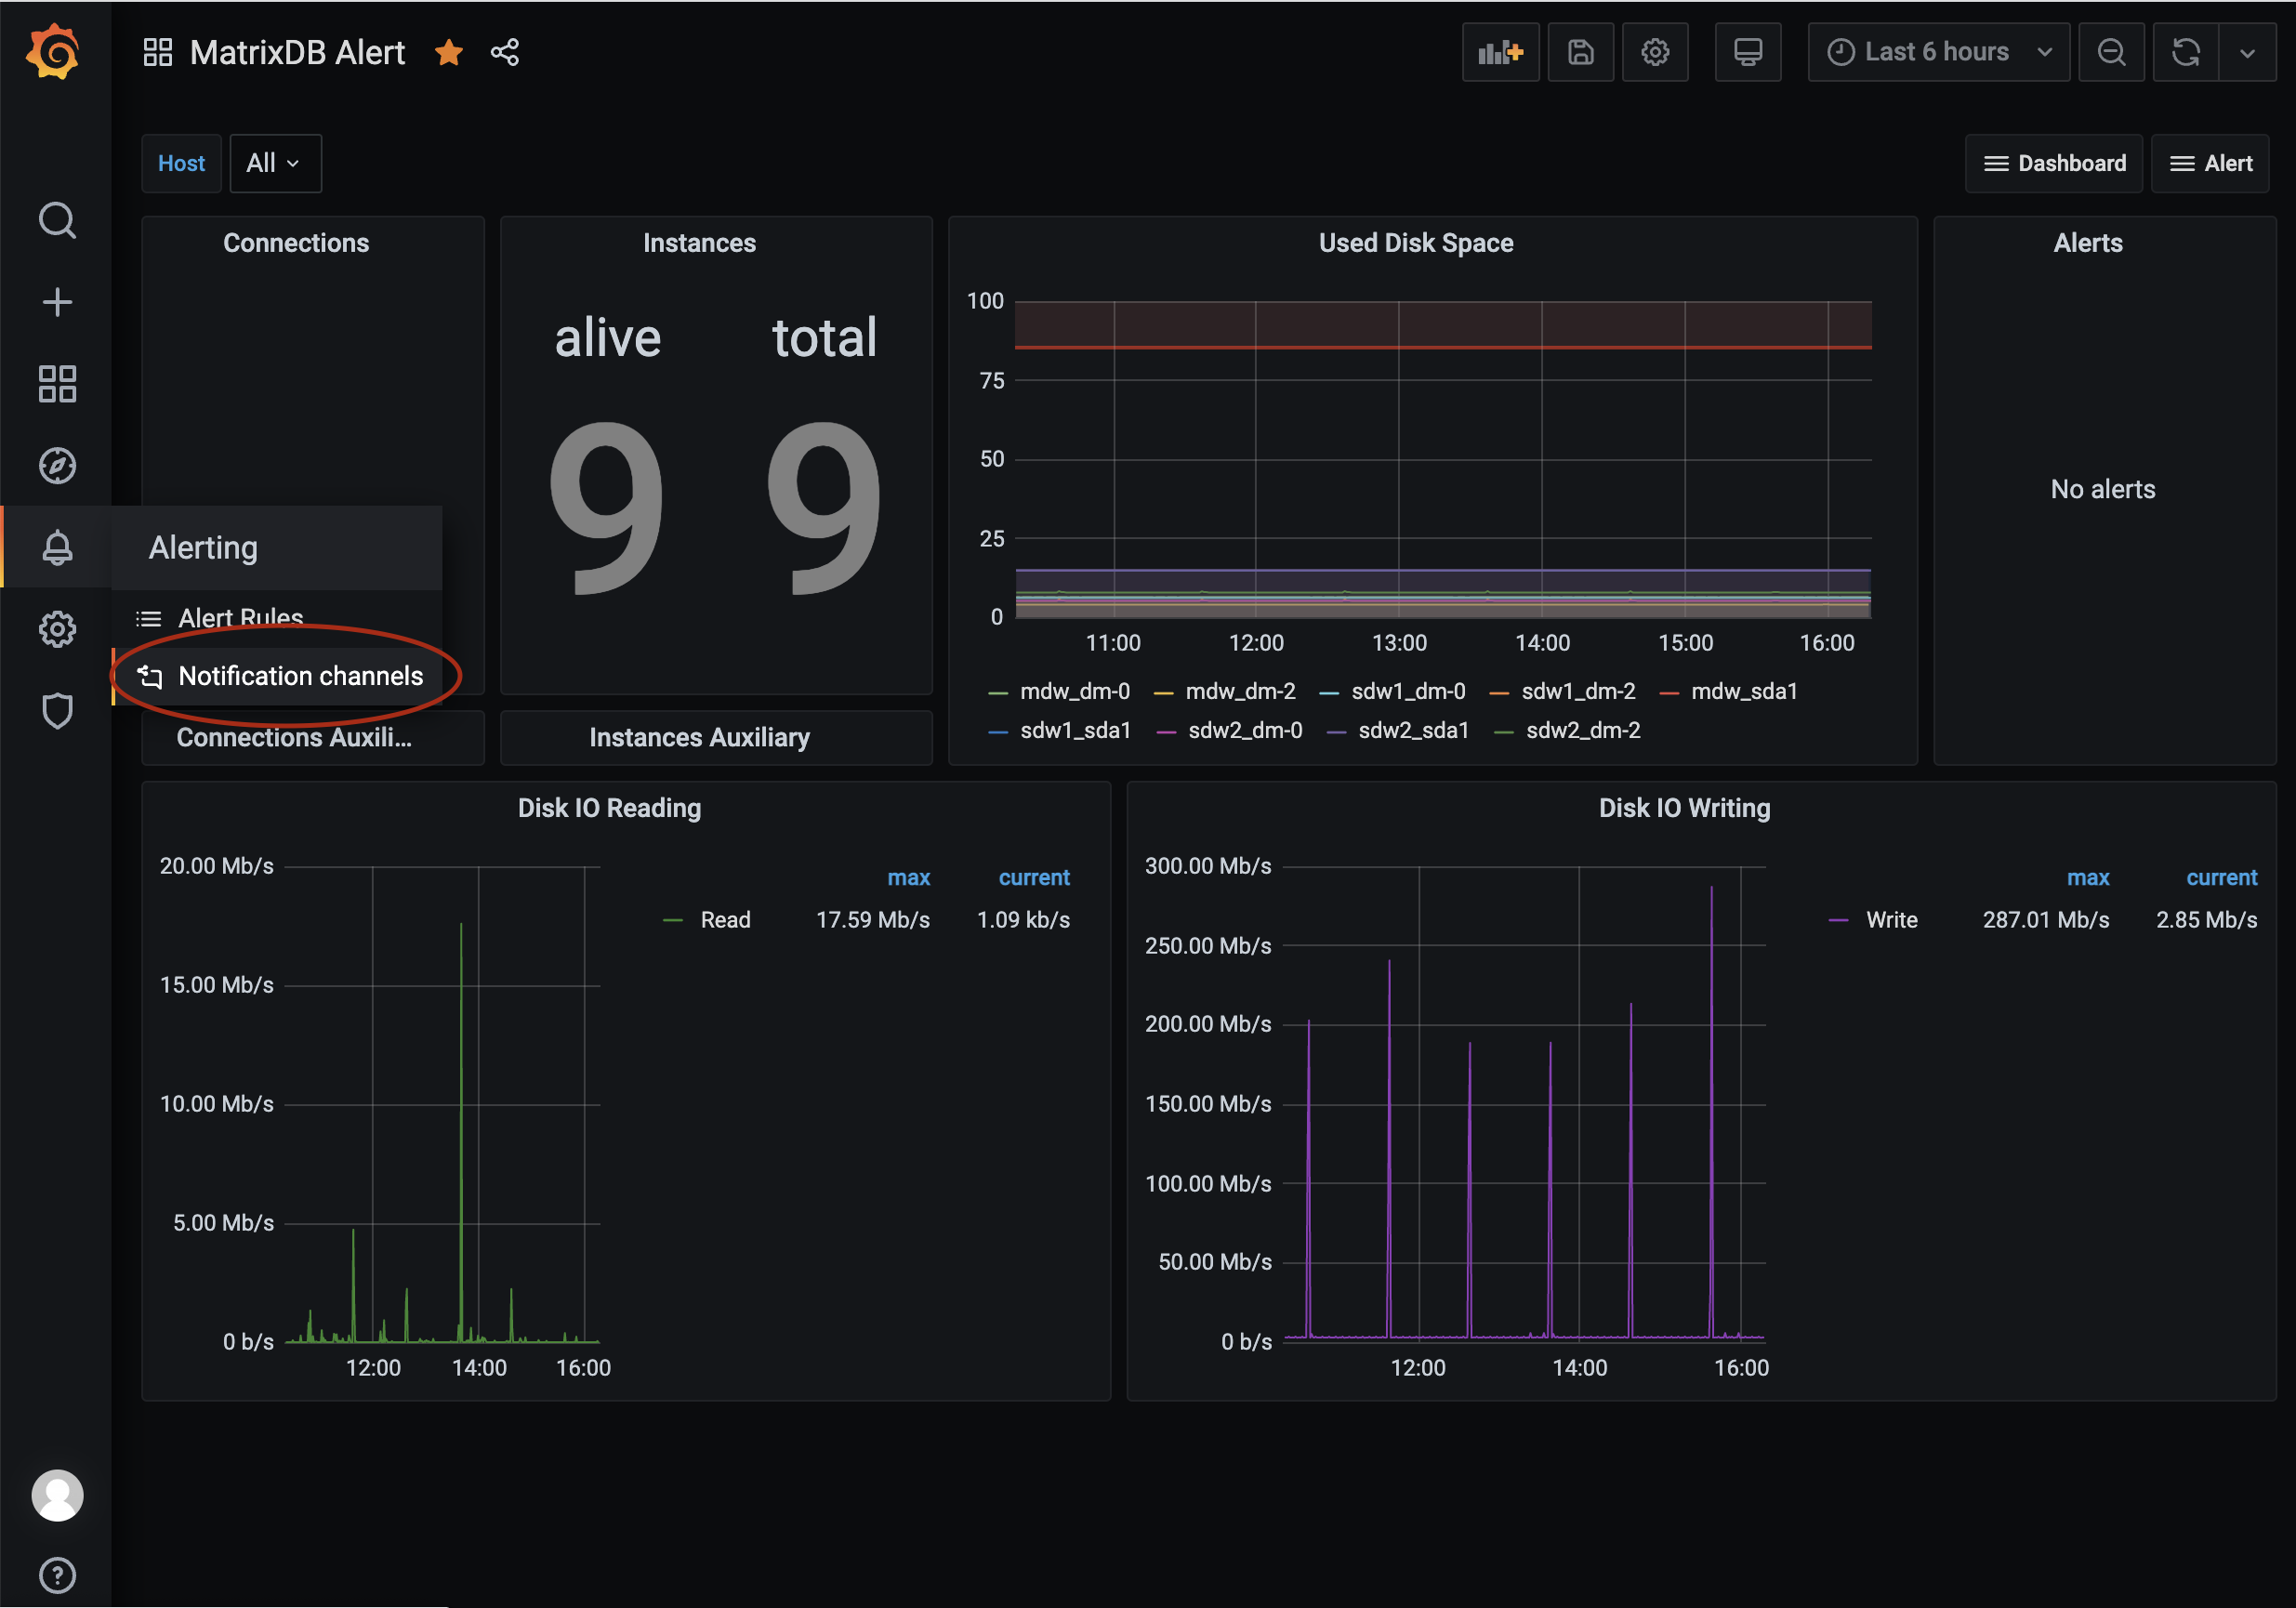
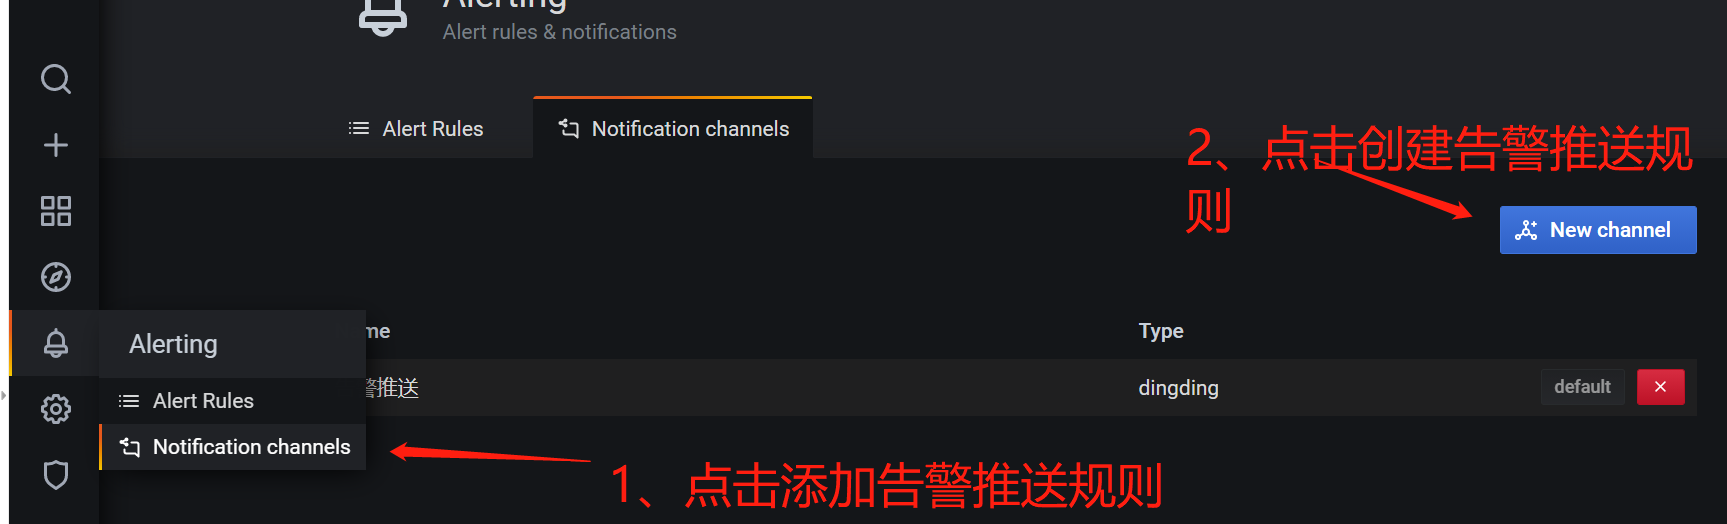
First, you need to configure notification channels. The entry point is shown below:
YMatrix includes built-in alert functionality based on Alibaba Cloud's SMS service, which is recommended for use. Select the built-in service, and if an alert is triggered, an SMS will be sent to the mobile number you have configured. Batch sending is supported. Before use, you need to apply for and configure Alibaba Cloud's SMS service. For detailed steps, please refer to:
Alibaba Cloud Documentation: Quick Start Guide for Domestic SMS
You can also configure a Webhook for SMS alerts. This requires programming to implement the Webhook logic. For specific methods, please refer to: Grafana Alert Documentation: Webhook Notifications
In the /etc/matrixdb/ directory, create the alert.yaml file
# Alibaba Cloud service configuration
aliyun_service:
  access_key_id: “your access_key_id”
  access_key_secret: “ access_key_secret”
  signature: “signature”
  sms_template_code: “SMS_123445678”
The access_key_id and access_key_secret are the Access Key ID and Access Key distributed after activating Alibaba Cloud services. The signature is the original signature registered and approved in the Alibaba Cloud SMS service control panel, and the sms_templatecode is the SMS template code starting with “SMS” that has been registered and approved in the Alibaba Cloud SMS service control panel. The template text can be viewed on the Alibaba Cloud platform. The variable carrying the specific alarm information is set to ${name}. Here is an example:
Dear Administrator, your company's database system has triggered a ${name} alarm. Please log in to the website to view the details and handle it promptly.As shown in the figure:

The channel name should follow the following rules:
Aliyun Batch Short Message - For SuperAdministrators
“SuperAdministrators” is a group of people who need to receive alert notifications. If you need to define another group of people who need alert notifications, you need to configure the rules separately. In addition, the “phoneNumbers” parameter is case-sensitive and can be configured with multiple numbers to achieve batch sending, separated by commas.
http://
: /api/alert/batch-sms?phoneNumbers=18311111111,13811111111
In addition to SMS alert functionality, YMatrix also includes built-in phone voice alert functionality based on Alibaba Cloud's phone voice service. If an alert is triggered, a call will be made to the phone number you have configured. Batch calling is also supported. Before use, you need to apply for and configure Alibaba Cloud's voice phone service. For detailed steps, please refer to: Alibaba Cloud Documentation: Quick Start Guide for Domestic Voice Services
You can also configure a webhook for voice call alerts, but this requires programming to implement the webhook logic. Further details are not provided here. If you are interested, please refer to Grafana Alert Documentation: Webhook Notifications
Add the following two entries to the alert.yaml file in the /etc/matrixdb/ directory: tts_template_code and region_id.
# aliyun service config
aliyun_service:
  access_key_id: “your access_key_id”
  access_key_secret: “ access_key_secret”
  signature: “signature”
  sms_template_code: “SMS_123445678”
  tts_template_code: “TTS_123456788”
  region_id: “cn-hangzhou”
The access_key_id and access_key_secret are shared with the information service. The tts_templatecode is a TTS voice template code that starts with “TTS” and has been successfully registered and approved in the Alibaba Cloud TTS Voice Service control panel. The original template text can be viewed on the Alibaba Cloud platform. The variable carrying the specific alarm information should be set to ${name}. Here is an example:
Dear Administrator, your company's database system has triggered a ${name} alert. Please log in to the website to view details and address the issue promptly.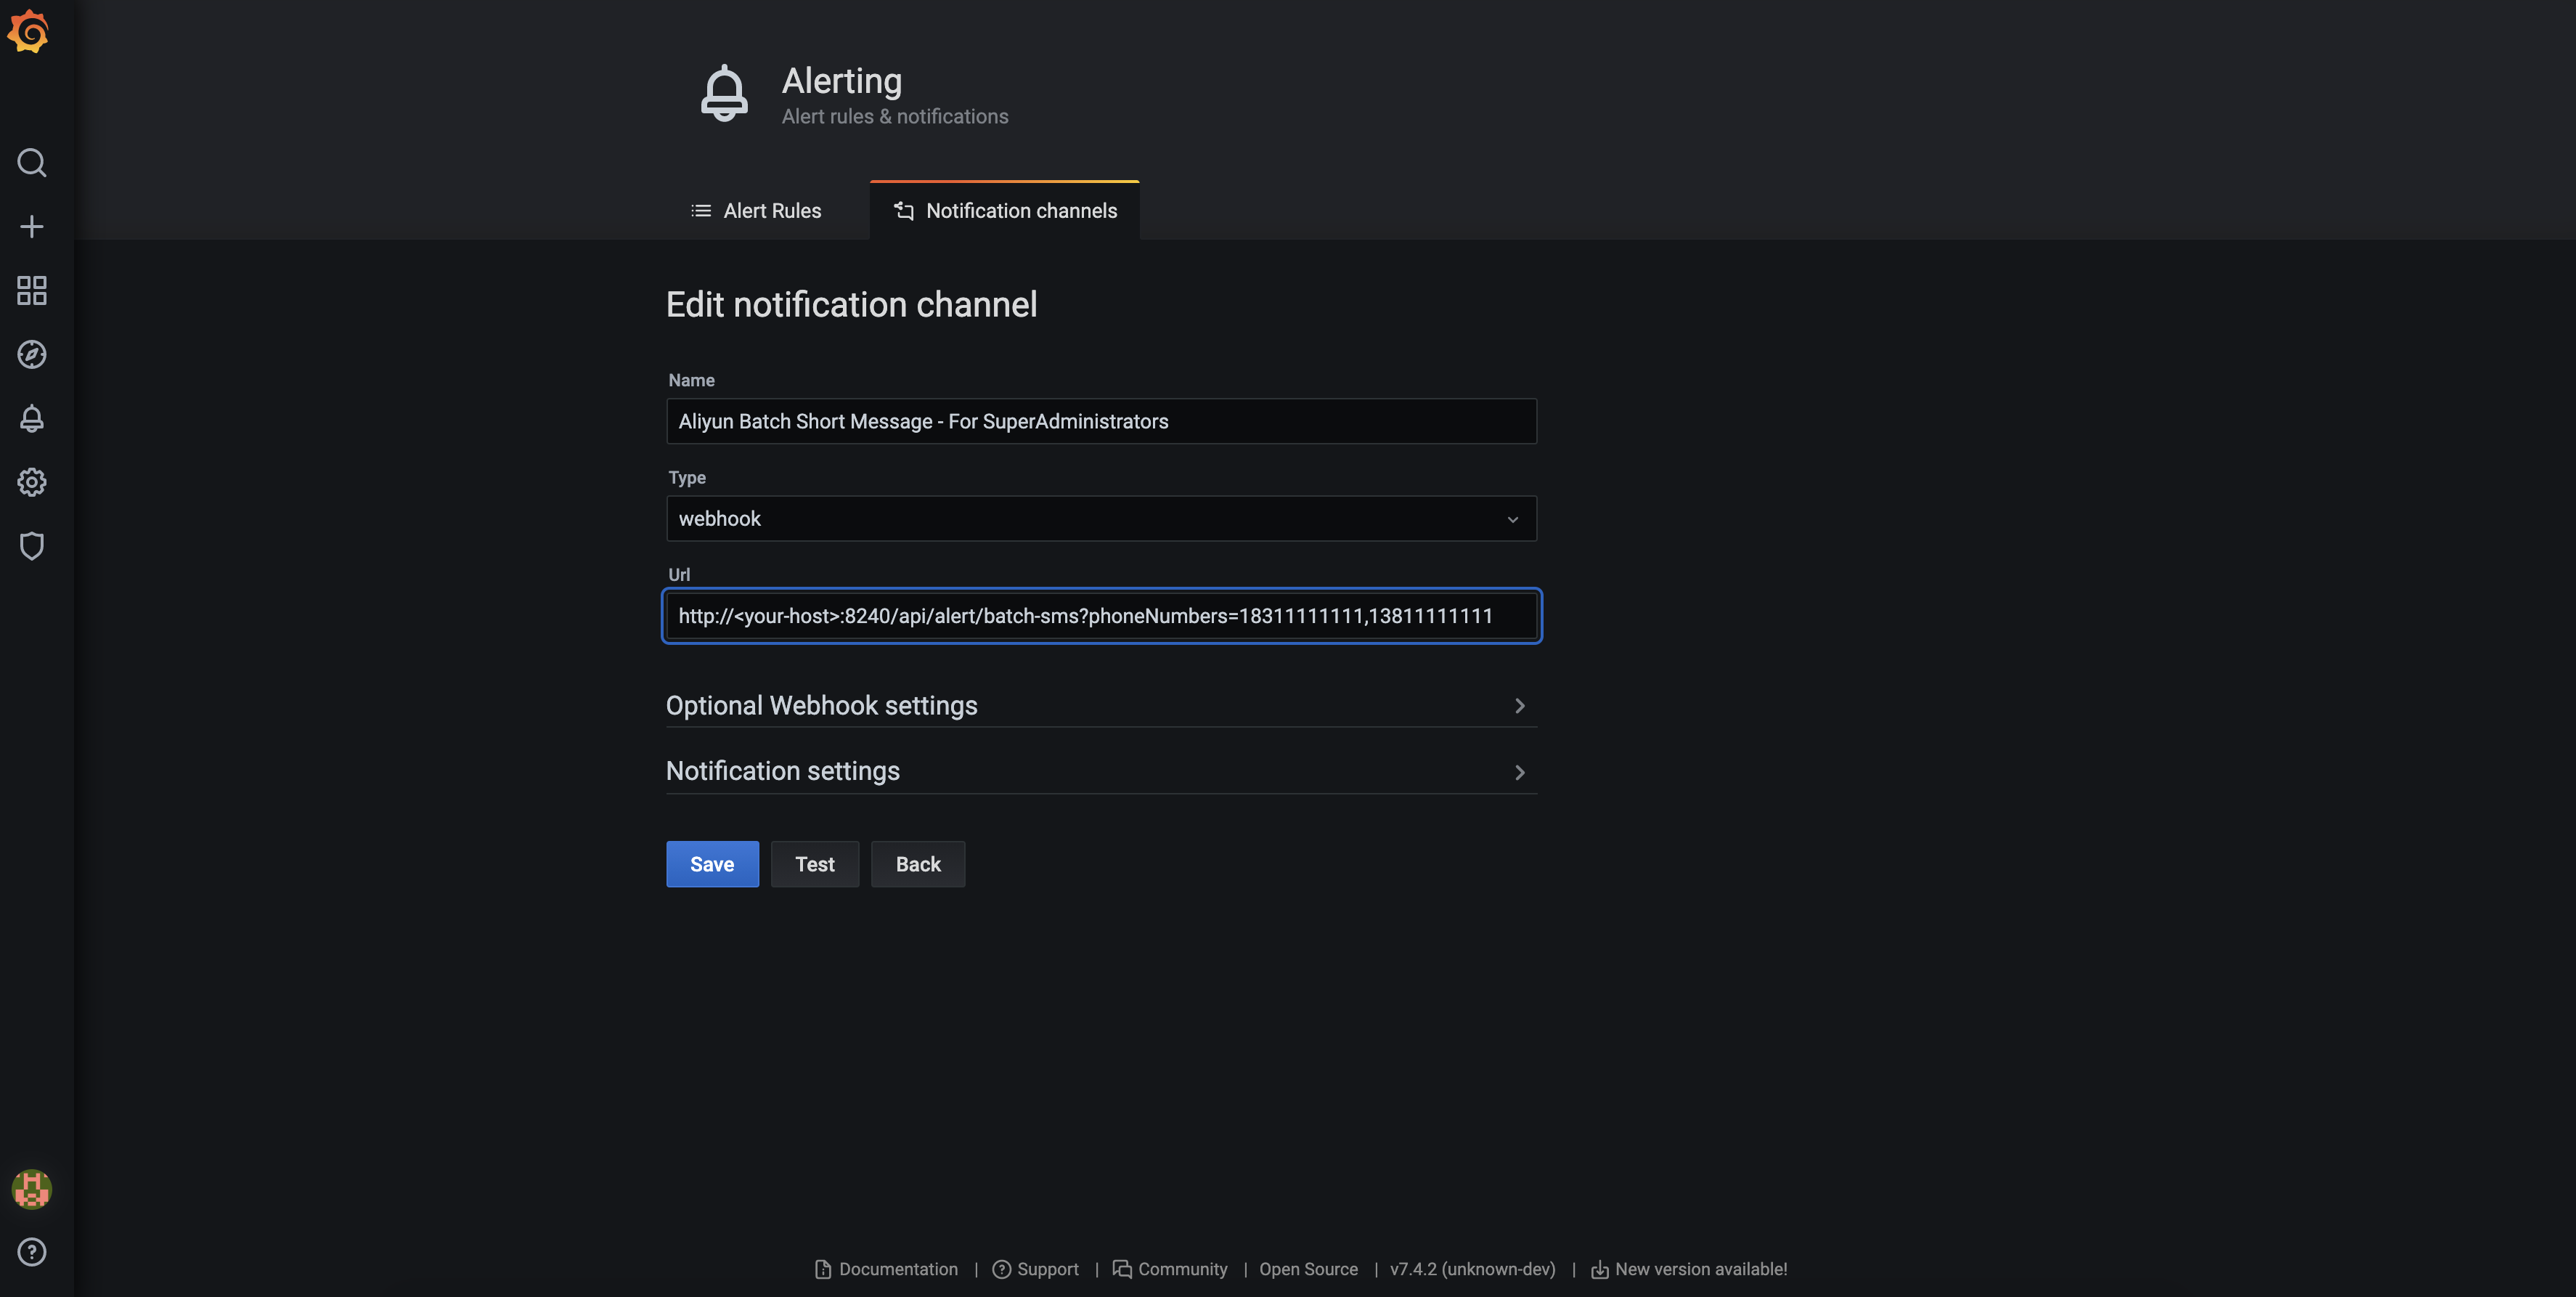 The channel name should follow the following rules:
Aliyun Voice Message - For SuperAdministrators
“SuperAdministrators” refers to a group of people who need to receive alert notifications. If you need to define another group of people who need alert notifications, you need to configure the rules separately. In addition, the “phoneNumbers” parameter is case-sensitive and can be configured with multiple numbers to achieve bulk sending, separated by commas.
http://
: /api/alert/vms?phoneNumbers=18311111111,13811111111
Grafana also has a built-in email alert channel, which is easy to configure and use.
Since email alerts are a built-in feature of Grafana, the SMTP server is configured in the Grafana configuration file. The Grafana configuration file may vary depending on the Grafana deployment. The default path on CentOS 7 is:
/etc/grafana/grafana.ini
For more information, please refer to: Grafana Official Documentation: Configuration
We have prepared a possible configuration for you:
#################################### SMTP / Emailing #####################
[smtp]
enabled = true
host = <your smtp host>
user = <your user>
# If the password contains # or ; you have to wrap it with triple quotes. Ex """#password;"""
password = <your password>
;cert_file =
;key_file =
skip_verify = true
from_address = <your email address>
from_name = Grafana
;ehlo_identity =
;startTLS_policy =

[emails]
welcome_email_on_sign_up = false
templates_pattern = emails/*.htmlAs shown in the figure:
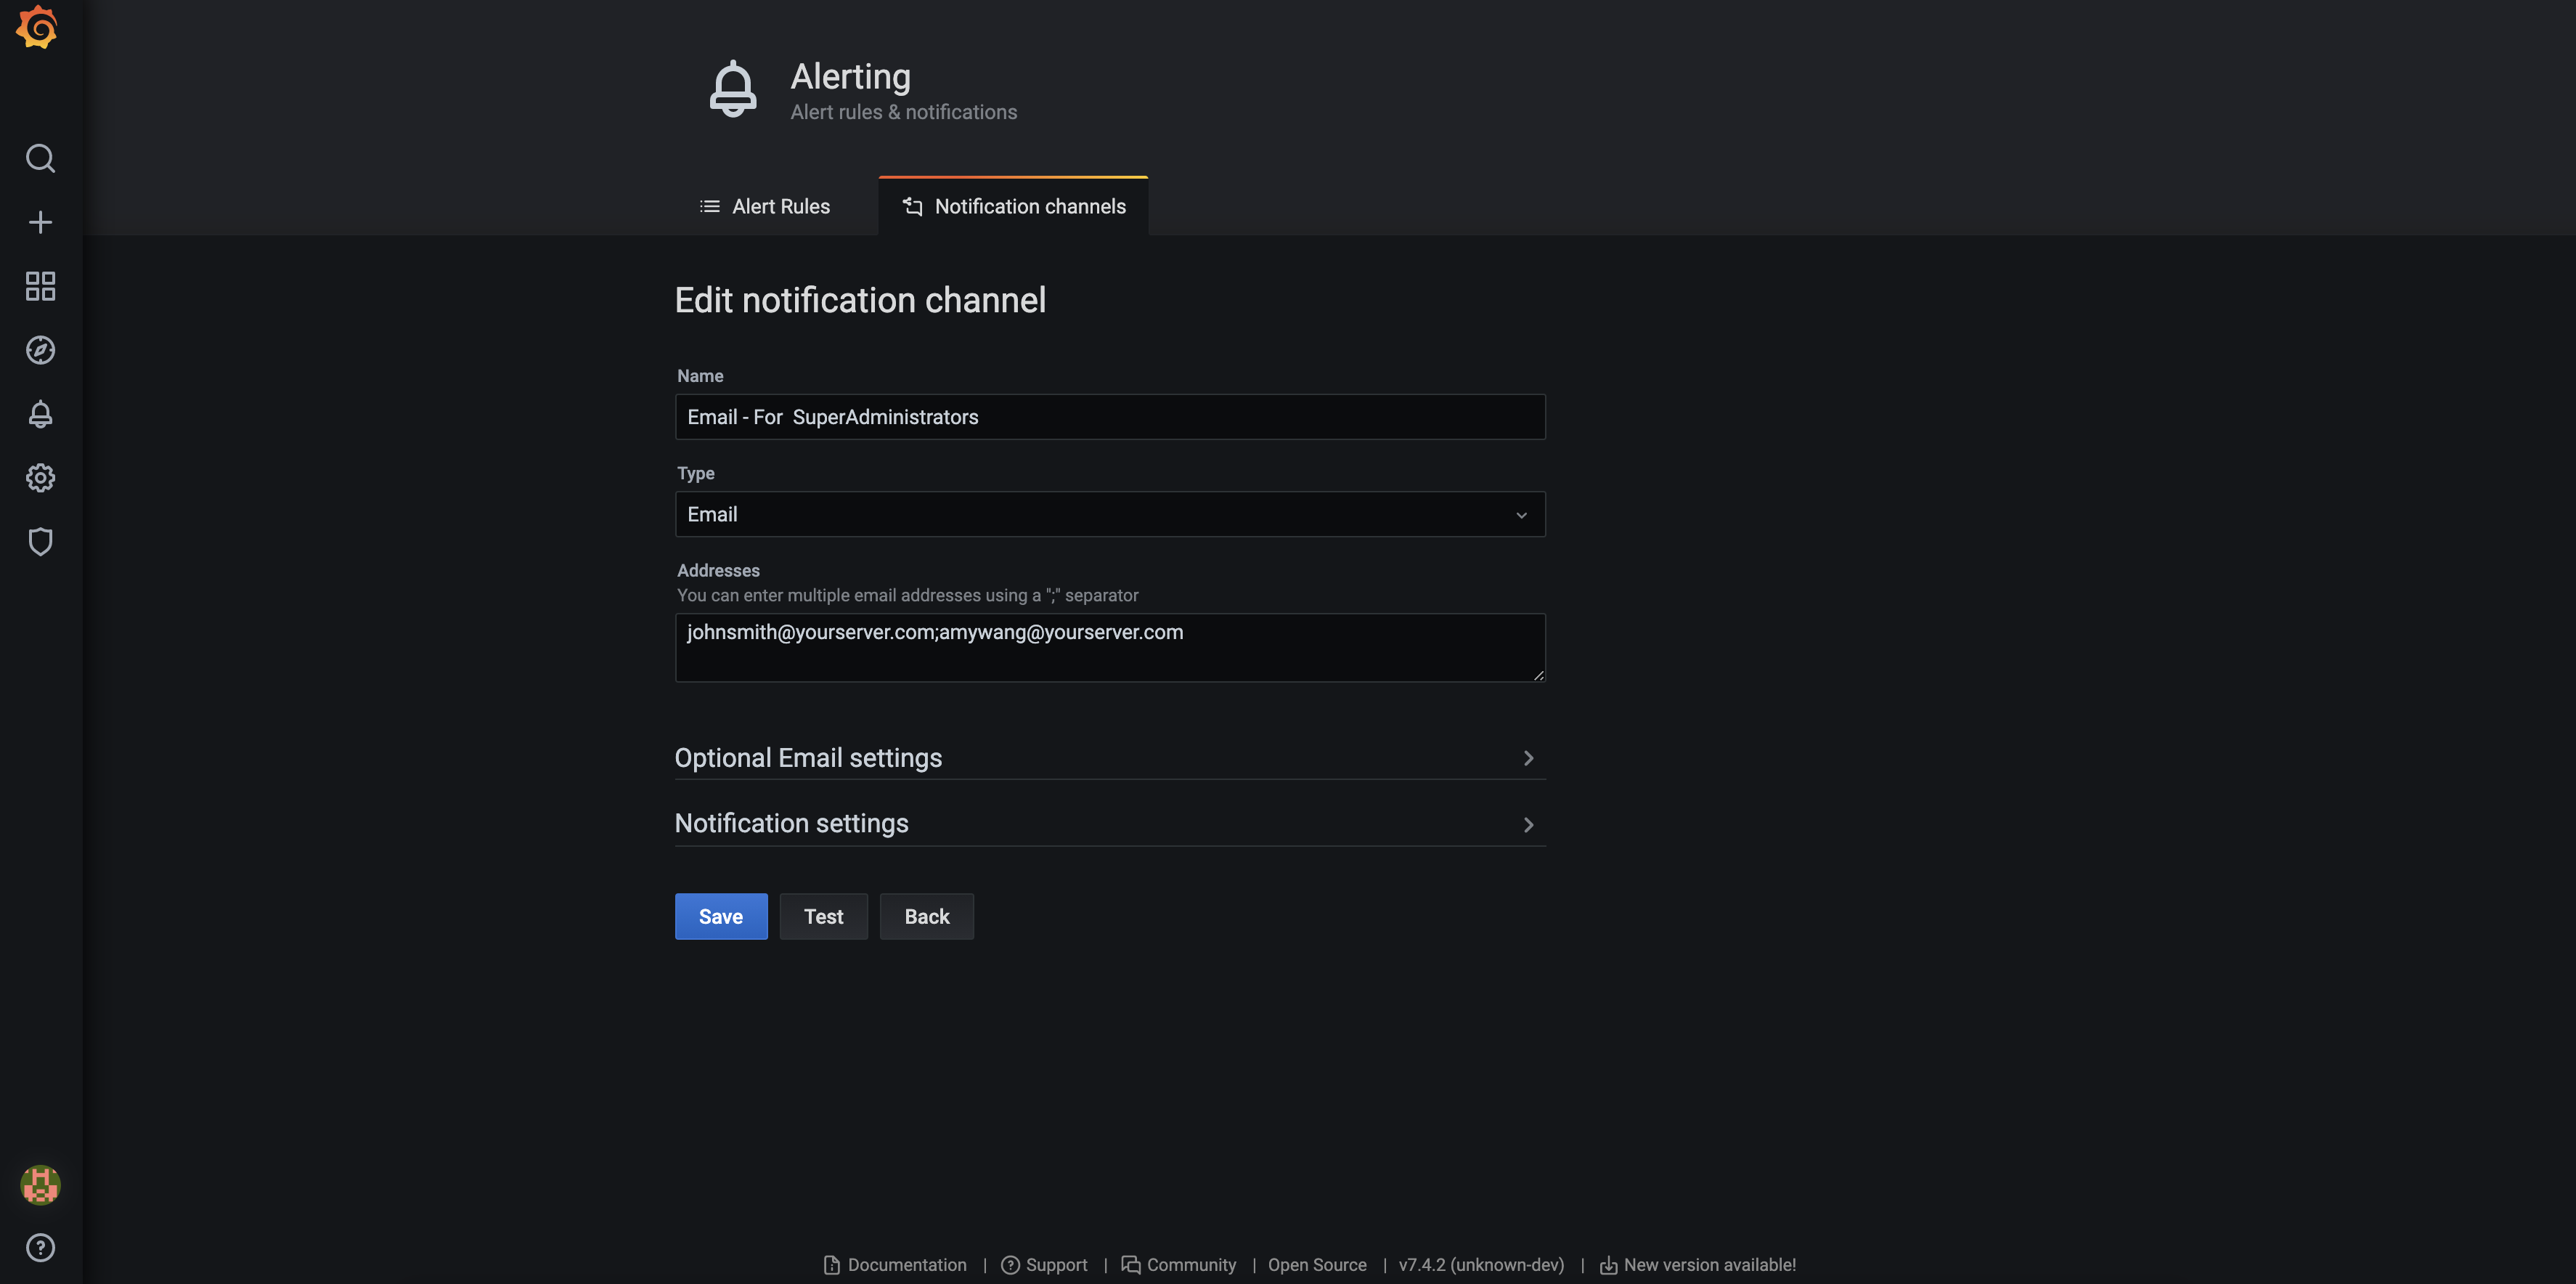 It is recommended that channel names follow the following rules:
Email - For SuperAdministrators
Where “SuperAdministrators” is a group of people who need to receive alert notifications. If you need to define another group of people who need alert notifications, please configure the rules separately.
Notes!
If the configuration is unsuccessful, you can check the reason in the/var/log/grafana/grafana.logfile.
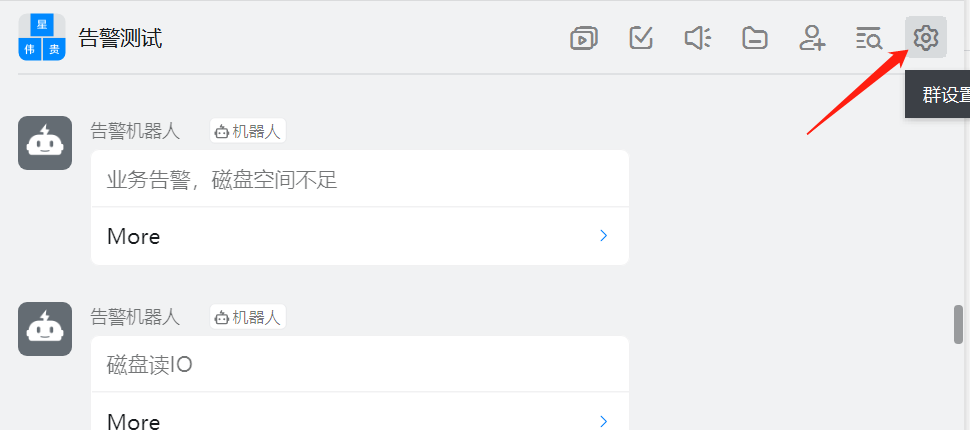
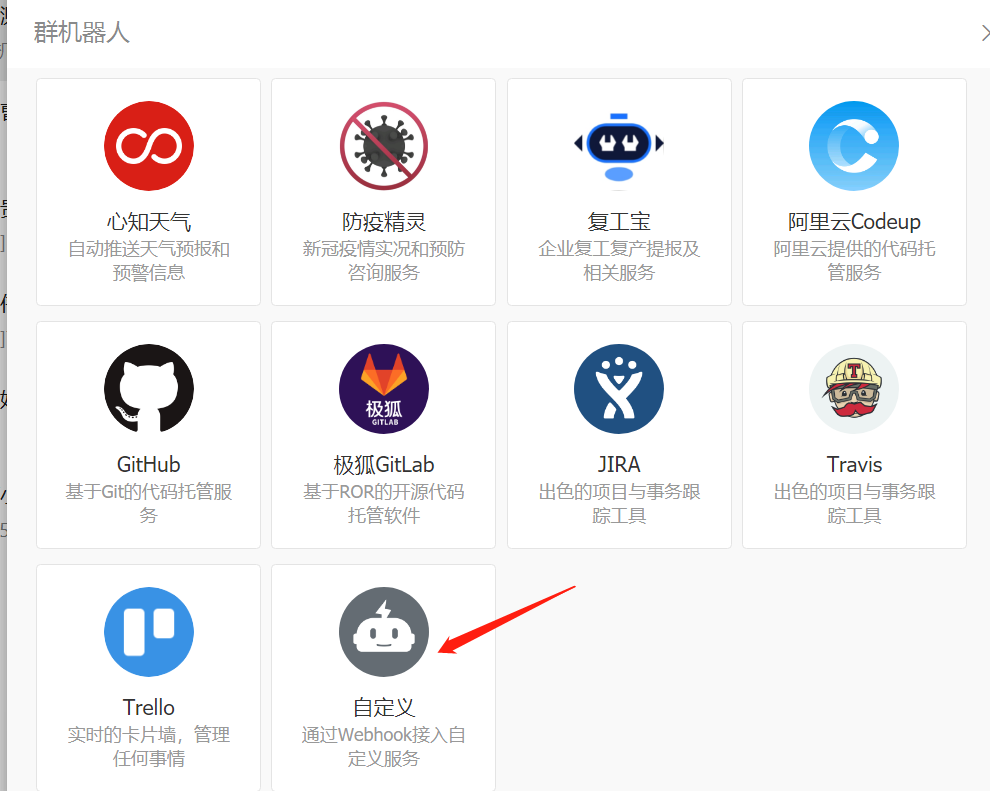
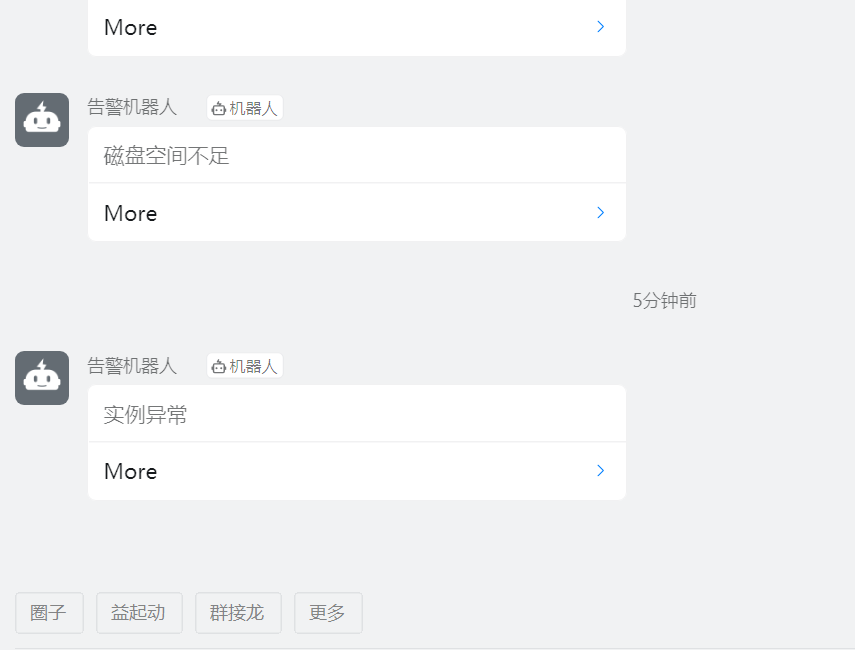
YMatrix provides DingTalk-based alert functionality. When an alert is triggered, the alert robot you have set up in advance will send a notification message to the group. To make full use of this feature, you need to configure both the DingTalk software and the Grafana interface in advance.
As shown in the figure: You need to create a DingTalk group and configure one or more DingTalk alert robots.

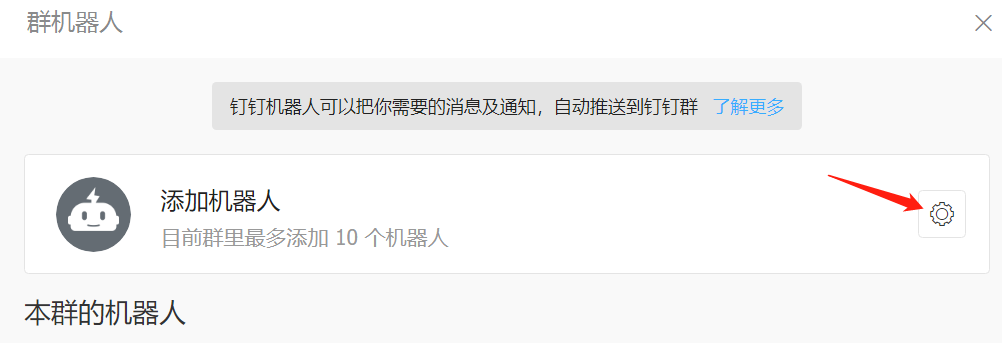
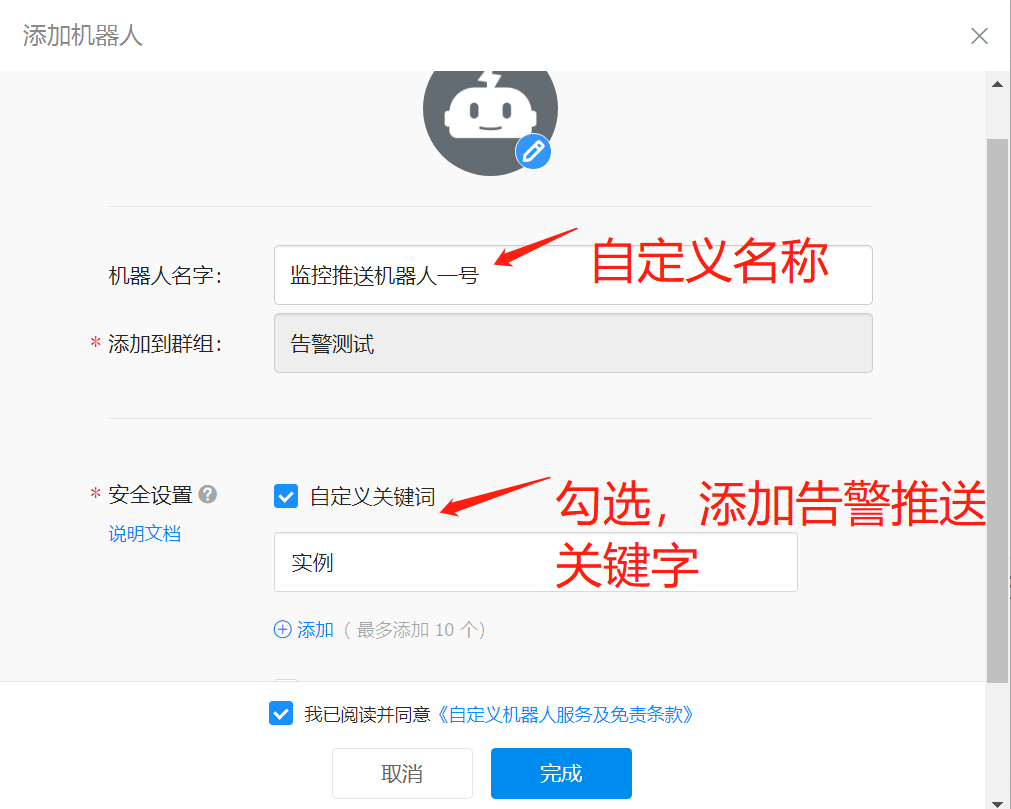
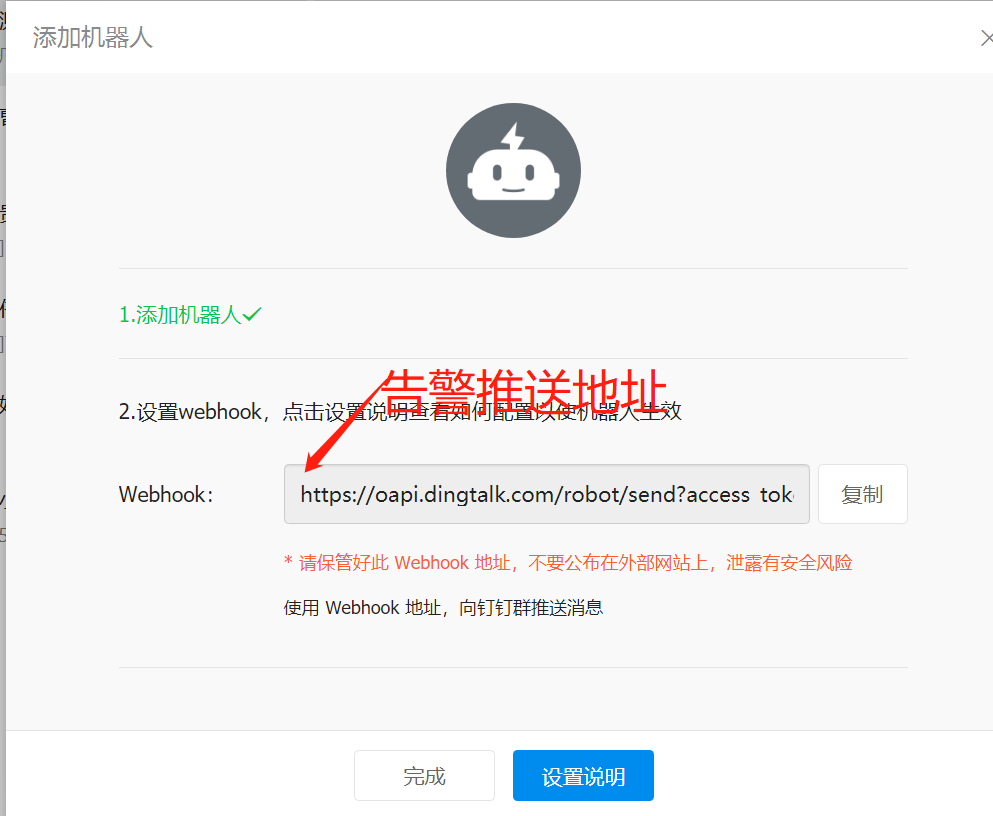
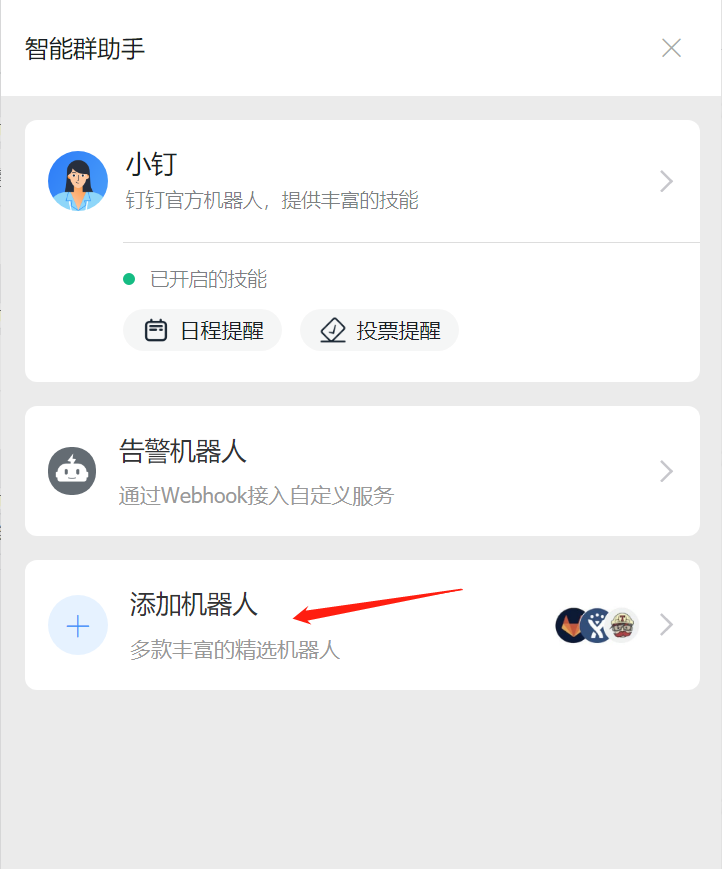 In the “Add Robot” interface, click the settings button, select “Customize,” and you can customize the robot name and add alarm push keywords. Finally, save the alarm push address.
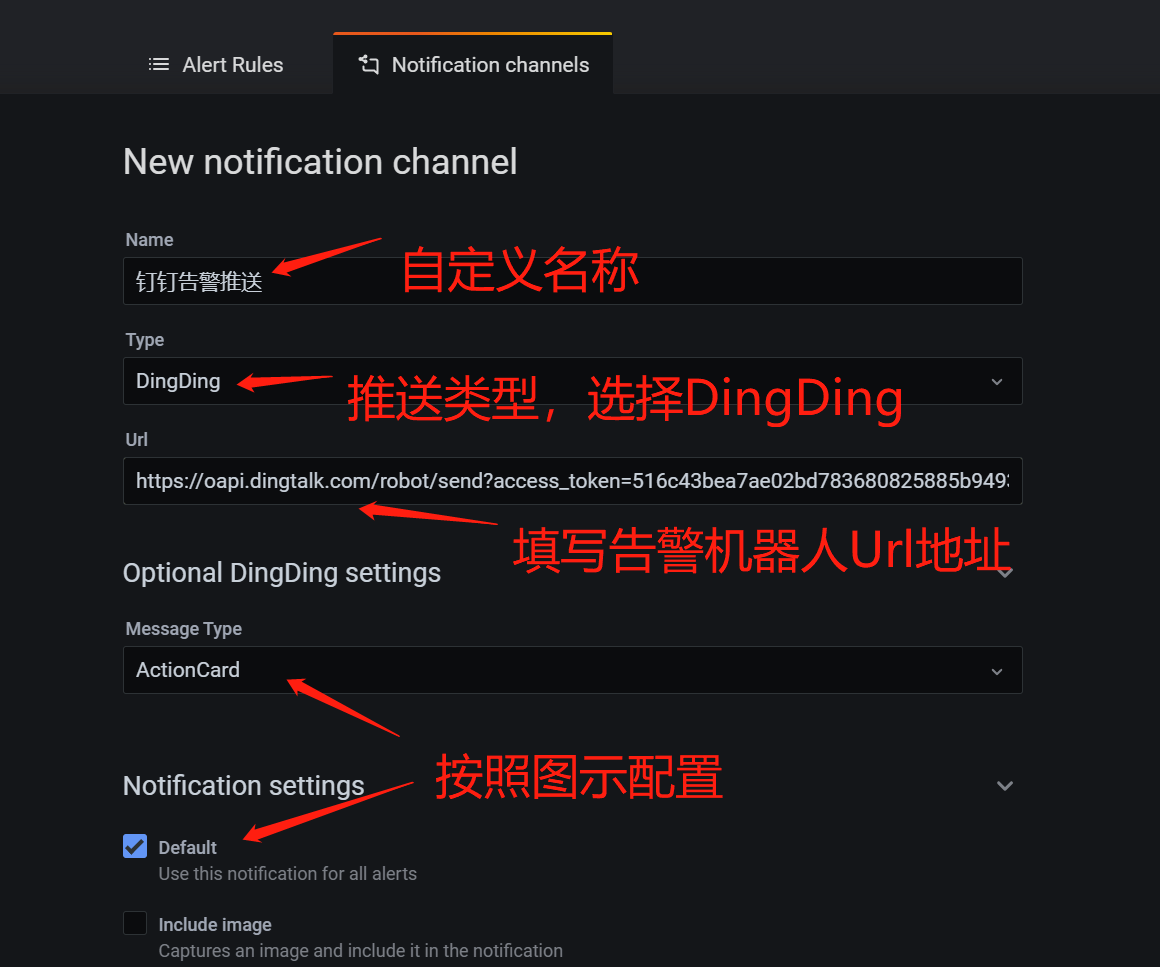
First, you need to create a push rule in the Grafana interface and fill in the relevant options.
 After configuration is complete, click “Test” to verify connectivity between Grafana and DingTalk. If connectivity is established, you can click on relevant alert information within the DingTalk alert group to navigate to the Grafana interface. If the webpage fails to load and displays the error “localhost has refused our connection request,” you may have forgotten to modify localhost to your IP address.
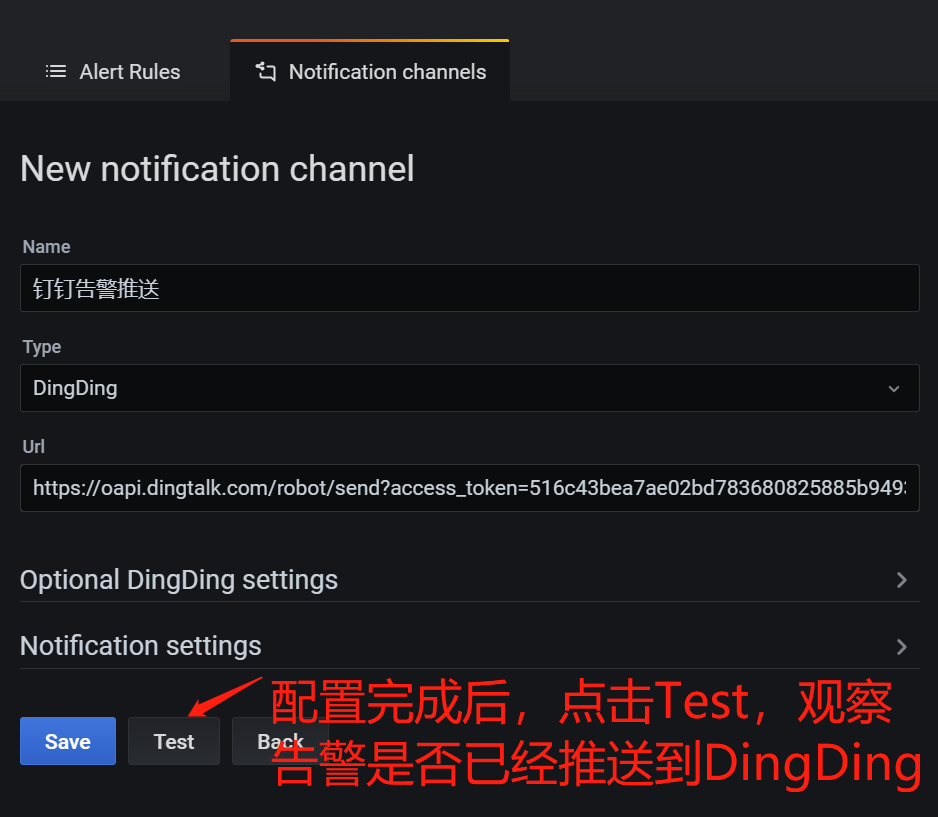
After configuring the alert channels, you need to configure the alert parameters for each monitoring alert view. For parameter configuration and other information, please refer to: Grafana Official Documentation: Alert
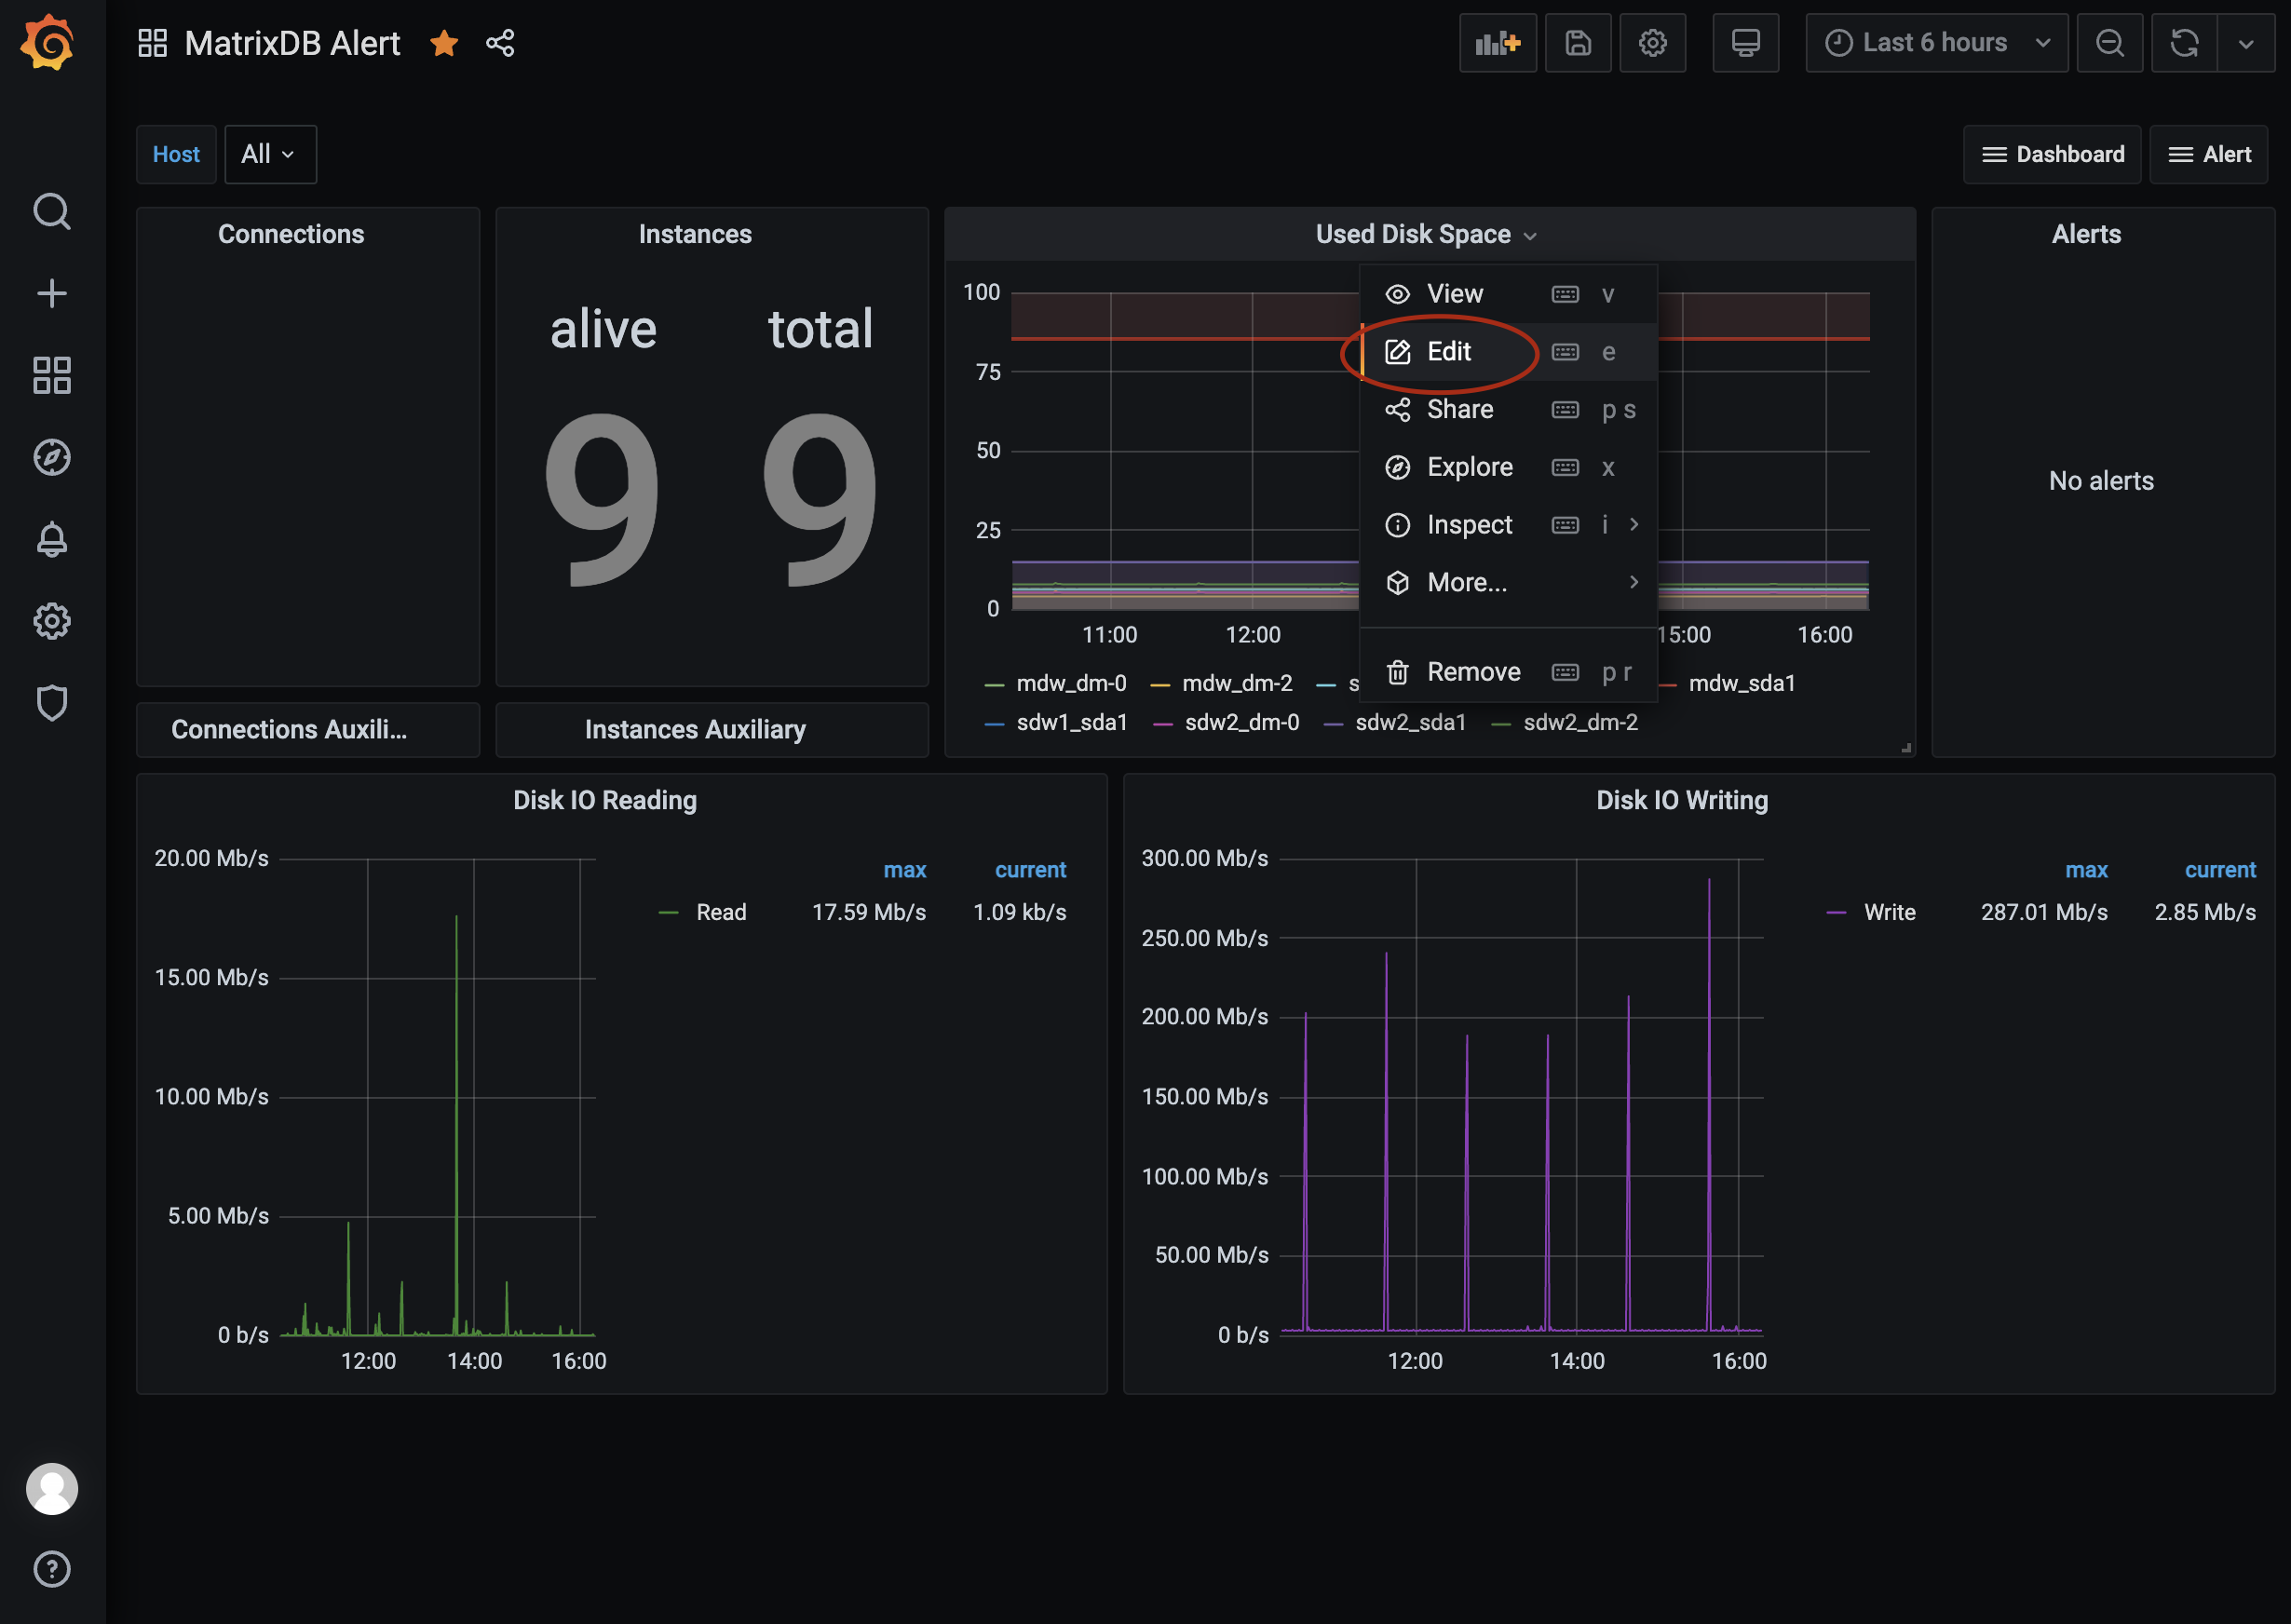
Hover your mouse over the specific alert module name, and you will see a dropdown arrow to the right of the name. Click “Edit” to enter the edit panel.
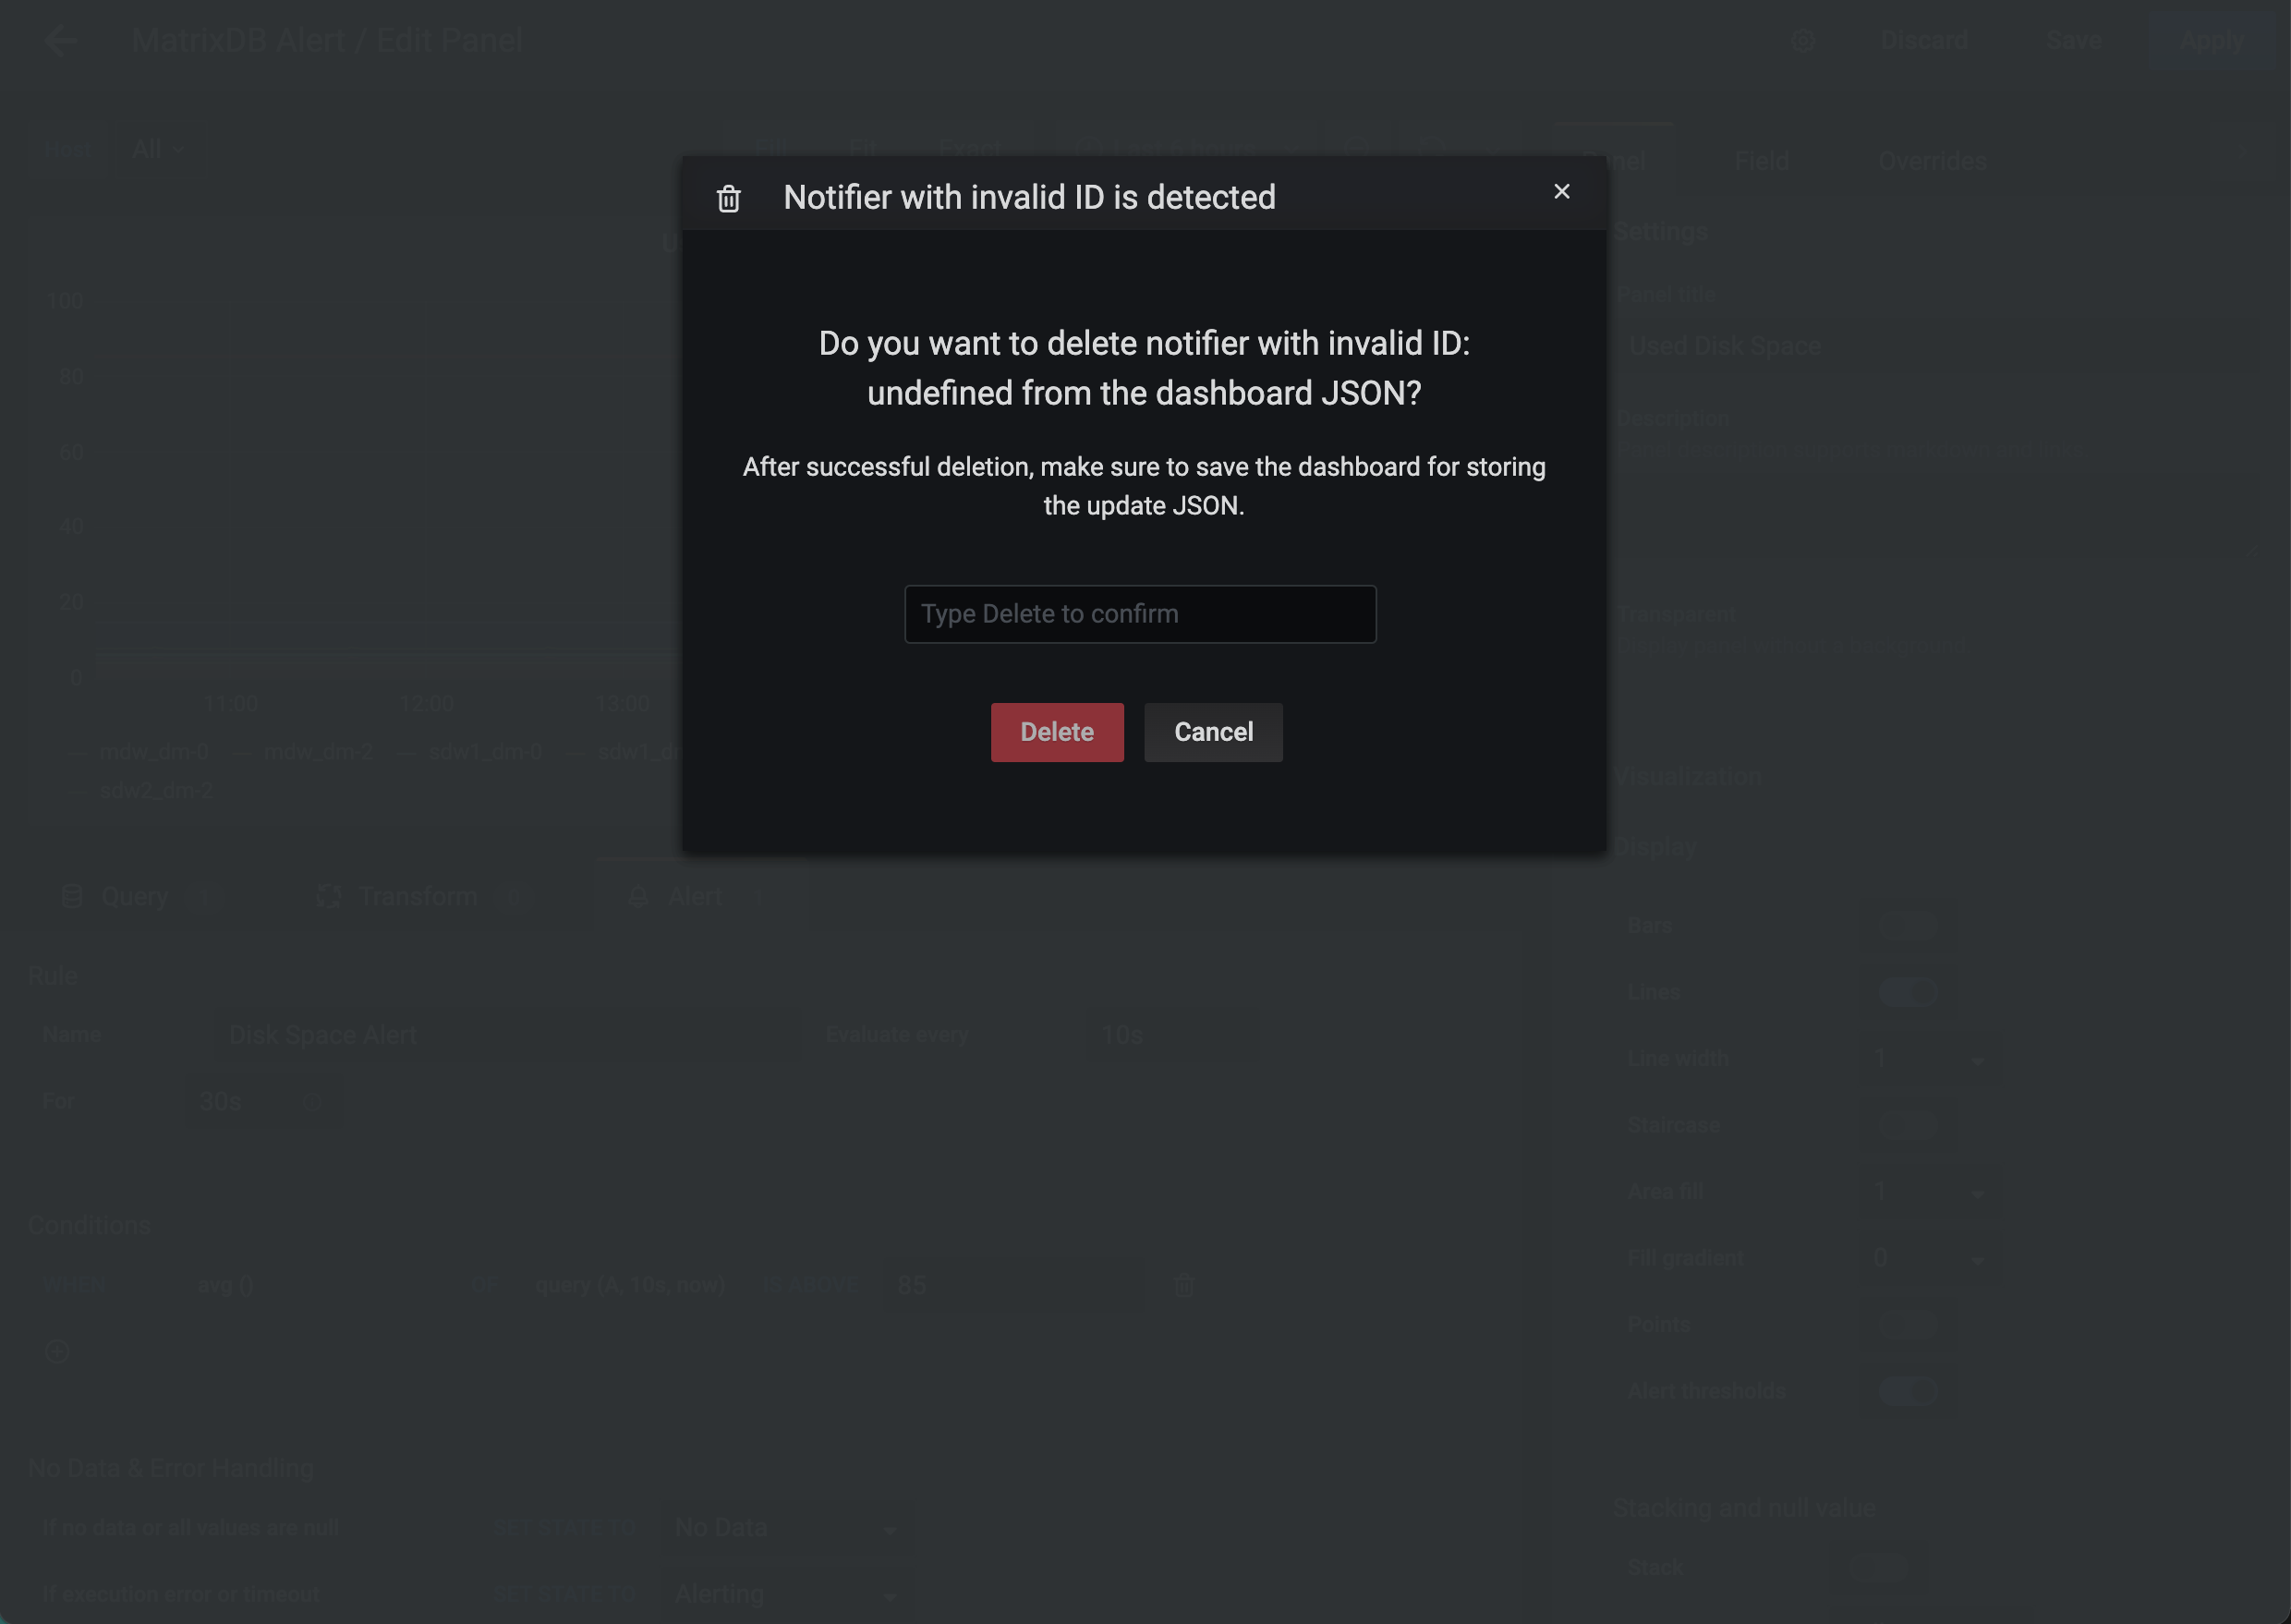
Switch “Query” under “Edit Panel” to the ‘Alert’ menu. Notes If a window pops up saying “Notifier with invalid ID is detected,” do not click “Delete,” otherwise you may delete the panel and lose all your work. Click “Cancel” and close the window.
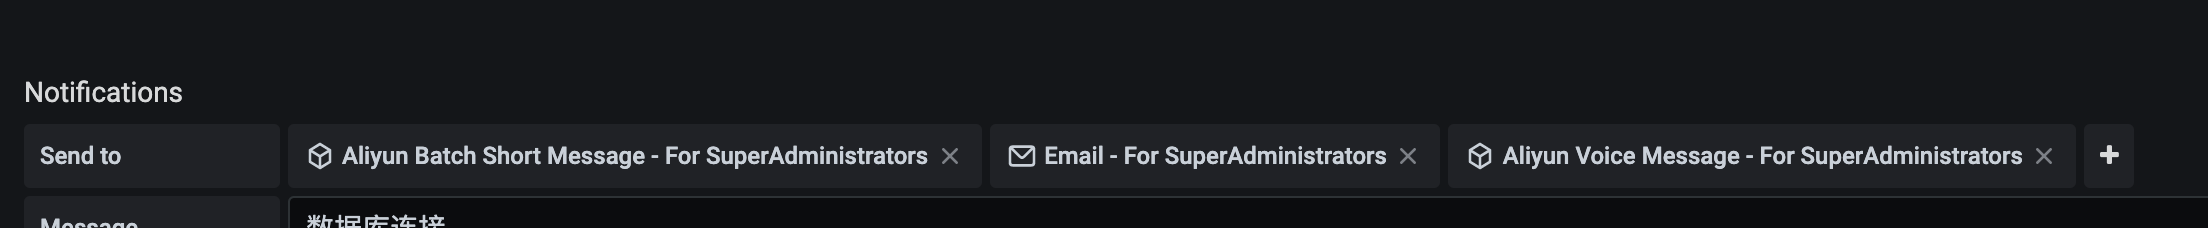
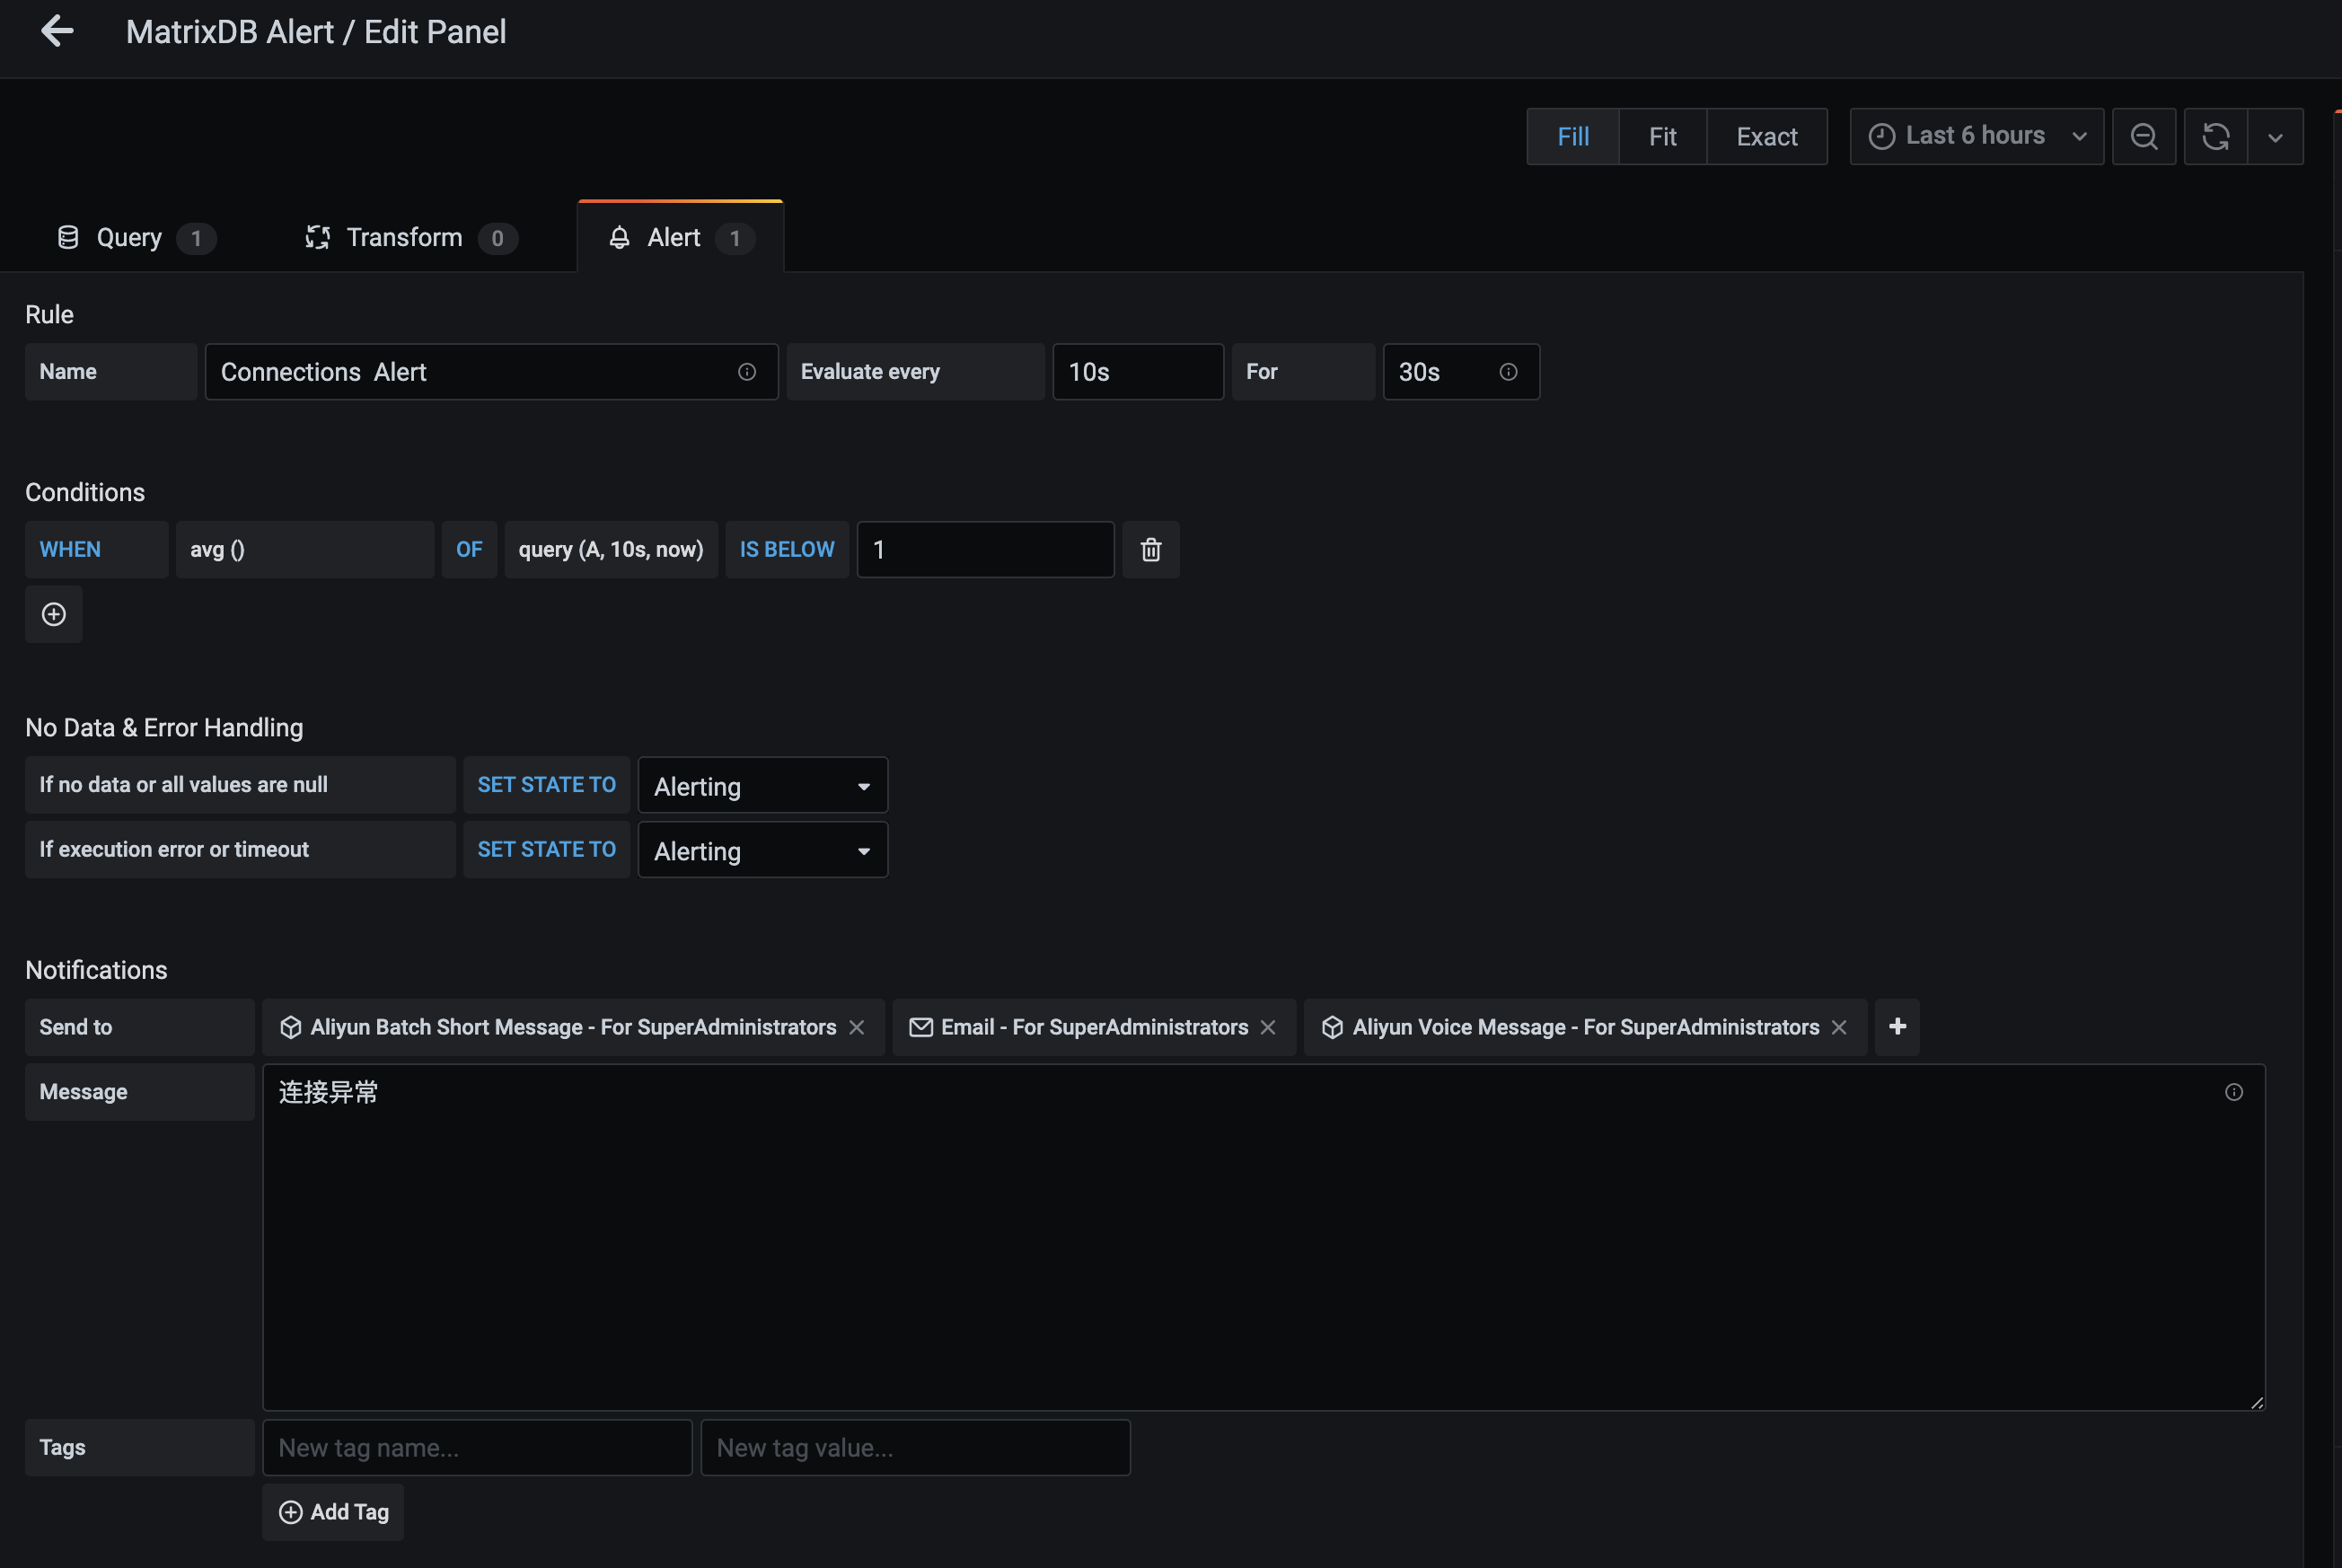
Scroll down to see “Notifications.” Use a concise phrase to describe the alert notification. We recommend 4–6 characters. This phrase will appear in the email and be sent to the administrator as a built-in variable in the SMS and voice templates. SMS and voice messages have character limits, so do not exceed the length. Additionally, flexibly select the “Send to” options based on your needs, i.e., the one or more alert channels you just configured through the above detailed instructions.
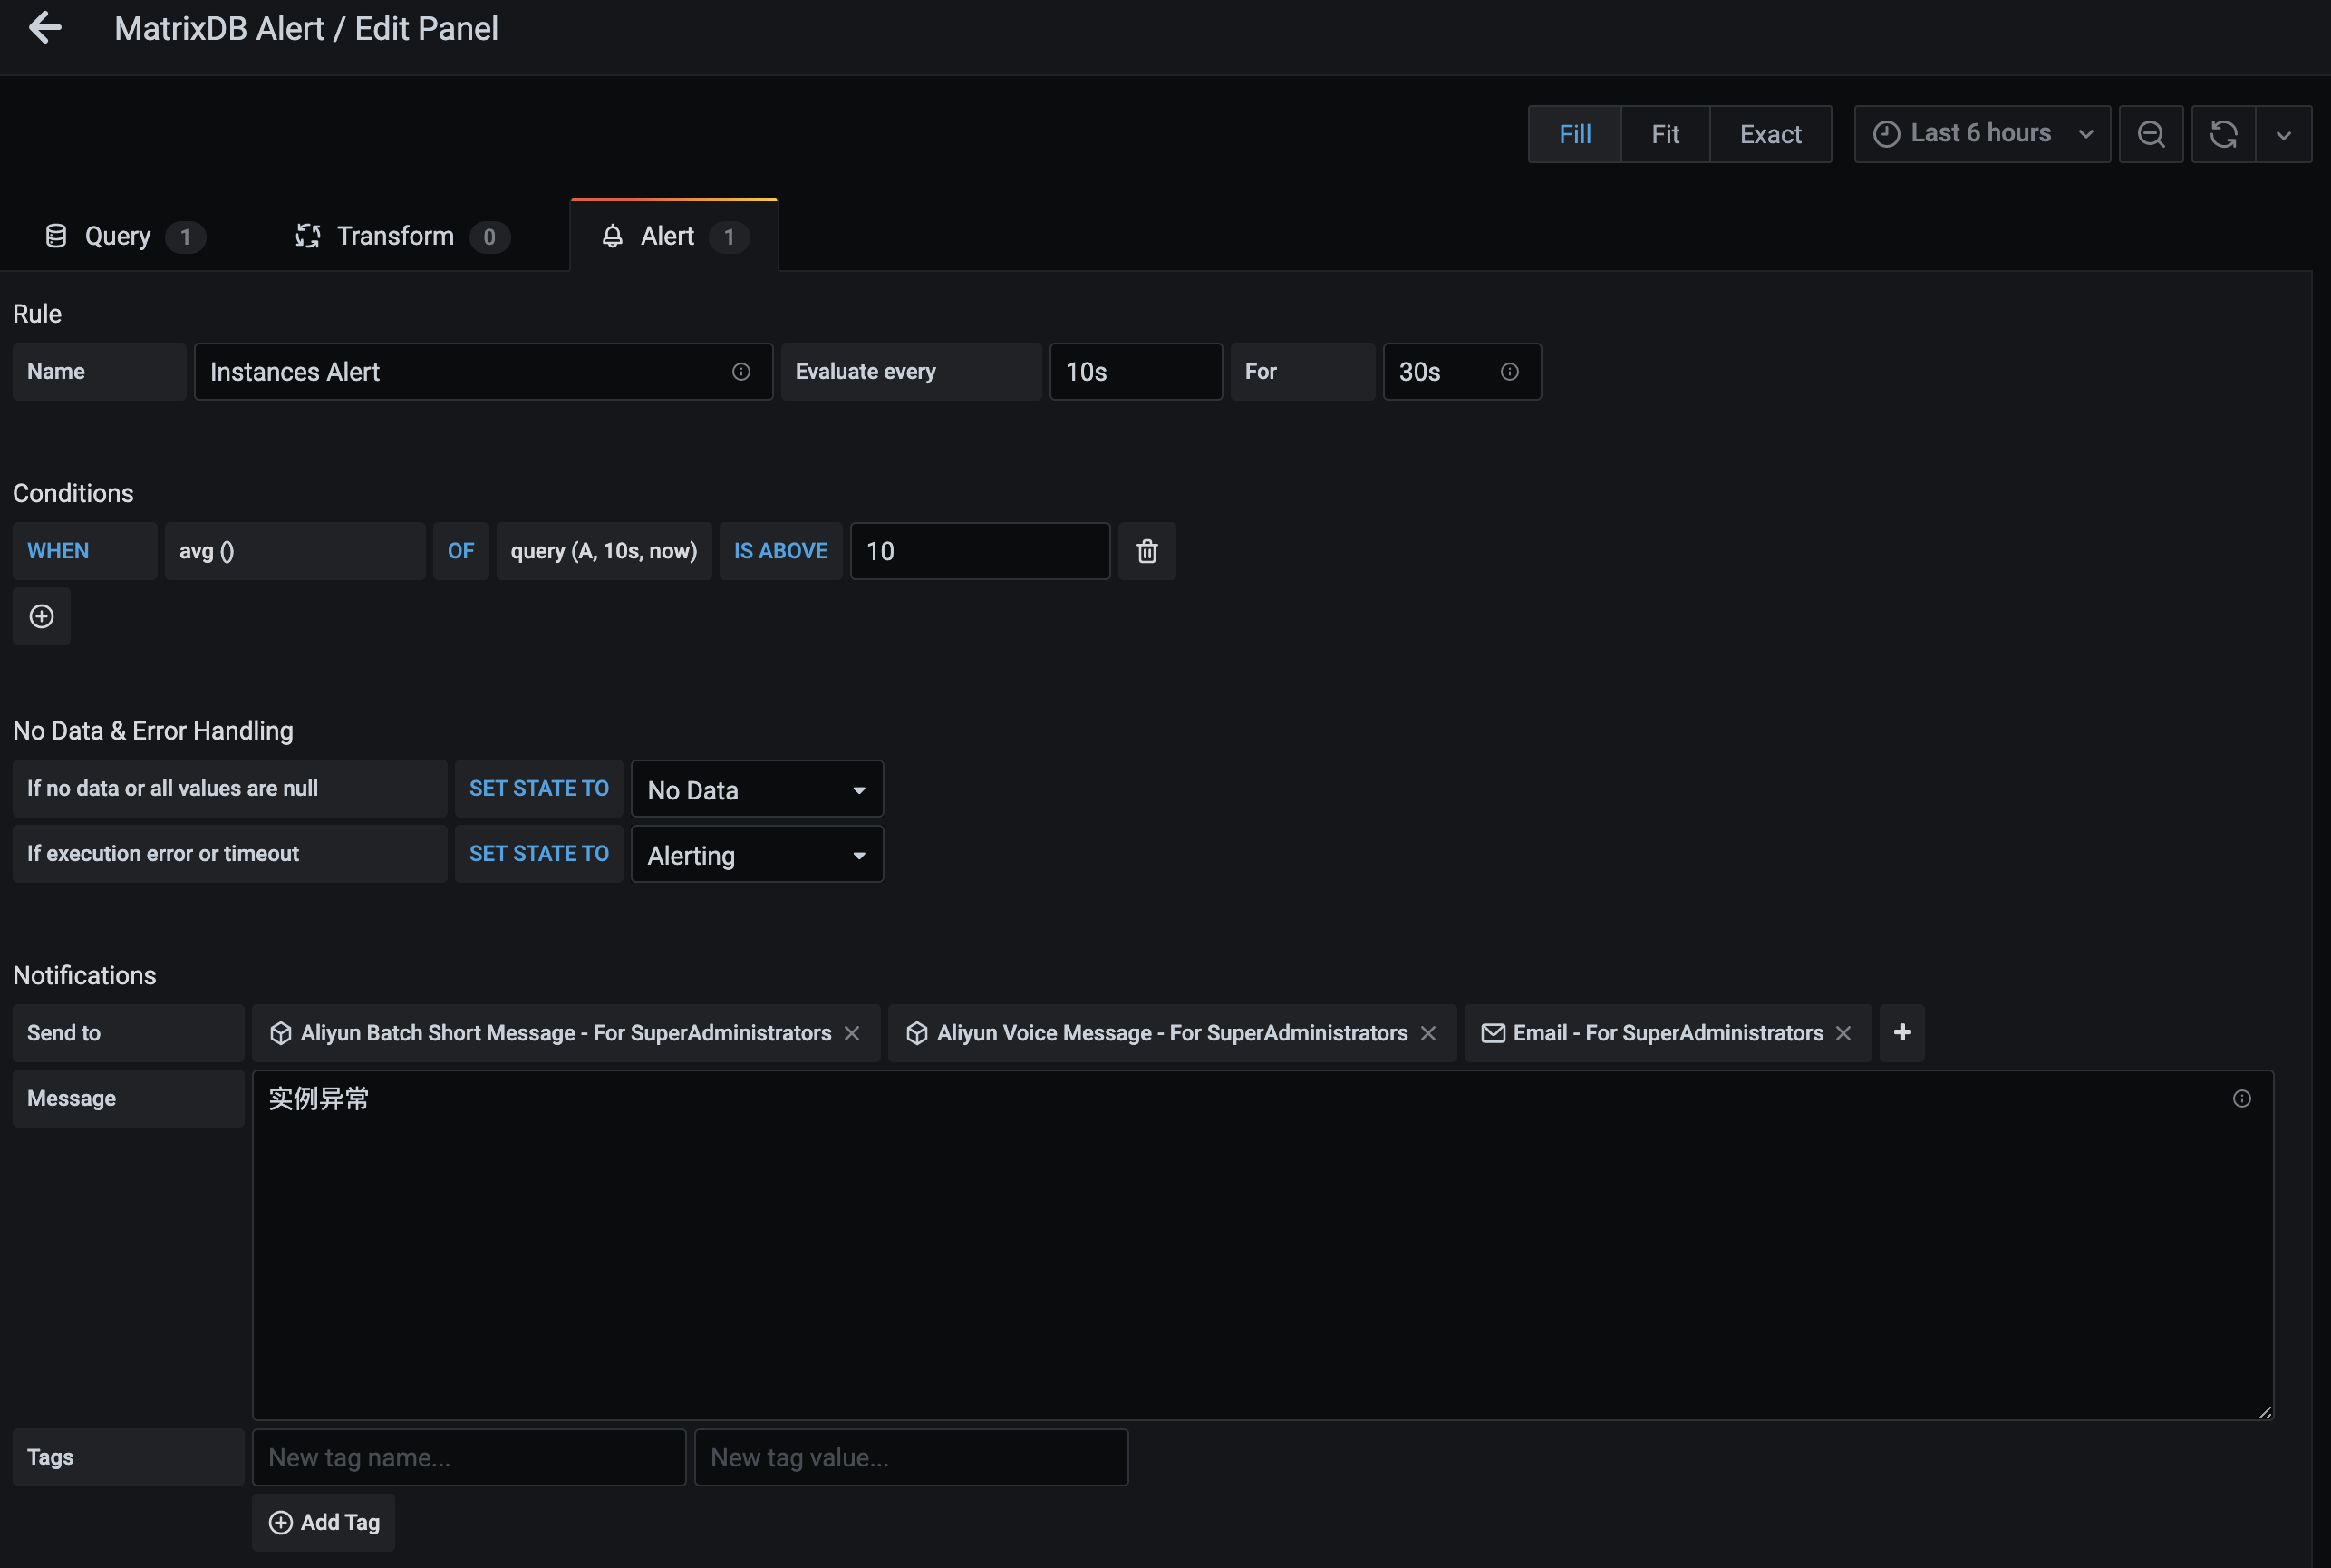
A time-series database aggregates data over a period of time. Due to timing issues, data may not be obtained during aggregation. For example, if Grafana's time is five minutes ahead of the system time and the latest minute's data is aggregated, this situation may result in no data being available. Additionally, issues with data collection, such as data not being properly written to the database, can also lead to “No Data” scenarios. The handling of the “No Data” scenario is “Alerting.”
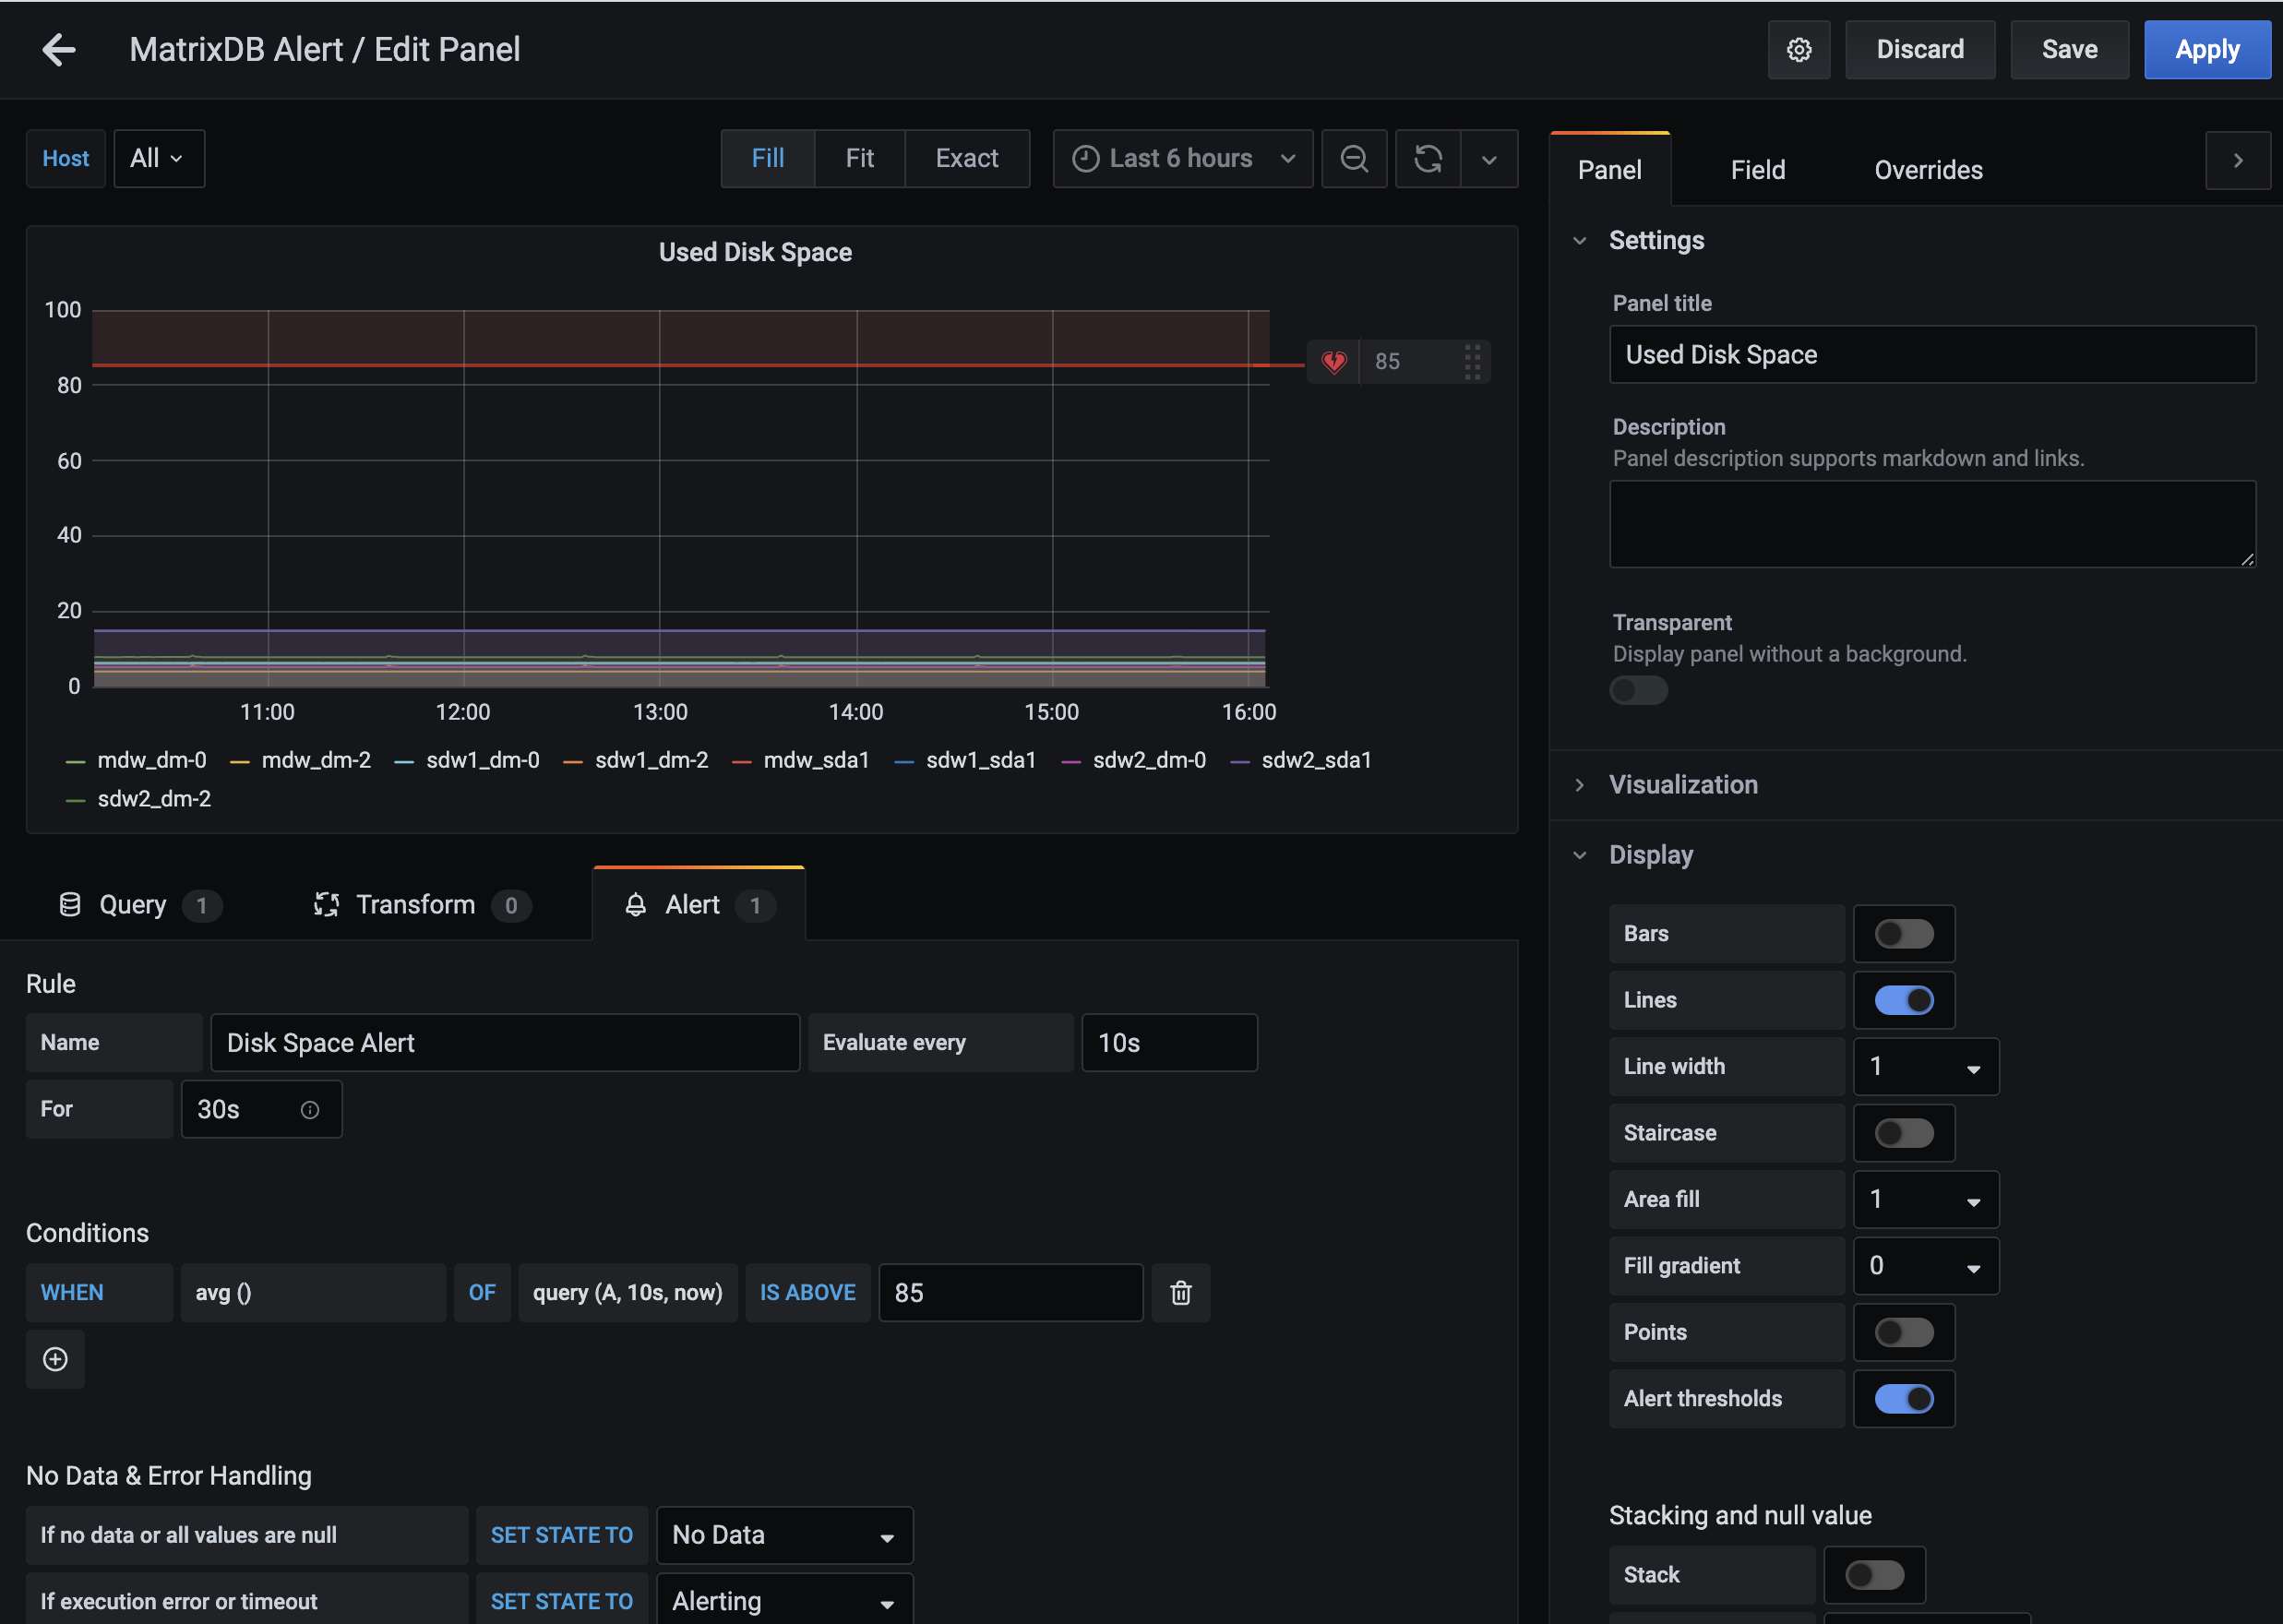
As shown in the figure:
The red warning line for disk space alerts (Used Disk Space) is the trigger value for the alert settings. The red shaded area indicates that the value has exceeded the warning line, which is a danger signal. We provide a default alert value of 85%, but you can also customize “IS ABOVE” according to your needs.
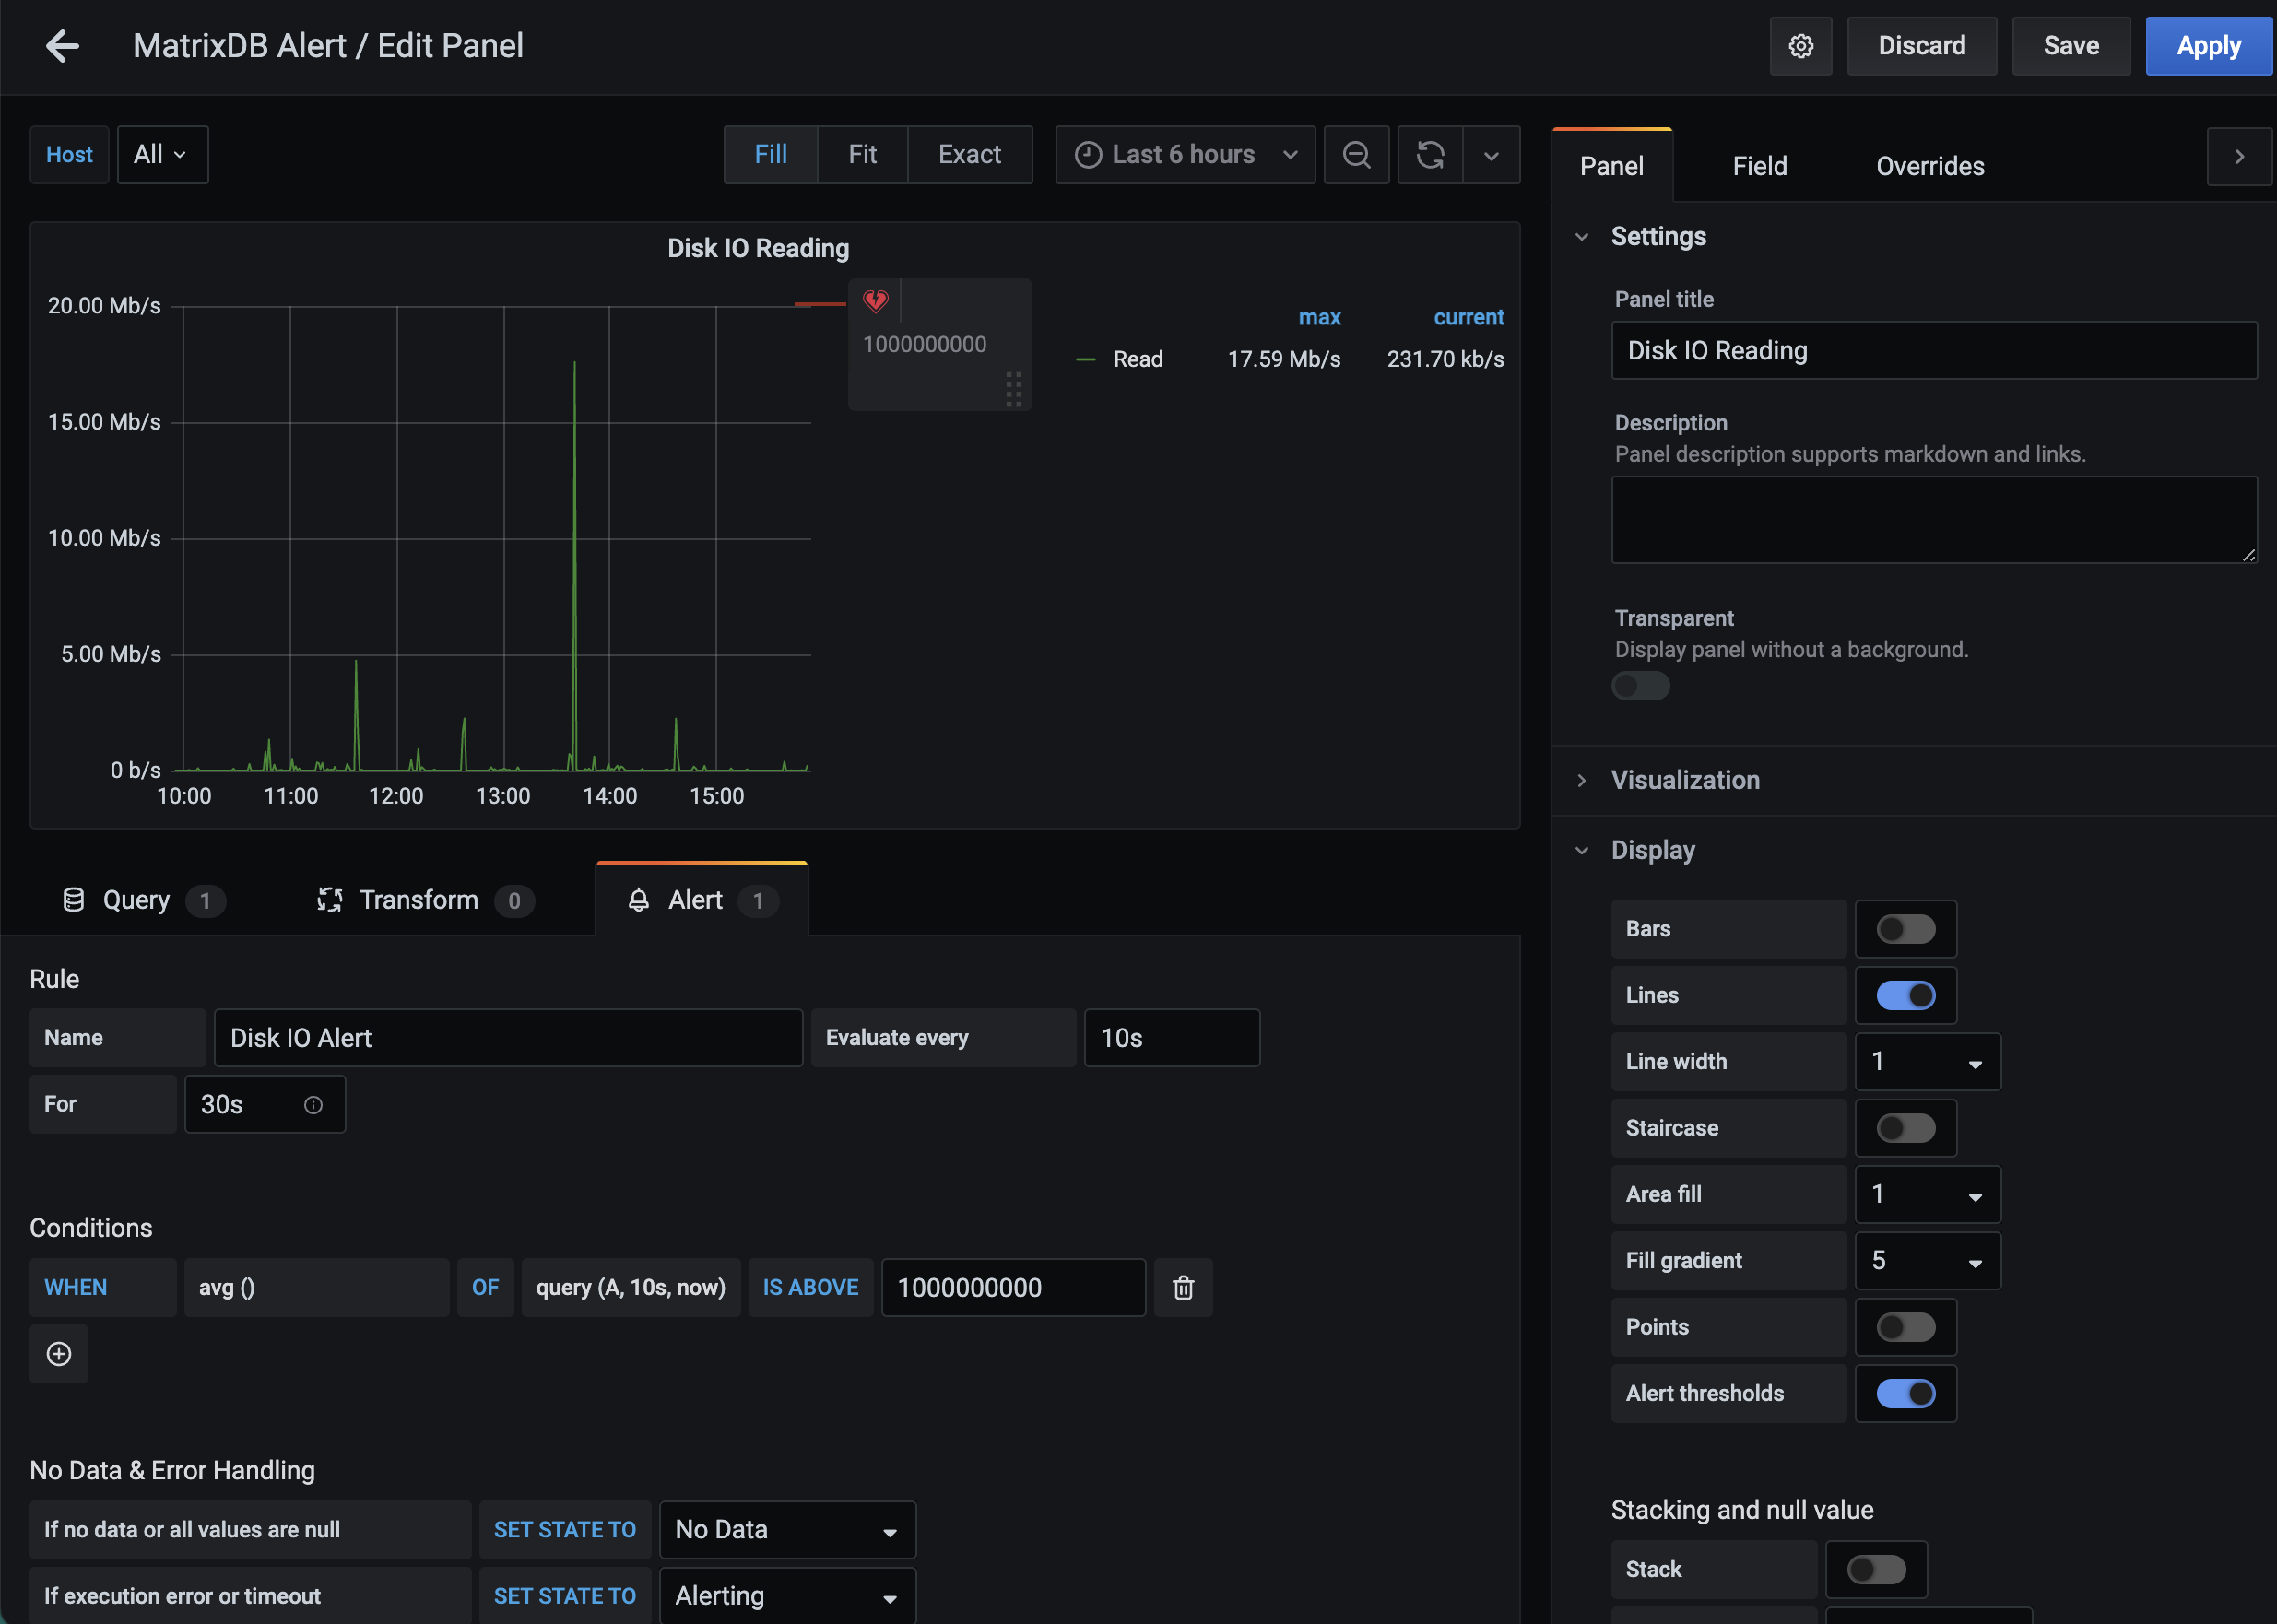
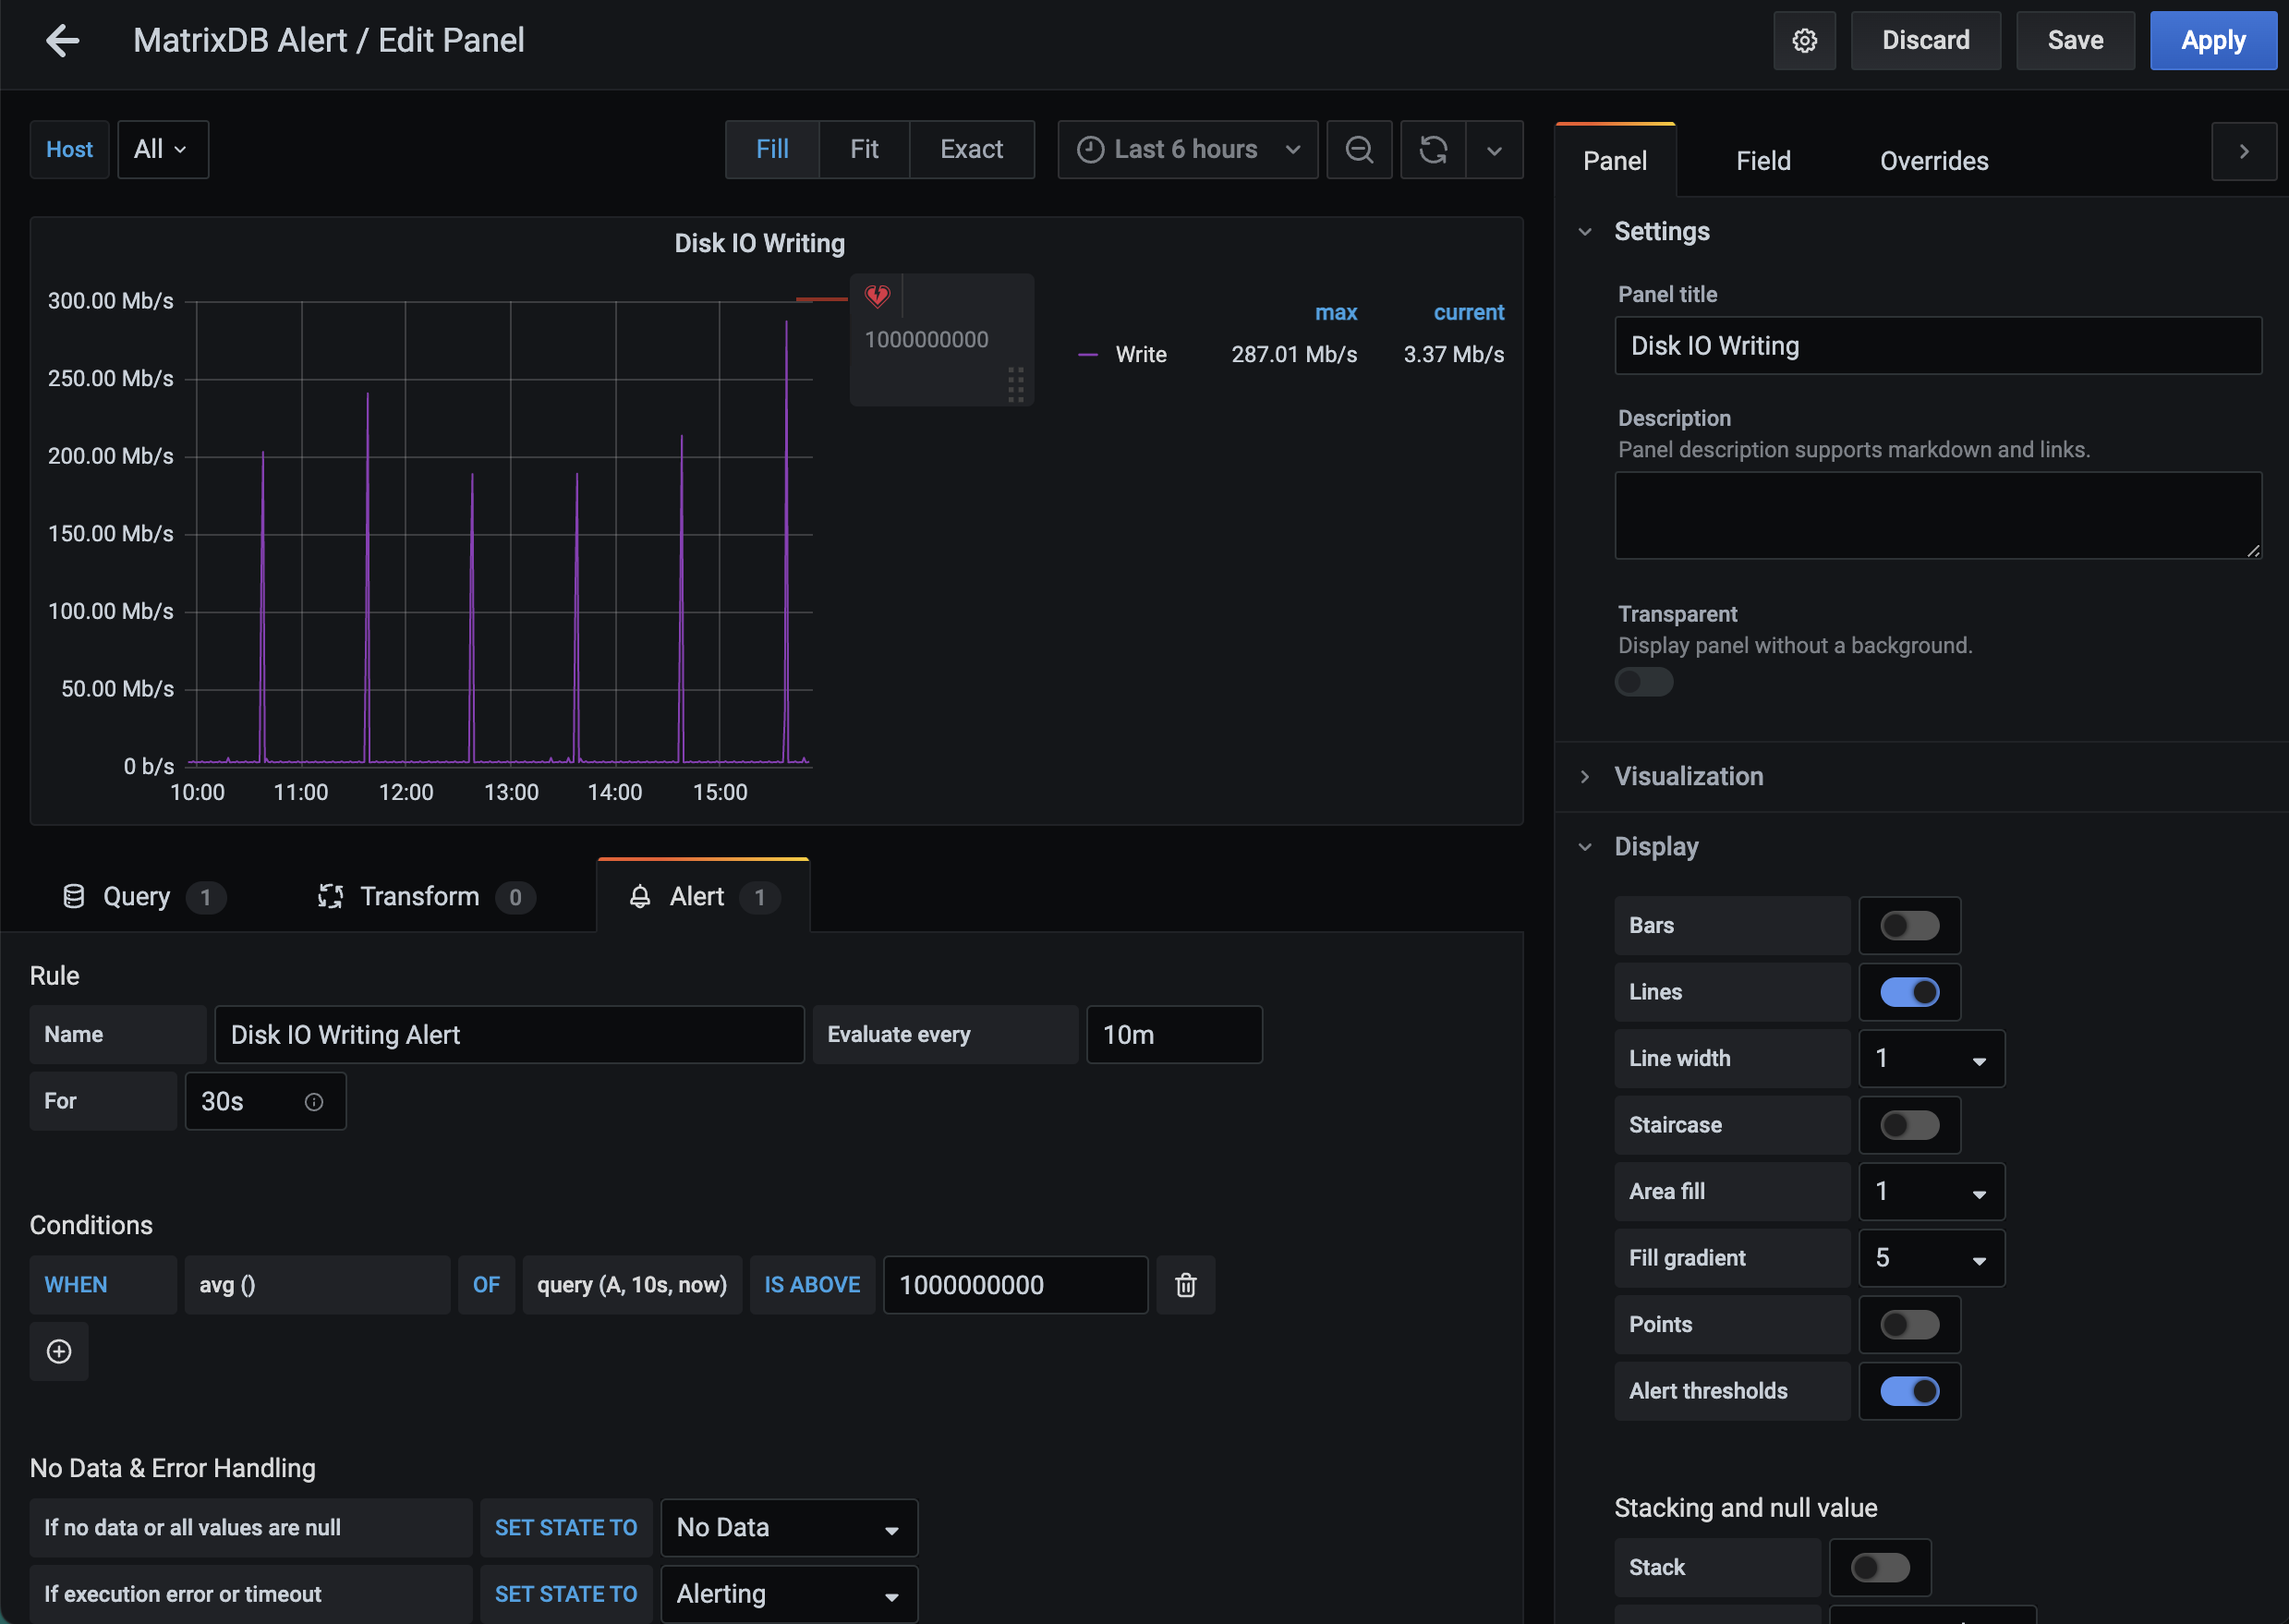
Disk IO Read and Write Alerts (Disk IO Reading, Disk IO Writing) are set to no alerts by default, giving you ample space to customize thresholds.
Notes!
After making changes, click the “save” button for your alarm settings to take effect.
source /opt/ymatrix/matrixdb5/greenplum_path.sh
supervisorctl stop mxui
supervisorctl start mxui