This document introduces YMatrix-related metrics and reference alarm thresholds in the Grafana monitoring panel.
Alarm level description
Notes!
There is no indicator for reference alarm threshold, please judge and configure alarm conditions based on actual conditions.

This section shows the overall operating status of the cluster, including:
| Indicator Name | Description | Unit | Level | Reference Alarm Threshold |
|---|---|---|---|---|
| Cluster status | Cluster node status, including: 0: Normal 1: None Standby 2: None Mirror 10: Distribution unbalanced (Some nodes are not rebalancing after the downtime and recovery) 11: There are master-slave asynchronous nodes (Some Mirror nodes are not synchronized with Primary) 12: Only Master (The cluster only starts the Master node, which is usually used during diagnosis) 20: Segment downtime (There is an unavailable Segment node, and the cluster is not available) |
short | p0 | 20: The Segment downtime is a serious event and requires an alarm |
| uptime | uptime. Includes YMatrix run time since startup and Master host operating system run time | seconds(s) | ||
| version | YMatrix version | |||
| Connection status | Connection status displays the number of connections in the database system, including: Total number of connections (Total), number of connection queries blocked (Blocked), number of idle connections (Idle), number of idle in transactions (Idle in TXN) | short | ||
| Long queries | Slow query. In the current system, the number of queries with execution time exceeding 1 day | short | p3 | greater than 0 means that there are particularly slow queries and an alarm is required |
| Node status | State of each node, including: 0: UP (Normal) 10: Switched (Role swap, indicating that master-slave switching has occurred and needs to be rebalanced) 11: Resync (Master-slave synchronization) 20: Down (Downtime) |
short | 11, 20 Two values need to add alarms | |
| license_expire_date | LICENSE Expiration remaining time | seconds(s) | p3/p2 | Expiration will cause some components to be unavailable and need to be processed as soon as possible, 30 days-15 days |
| Disk Space in Use | Disk usage. Disk usage of Master node or Segment node instance | 0-1 | Alarms are recommended to set directly in node_exporter | |
| Available | Disk free space. Free disk space for Master node or Segment node instance | 0-1 | Alarms are recommended to set directly in node_exporter | |
| CPU | Host CPU Usage | 0-1 | ||
| Memory | Memory usage information | 0-1 | ||
| Load | Host Load | short | ||
| Transactions | Short | Current rollback alarm threshold can be set | ||
| DiskIO | Disk write data amount | bytes | ||
| Network | Network data transmission volume | bytes | ||
| Process | Number of various state processes | short |
| Indicator Name | Description | Unit | Level | Reference Alarm Threshold |
|---|---|---|---|---|
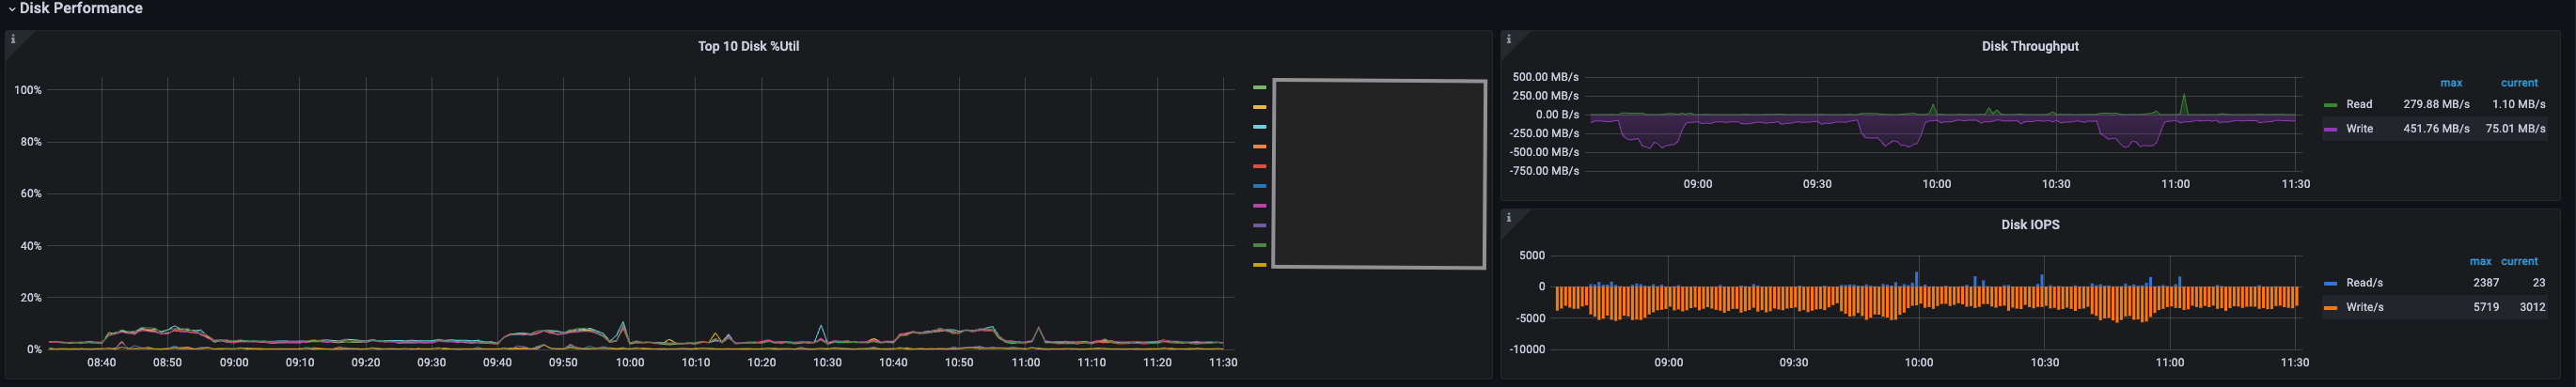
| Top 10 Disk %Util | Disk occupancy Top 10 | 0-1 | Suggest to configure it in node_exporter | |
| Disk Throughput | bytes | Suggested to configure in node_exporter | ||
| Disk IOPS | Disk read and write times (<font color=Blueread, <font color=Orangewrite, the value is absolute) | I/O ops/sec | It is recommended to configure it in node_exporter |
| Indicator Name | Description | Unit | Level | Reference Alarm Threshold |
|---|---|---|---|---|
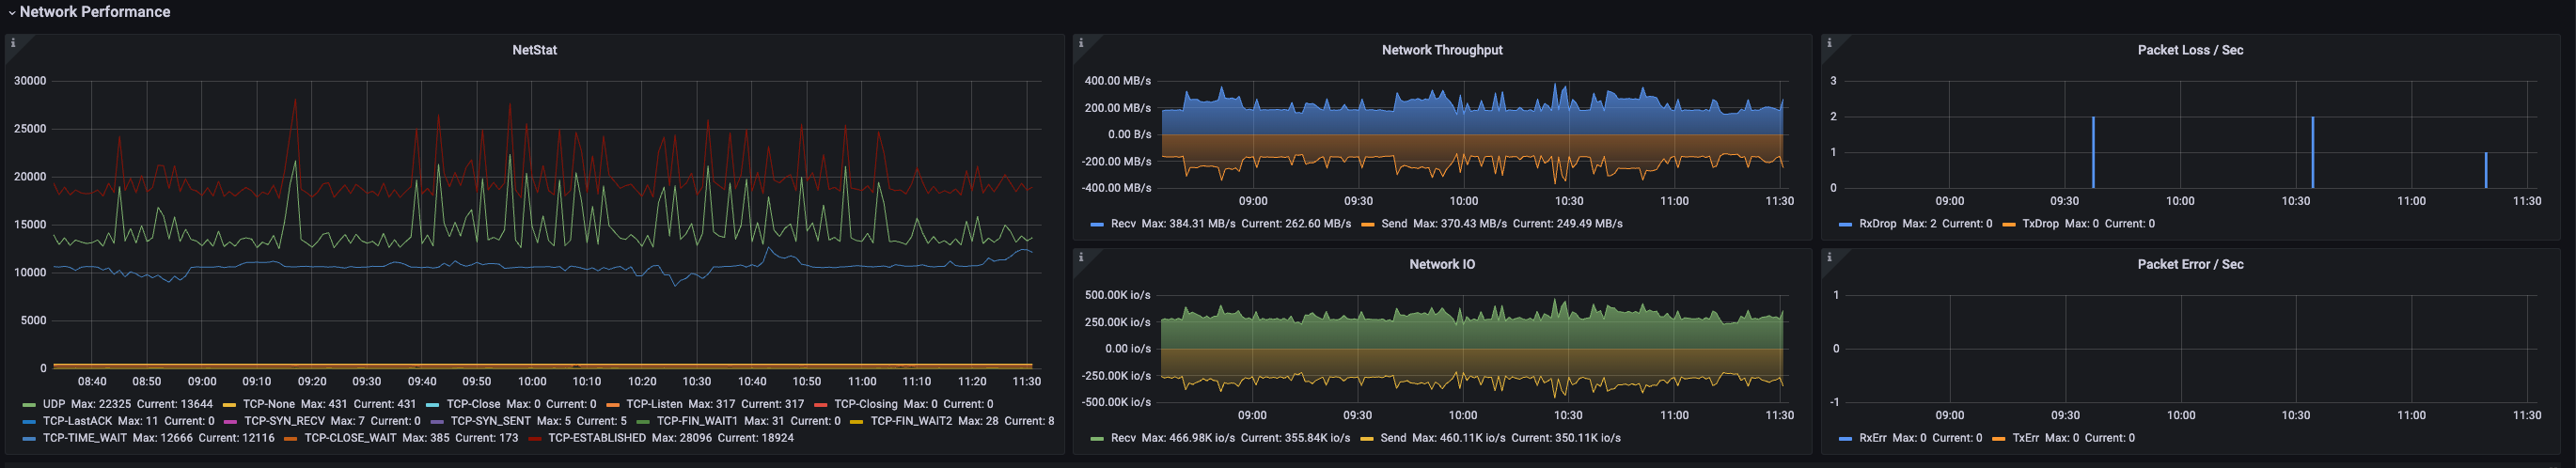
| NetStat | NetStat | Short | Suggest to configure it in node_exporter | |
| Network Throughput | Network Throughput (blue reception, orange transmission, absolute value) | bytes | It is recommended to configure it in node_exporter | |
| Network IO | Network I/O times (greenreceive, yellows, the value is absolute) | io/s | It is recommended to configure it in node_exporter | |
| Packet Loss/Sec | Number of packet loss due to insufficient kernel buffer space | short | p3 | It is recommended to configure it in node_exporter |
| Packet Error/Sec | Number of packets that failed to send and receive | packet/s | It is recommended to configure in node_exporter |
| Indicator Name | Description | Unit | Level | Reference Alarm Threshold |
|---|---|---|---|---|
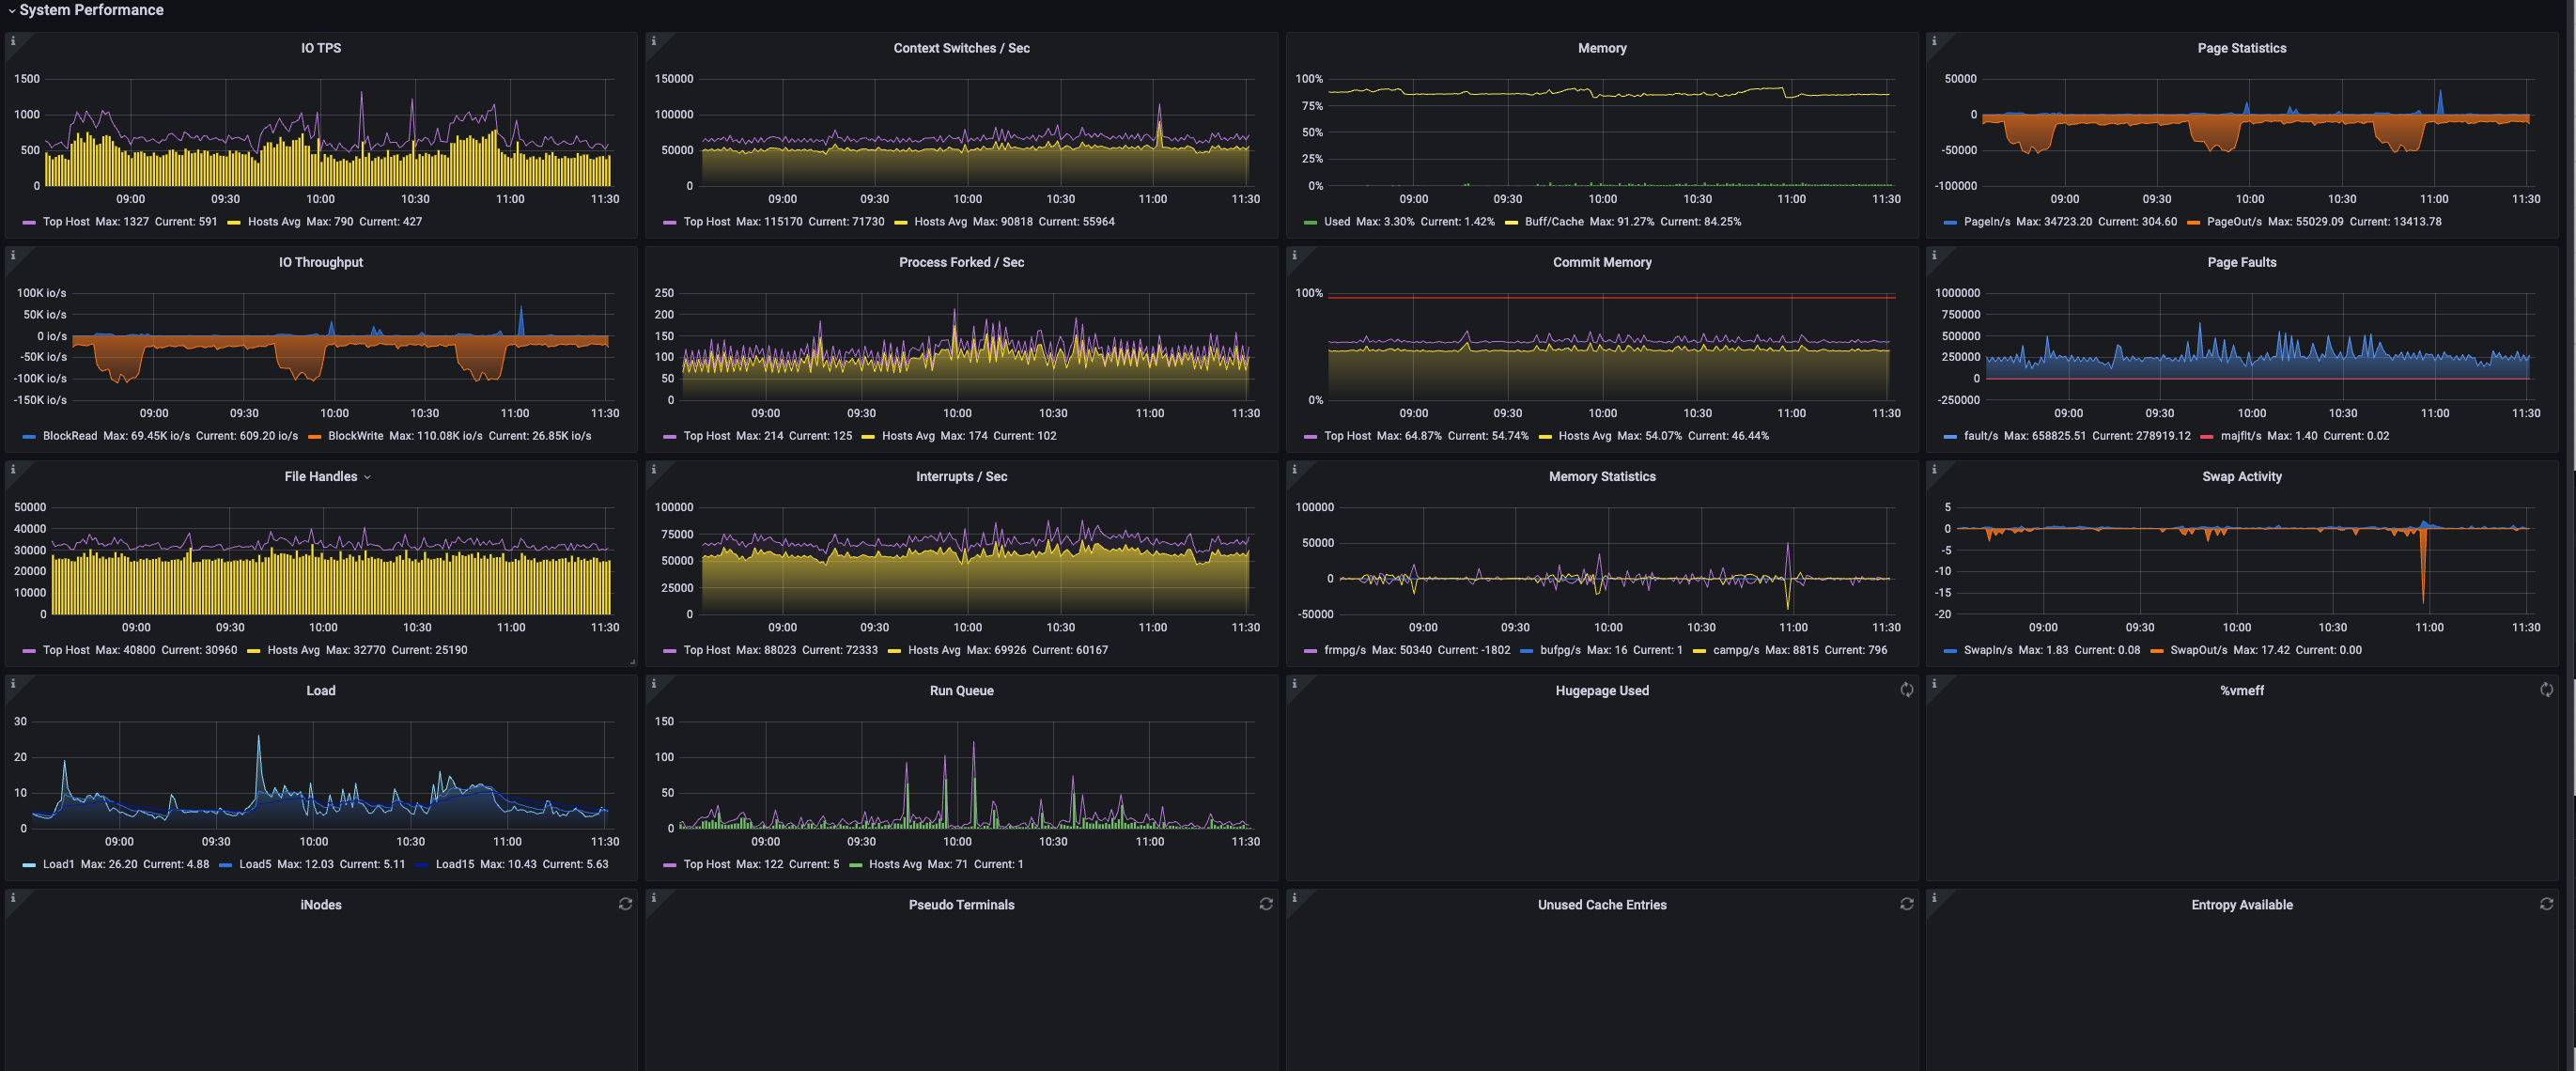
| IO TPS | Total number of physical disks transferred per second. A transmission is an I/O request to a physical device. Multiple logical requests are merged into one I/O request to the device. The amount of data transmitted is uncertain | iops | ||
| Context Switches/Sec | Kernel context switches per second (maximum host and average of all hosts) | short | ||
| Memory | Used - Percentage of Memory Buff/Cache - Percentage of Memory |
0-1 | ||
| Page Statistics | PageIn/s - The total page size of the system reads from disk per second PageOut/s - The total page size of the system writes to disk per second Note: In kernel versions 2.2.x and earlier, this value is the number of pages, not the total page size |
KB | ||
| IO Throuhgput | Read - Number of blocks read from disk per second Write - Number of blocks written to disk per second In 2.4 and newer kernel versions, blocks and sectors are equivalent, 512 bytes. Early kernel version block size is uncertain |
iops | ||
| Process Forked/Sec | Number of Fork Processes per Second | short | ||
| Commit Memory | Memory usage under current load. This value may be greater than 100%, because the kernel usually overuses memory | 0-1 | p3/p2 | 60% 80%, insufficient memory, no OOM protection is set, and may be killed by OOM killer |
| Page Faults | fault/s - Page errors occurring every second of the system. Page errors do not necessarily cause I/O operations, because some page errors can be resolved without initiating I/O operations majflt/s - Page errors caused by requiring memory pages to be loaded from disk |
short | ||
| File Handles | Number of file handles used by the system | short | ||
| Interrupts/Ses | Interrupts | short | ||
| Memory Statistics | frmpg/s - The number of memory pages released by the system per second. Negative numbers indicate the number of pages applied by the system bufpg/s - The number of additional memory pages used by the system for the buffer per second. Negative values indicate the number of pages used in the buffer campg/s - The number of additional memory pages cached by the system per second. Negative numbers indicate that fewer pages are cached Note that the machine architecture is different, the page size may be 4KB or 8KB |
page | ||
| Swap Activity | Number of pages entering and exiting the swap partition per second | page | ||
| Load | Load1 - System average load in the last 1 minute. The average load is the average task in the runnable state, running state and uninterruptible sleep state Load5 - System average load in the last 5 minutes Load15 - System average load in the last 15 minutes |
short | p3/p2 | CPU cores 3 / CPU cores 5 |
| Run Quene | Run Quene | Length of the run queue (number of tasks waiting to run, <font color=Purple is the maximum value of all hosts, Green is the average value of all hosts) | short | |
| Hugepage Used | Large page memory usage | 0-1 | ||
| %vmeff | The ratio of page recycling to page scanning. A higher value means that most pages are recycled and released after scanning. If this value is 100%, it means that each page is recycled after scanning. If the value is lower (less than 30%), it means it is difficult to free memory. If no pages are scanned, the value is 0. So the value is preferably 0 or 100% | 0-1 | ||
| iNodes | Number of inode handles used by the system | short | p3 | |
| Pseudo Terminals | Number of pseudo terminals used by the system | short | ||
| Unused Cache Entries | Number of unused cache entries in the cache directory (pink is the minimum host value, yellow is the average of all hosts) | short | ||
| Entropy Available | The system collects some "real" random numbers by focusing on different events, such as: network activity, hardware random number generator, etc. And provide them to the kernel entropy pool used by /dev/random. Applications that require extremely secure tend to use /dev/random as their entropy source, or random source If /dev/random runs out of available entropy, it cannot provide more randomness, and the application waiting for randomness to stop until more random material is available |
short |
The YMatrix Database interface includes two sections: Database Performance and Storage.
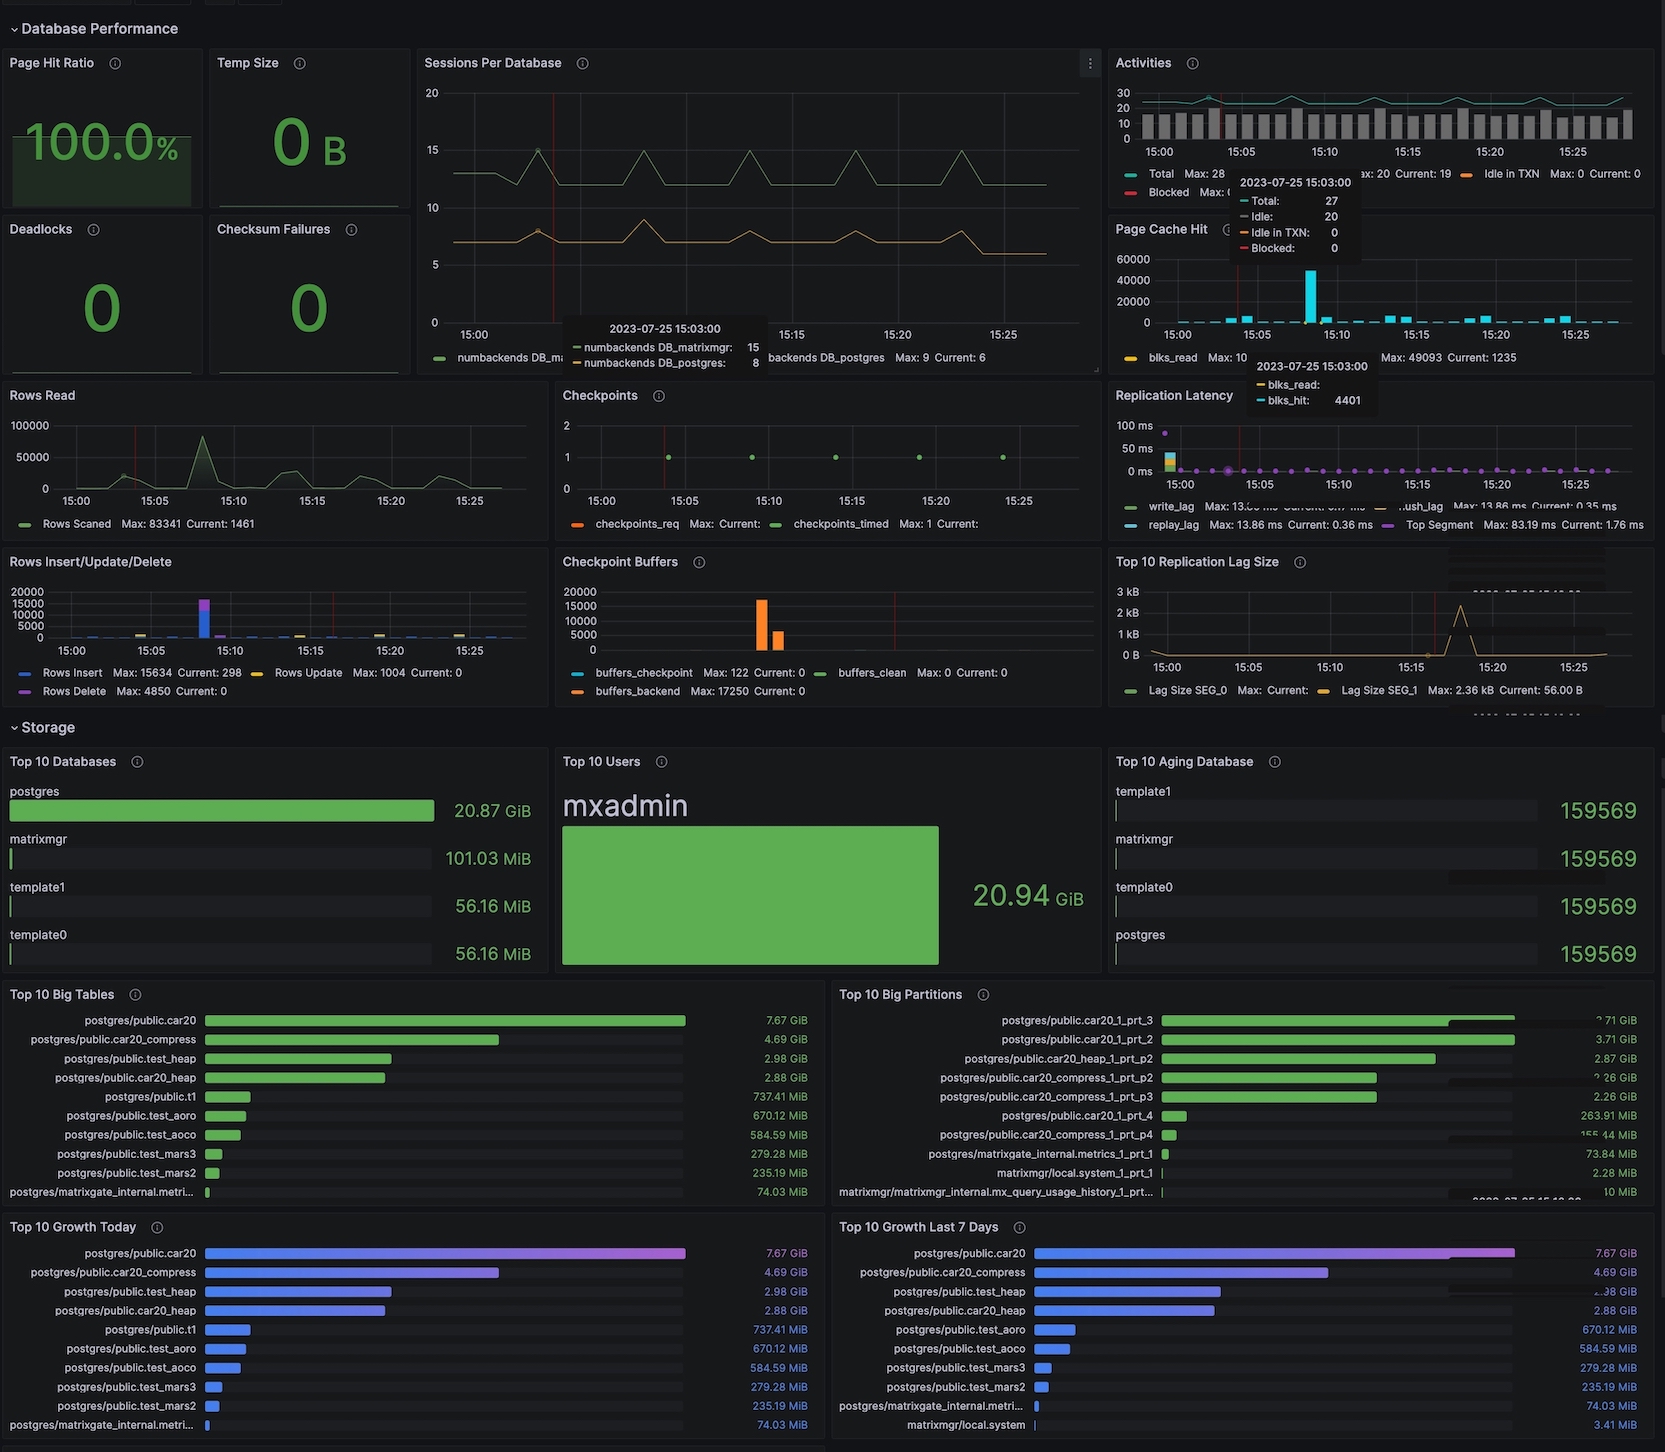
This section shows database performance, including:
| Indicator Name | Description | Unit | Level | Reference Alarm Threshold |
|---|---|---|---|---|
| Page Hit Ratio | HEAP table read operation hit block cache ratio to the total number of read operations. (The cache only includes caches maintained by the HEAP table itself, and does not include operating system cache) The displayed value is the current value, and the curve is the historical value The value is usually required to be above 90% |
0-1 | ||
| Temp Size | The total amount of data written to temporary files in the database is queryed. Regardless of the reason for creating the temporary file and the log_temp_files setting, all temporary files will be counted | bytes | ||
| Sessions Per Database | Number of sessions per database | short | p2/p1 | Maximum connection %60 %80 |
| Activities | Number of sessions in various states | short | ||
| Deadlocks | Number of deadlocks found | short | At greater than 0, alarm can be called | |
| Checksum Failures | NULL | short | p3 | |
| Rows Read | Read data row count | short | ||
| Checkpoints | Checkpoint statistics. <font color=Orange is the number of operations that actively requests to generate checkpoints, Green is the number of operations that automatically generate checkpoints due to timeout | short | ||
| Page Cache Hit | blks_hit: Number of hit caches when reading data pages blks_read: Number of times cache missed and disks to be read |
|||
| Replication Latency | write_lag - The elapsed time between the local flushing the latest WAL and the receipt of the Standby/Mirror write to the WAL successfully (but has not been refreshed or applied). If Standby/Mirror is configured, it can be used to measure the time elapsed between the local flushing of the latest WAL and the receipt of Standby/Mirror writing to WAL and the flashing of the disk successfully (but it has not been applied yet). If Standby/Mirror is configured, it can be used to measure the delay in submission when synchronous_commit is configured to on replay_lag - The elapsed time between the local flushing of the latest WAL and the receipt of Standby/Mirror writing to the WAL, flushing and successfully applying. If Standby/Mirror is configured, it can be used to measure the delay caused by commit when synchronous_commit is configured as remote_apply |
milliseconds(ms) | p3 | Suggested value: 10s Master-slave synchronous replication, too high latency may affect slow write transactions |
| Rows Insert/Update/Delete | Rows Insert: Insert number of rows Rows Update: Updating number of rows Rows Delete: Delete number of rows |
short | ||
| Checkpoint buffers | buffers_checkpoint - Number of caches written during checkpoint generation buffers_clean - Number of caches written by background write process buffers_backend - Number of caches written directly by worker process |
short | ||
| Top 10 Replication Lag Size | Top 10 Replication Delay WAL Size | bytes | p3 | 1GB |
This section displays storage-related statistics, including: | Indicator Name | Description | Unit | Level | Reference Alarm Threshold | | --- | --- | --- | --- | --- | |Top 10 Database|Database Size Top10|bytes| | | |Top 10 Users|User Data Size Top10|bytes| | | |Top 10 Aging Database|Database Age Top 10. When the database age exceeds 20E, the database will be unavailable|short|p2|1500000000| |Top 10 Big Tables|Table Size Top10|bytes| | | |Top 10 Big Partitions|Partition table size Top10|bytes| | | |Top 10 Growth Today|The 10 Tables with the Fastest Data Growth on the Day|bytes| | | |Top 10 Growth Last 7 Days|10 Tables with the Fastest Data Growth in 7 Days|bytes| |