This document is the first article in the “Time-series Data Modeling” chapter. YMatrix believes that the design of data models directly impacts the value of data consumption and usage. Therefore, in addition to technical introductions, we aim to provide you with a clear understanding of the concepts, applications, and development of time-series data models (Time-series Data Model) throughout this chapter.
The information age is changing at an astonishing rate, which is inseparable from the capture, analysis, and utilization of data by humans. Map navigation software, street surveillance cameras, and heating companies all provide services to our daily lives through precise data statistics. However, as technology advances and the pace of life accelerates, we no longer just want to know where to go and how to get there; we also want to know in real time which roads are clear to avoid traffic congestion. Governments monitor public areas to protect public safety, while we also want to purchase real-time health monitoring devices to monitor our physical condition in real time for health protection. It must be lightweight and portable, preferably with a stylish design; heating companies are no longer satisfied with understanding monthly average daily temperature (MDT) changes but want to join the smart city development trend, using hourly temperature, wind speed, and precipitation changes to enhance their property modeling and optimize energy efficiency...
Clearly, merely conducting data statistics over longer time periods can no longer meet humanity's increasingly “greedy” demands. Detailed, feature-rich data has become one of the most valuable commodities in our information-scarce world. In the process of analyzing demand, we realized that the core of these scenarios is inseparable from one type of data: it is strongly related to time and comes from various devices; it accumulates over time and has rich utilization value; it is very large, easily reaching TB or even PB levels, and has extremely high requirements for the storage performance of the underlying database.
Based on its essential characteristics, early scholars called it time series data.
Without a doubt, time-series data is dynamic and ever-changing. It is like a dynamic movie playing out in real time within a business system, with no end in sight. It possesses rich and powerful utility value, not only helping businesses reduce costs, improve efficiency, and enhance quality, but also guiding aspiring visionaries toward suitable directions for exploration. In today's world, those who possess and fully utilize it can be said to have seized the initiative of the times.
Specifically, YMatrix believes that time-series data primarily consists of the following components:
2023-02-10 20:00:00.6.2._1681725703.png)
In summary, we can define time series data in YMatrix as follows: time series data refers to a series of data points that are strongly correlated with time. In applications, it usually manifests as a series of data points collected at different points in time.
Time series data can track changes over different time intervals, such as milliseconds, days, or even years, providing powerful insights. We believe that regardless of the scenario or use case, all time series data sets have several things in common:
Collected data is always recorded as a new row.
Data typically arrives in the database in chronological order.
Time is the primary axis (time intervals can be regular or irregular).
Timeliness. The newer the time-series data, the greater its value, with value density gradually decreasing over time.
Downsampling. Downsampling involves using a GROUP BY statement to group the raw data into broader time intervals and calculate the key characteristics of each group. Downsampling not only reduces storage overhead but also preserves key data characteristics, making it easier to analyze historical trends and predict future trends.
Requires integration with relational data to be valuable. Without structured relational data providing contextual information, time-series data is just a number. We need sufficient structured information to describe a number. For example, for a data point with a value of 36.5, we need to understand whether it represents temperature, humidity, or pressure? What are its units—Celsius or Pascal? What is its source—a boiler, conveyor belt, or bearing? Is the equipment located in Zone 1 or Zone 2 of the factory? And so on. Data with richer associative information often has higher value.
So how does the time series scenario differ from traditional OLTP (Online Transactional Processing) and OLAP (Online Analytical Processing) scenarios? Let's use a table to illustrate:
| Business Scenario | Data Manipulation Language (DML) | Write Method | Query Requirements | Concurrency |
|---|---|---|---|---|
| Time Series | INSERT / Appendly-only | High-frequency streaming write | Time-based point query, details, aggregation; Association analysis, complex analysis | High concurrency |
| OLTP | INSERT / UPDATE / DELETE | High-frequency write | Point queries | High concurrency |
| OLAP | INSERT / Few UPDATES / Few DELETES | Low-frequency batch write (ETL) | Association, aggregation | Low concurrency |
In terms of time-series database development, the data model is the pattern for organizing data and the interface exposed to users. Users must understand the data model on which the database is built in order to know how to use it. In other words, the way a database chooses to model and store data determines what you can do with it.
In terms of user usage, the data model is more inclined to define best practices for table meta information, which is a modeling action that needs to be designed in advance according to business needs.
According to statistics, time series databases have become the fastest growing type of database in the world.
When time series databases dedicated to time series scenarios and time series data services were first created, most of them were designed and built based on non-relational data models in pursuit of rapid expansion of data scale. However, today, as user demand for time series data consumption gradually deepens, the query performance of non-relational databases is no longer sufficient to meet business-level usage in many scenarios. The lack of a unified standard interface has led to rising learning costs for developers, who must continuously modify programs at the business level to meet demand. Meanwhile, the rapid development of distributed databases has significantly improved the write performance of relational databases, which were previously relatively weak in this area. As a result, the industry has gradually returned to relational data models, and YMatrix is part of this trend.
We agree that, in the long term, storing all data in a single system will significantly reduce application development time and costs, and accelerate the speed at which you make critical decisions.
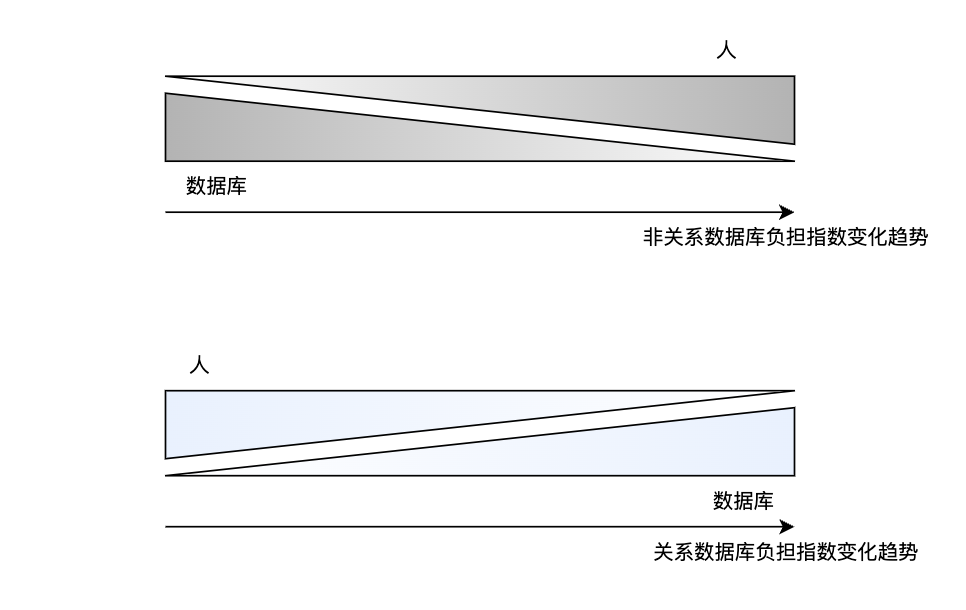
There are two completely different views on the development and design of time-series data models:
In fact, both of these models have played a very important role in the development of time-series databases. Initially, due to the extremely fast accumulation speed of time-series data, early developers believed that traditional relational models were difficult to handle such large-scale datasets, while non-relational data models with simple data entry performed better in terms of scalability. Therefore, time-series databases developed using non-relational models.
Non-relational database products like InfluxDB decided to take on the challenge of building a database from scratch, and achieved initial success thanks to their advantages in terms of runtime speed and scalability. However, as business requirements continued to evolve, data consumers gradually realized that while the low barrier to entry of non-relational databases (typically requiring minimal upfront data modeling and enabling quick deployment) was initially appealing, these systems became increasingly difficult to manage as they grew larger and more complex. Without a universal query language, both database developers and operations personnel must address this “technical debt,” and may even need to learn more advanced programming languages to meet more complex query and operations requirements.
The increasingly high costs and narrowing user interfaces have made non-relational time-series databases unaffordable for users, prompting them to consider returning to relational databases (where the “burden” on the database itself has grown heavier, while humans have gradually been relieved of the operational burden), and this trend has become a wave.
The "regression" we are talking about here is not a fallback of a database technology, but a design of new variants that conform to the characteristics of timing scenarios based on traditional relationship libraries. For example, a wide table variation combining "structured" and "semi-structured" are shown below. ### 3.2 Narrow table or wide table? Since timing applications are designed to store a large amount of time-related information, data modeling of underlying data storage is essential. The related data model describes information in the externalized form of a related data table. Since YMatrix is built on a relational data model, you can design the DDL of partitioned tables (or Schema of a generally called table) in a variety of ways. Generally speaking, there are two main storage modes: Narrow table (Narrow) and Wide table (Wide).
| Narrow Table | Wide Table | Narrow Table Variation | Wide Table Variation | |
|---|---|---|---|---|
| Pre-term design cost | Low | Higher | Lower | Higher |
| Expand difficulty | Easy | More complex | Easier | Easier |
| Space Overhead | Large | Small | Large | Small |
| Query Performance | Low | High | Low | High |
Notice! For detailed introduction to wide tables, narrow tables, narrow table variants, and wide table variants, please refer to [Timing Series Modeling Ideas] (/doc/5.0/datamodel/guidebook); for specific scenarios, please refer to [Data Modeling Examples in the Internet of Vehicles Scenario] (/doc/5.0/datamodel/V2X_best_practice) and [Data Modeling Examples in the Smart Home Scenario] (/doc/5.0/datamodel/SmartHome_best_practice).