This document mainly introduces how to use MatrixDB's graphical interface analysis, manage active queries and blocking queries for databases.
Ymatrix often needs to execute massive queries when supporting business operations. In order to facilitate our daily monitoring of the running status of queries, the query monitoring function provides database active queries and blocking query information in real time, helping us manage and analyze slow queries and query blocking situations, and improve database service efficiency.
Slow query refers to SQL in the database whose query time exceeds the specified threshold. It is a performance killer of the database and an important tool for business optimization of database access. Query monitoring displays the slow query information currently in the database and specified conditions, helping you manage and analyze slow query and improve database service efficiency.
First, you need to log in to the graphical interface. Enter the IP of the machine where MatrixGate is located (the default is the IP of Master) and the port number in the browser:
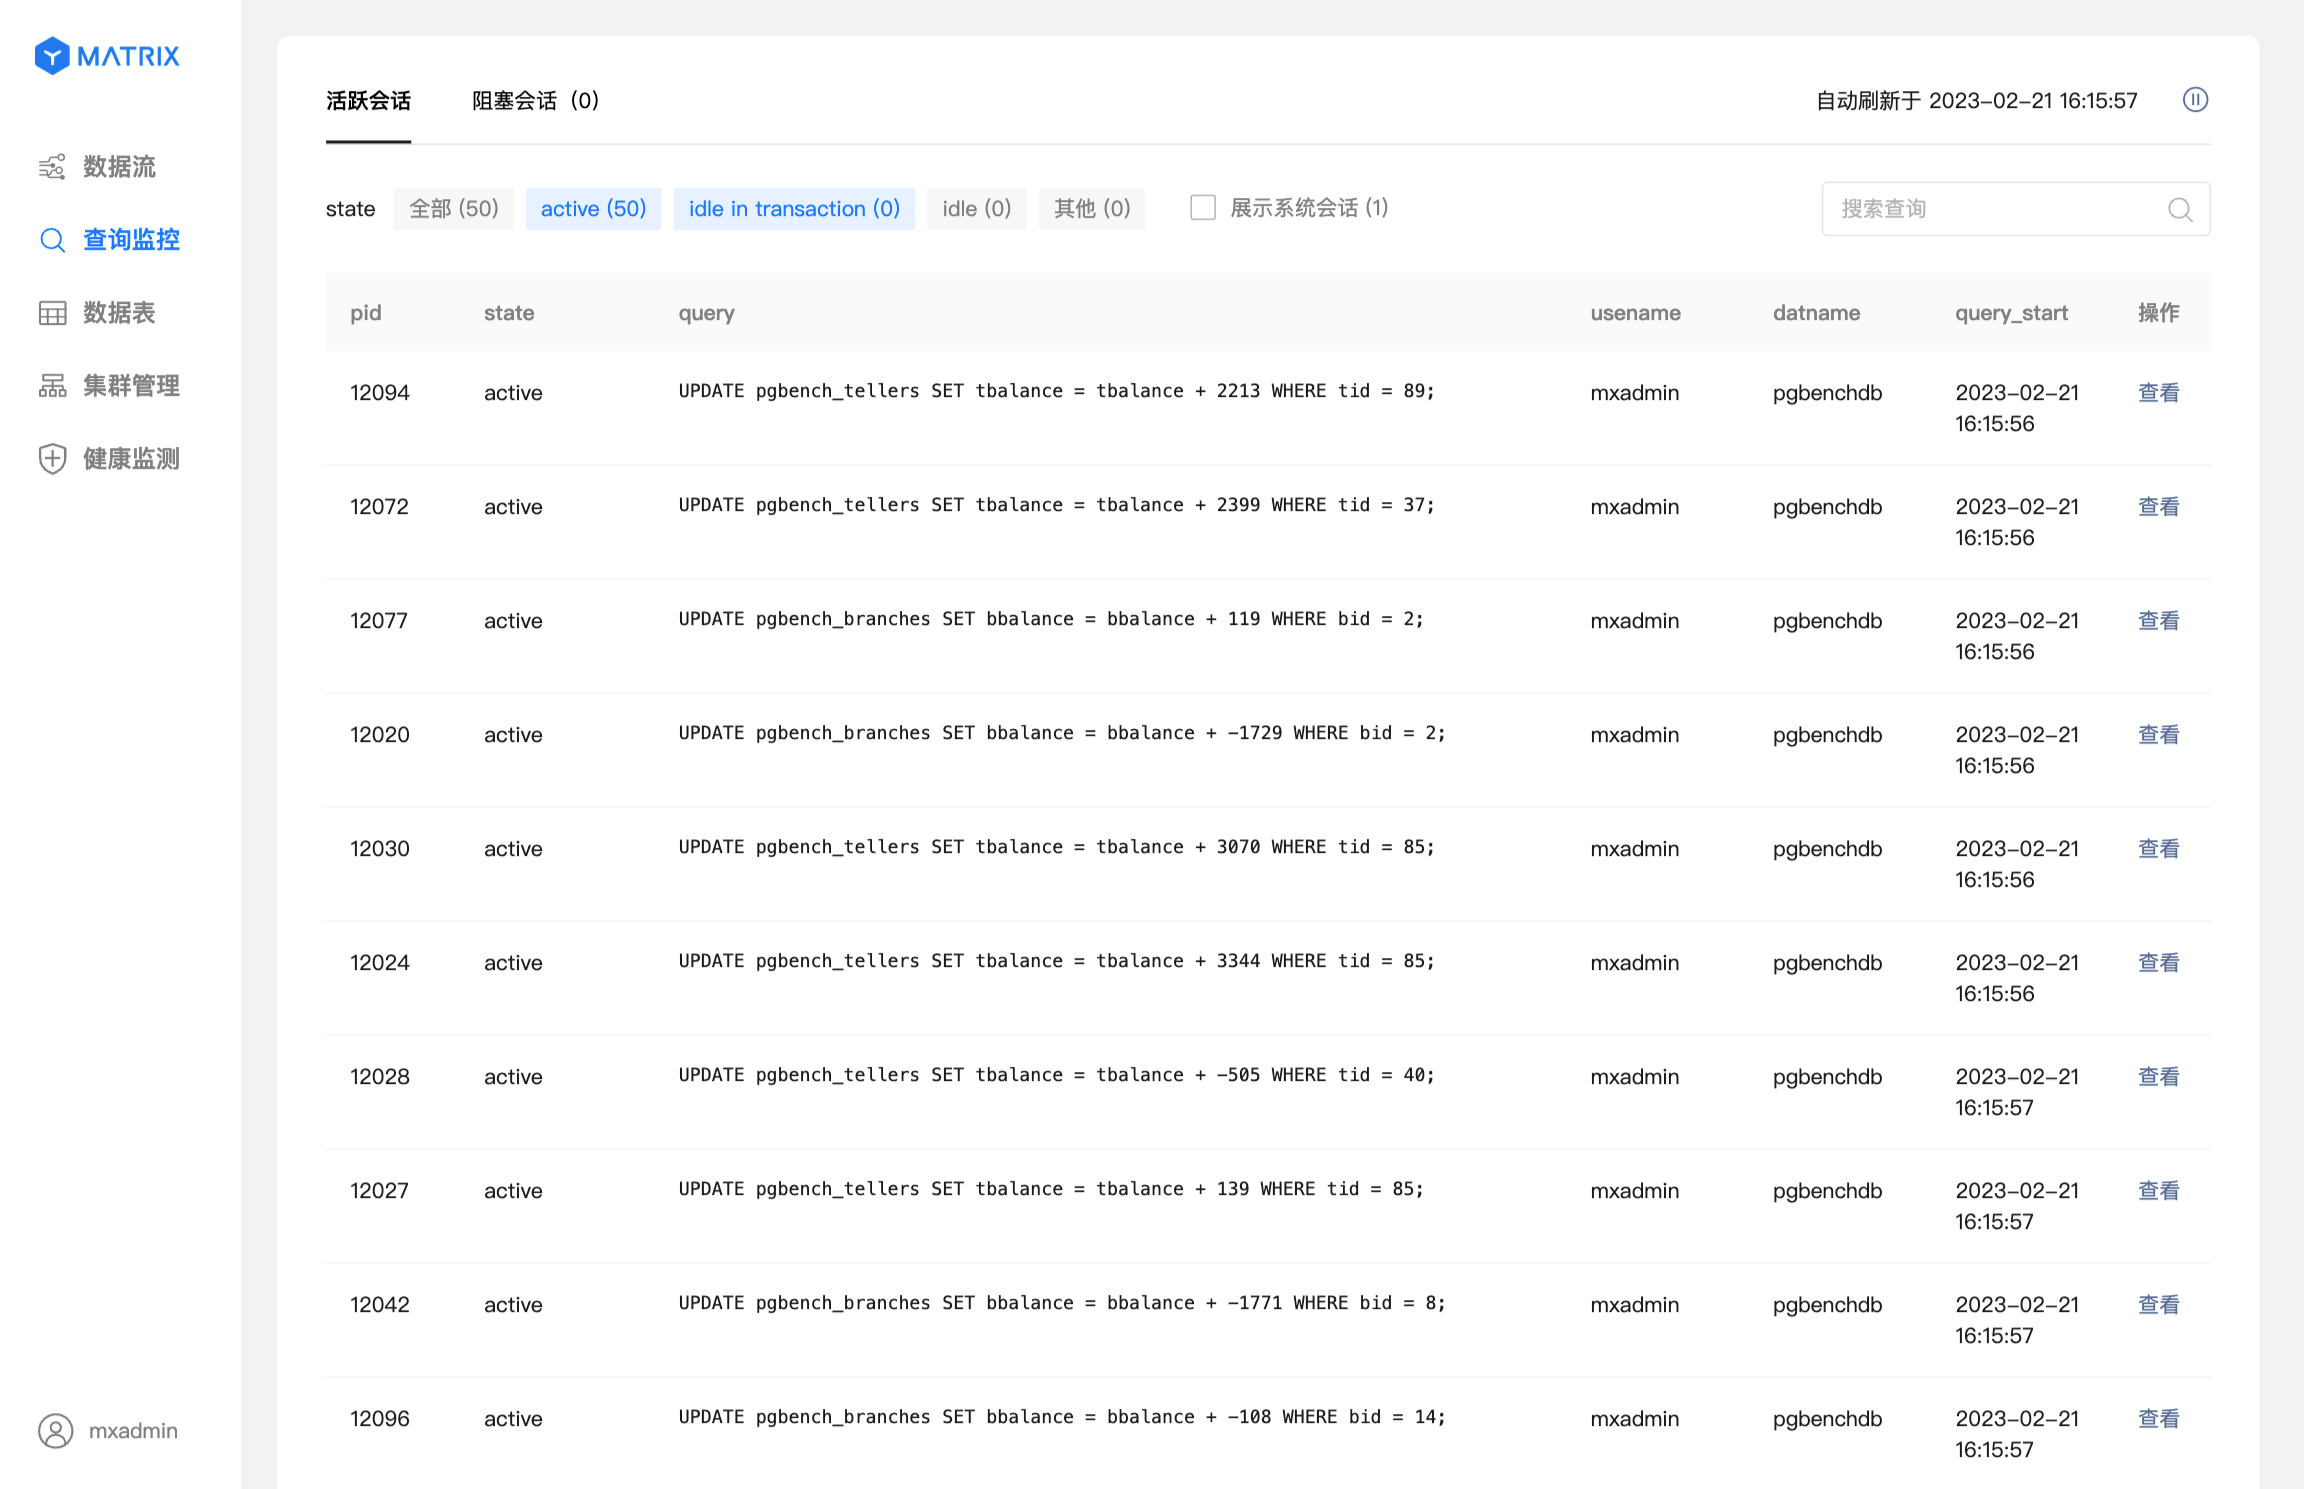
http://<IP>:8240After logging in, click "Query Monitoring" in the left navigation bar. Go to the Active Sessions page.
pg_stat_activity, which is sorted in reverse order of query_start by default. The list content will automatically refresh once every 10 seconds. If you need to carefully view a certain information in the list, you can pause the refresh to prevent the automatic refresh function from filtering out the session being viewed. In order to reduce the load caused by frequent automatic refreshes, the system will pause automatic refresh when you exit the query monitoring page.active + idle in transaction status query. You can click any state on the status bar to filter the list content. The Status + number of sessions in that state is displayed in each status block. Instructions for
idle in transaction
This status indicates that the query statement has been executed, but the corresponding transaction has not been committed or rolled back. It should be noted that although statements in this state do not occupy resources such as CPU and I/O, they will occupy connection resources such as number of connections and concurrency. At the same time, the locks held by each query in the transaction will not be released until the corresponding transaction is committed or rolled back. During this period, most queries with the tables involved in the transaction will be blocked, which will affect the service's response speed.
If you find that the transaction is in theidle in transactionstate for too long (such as more than one hour), it is recommended to submit or roll back the transaction in time.
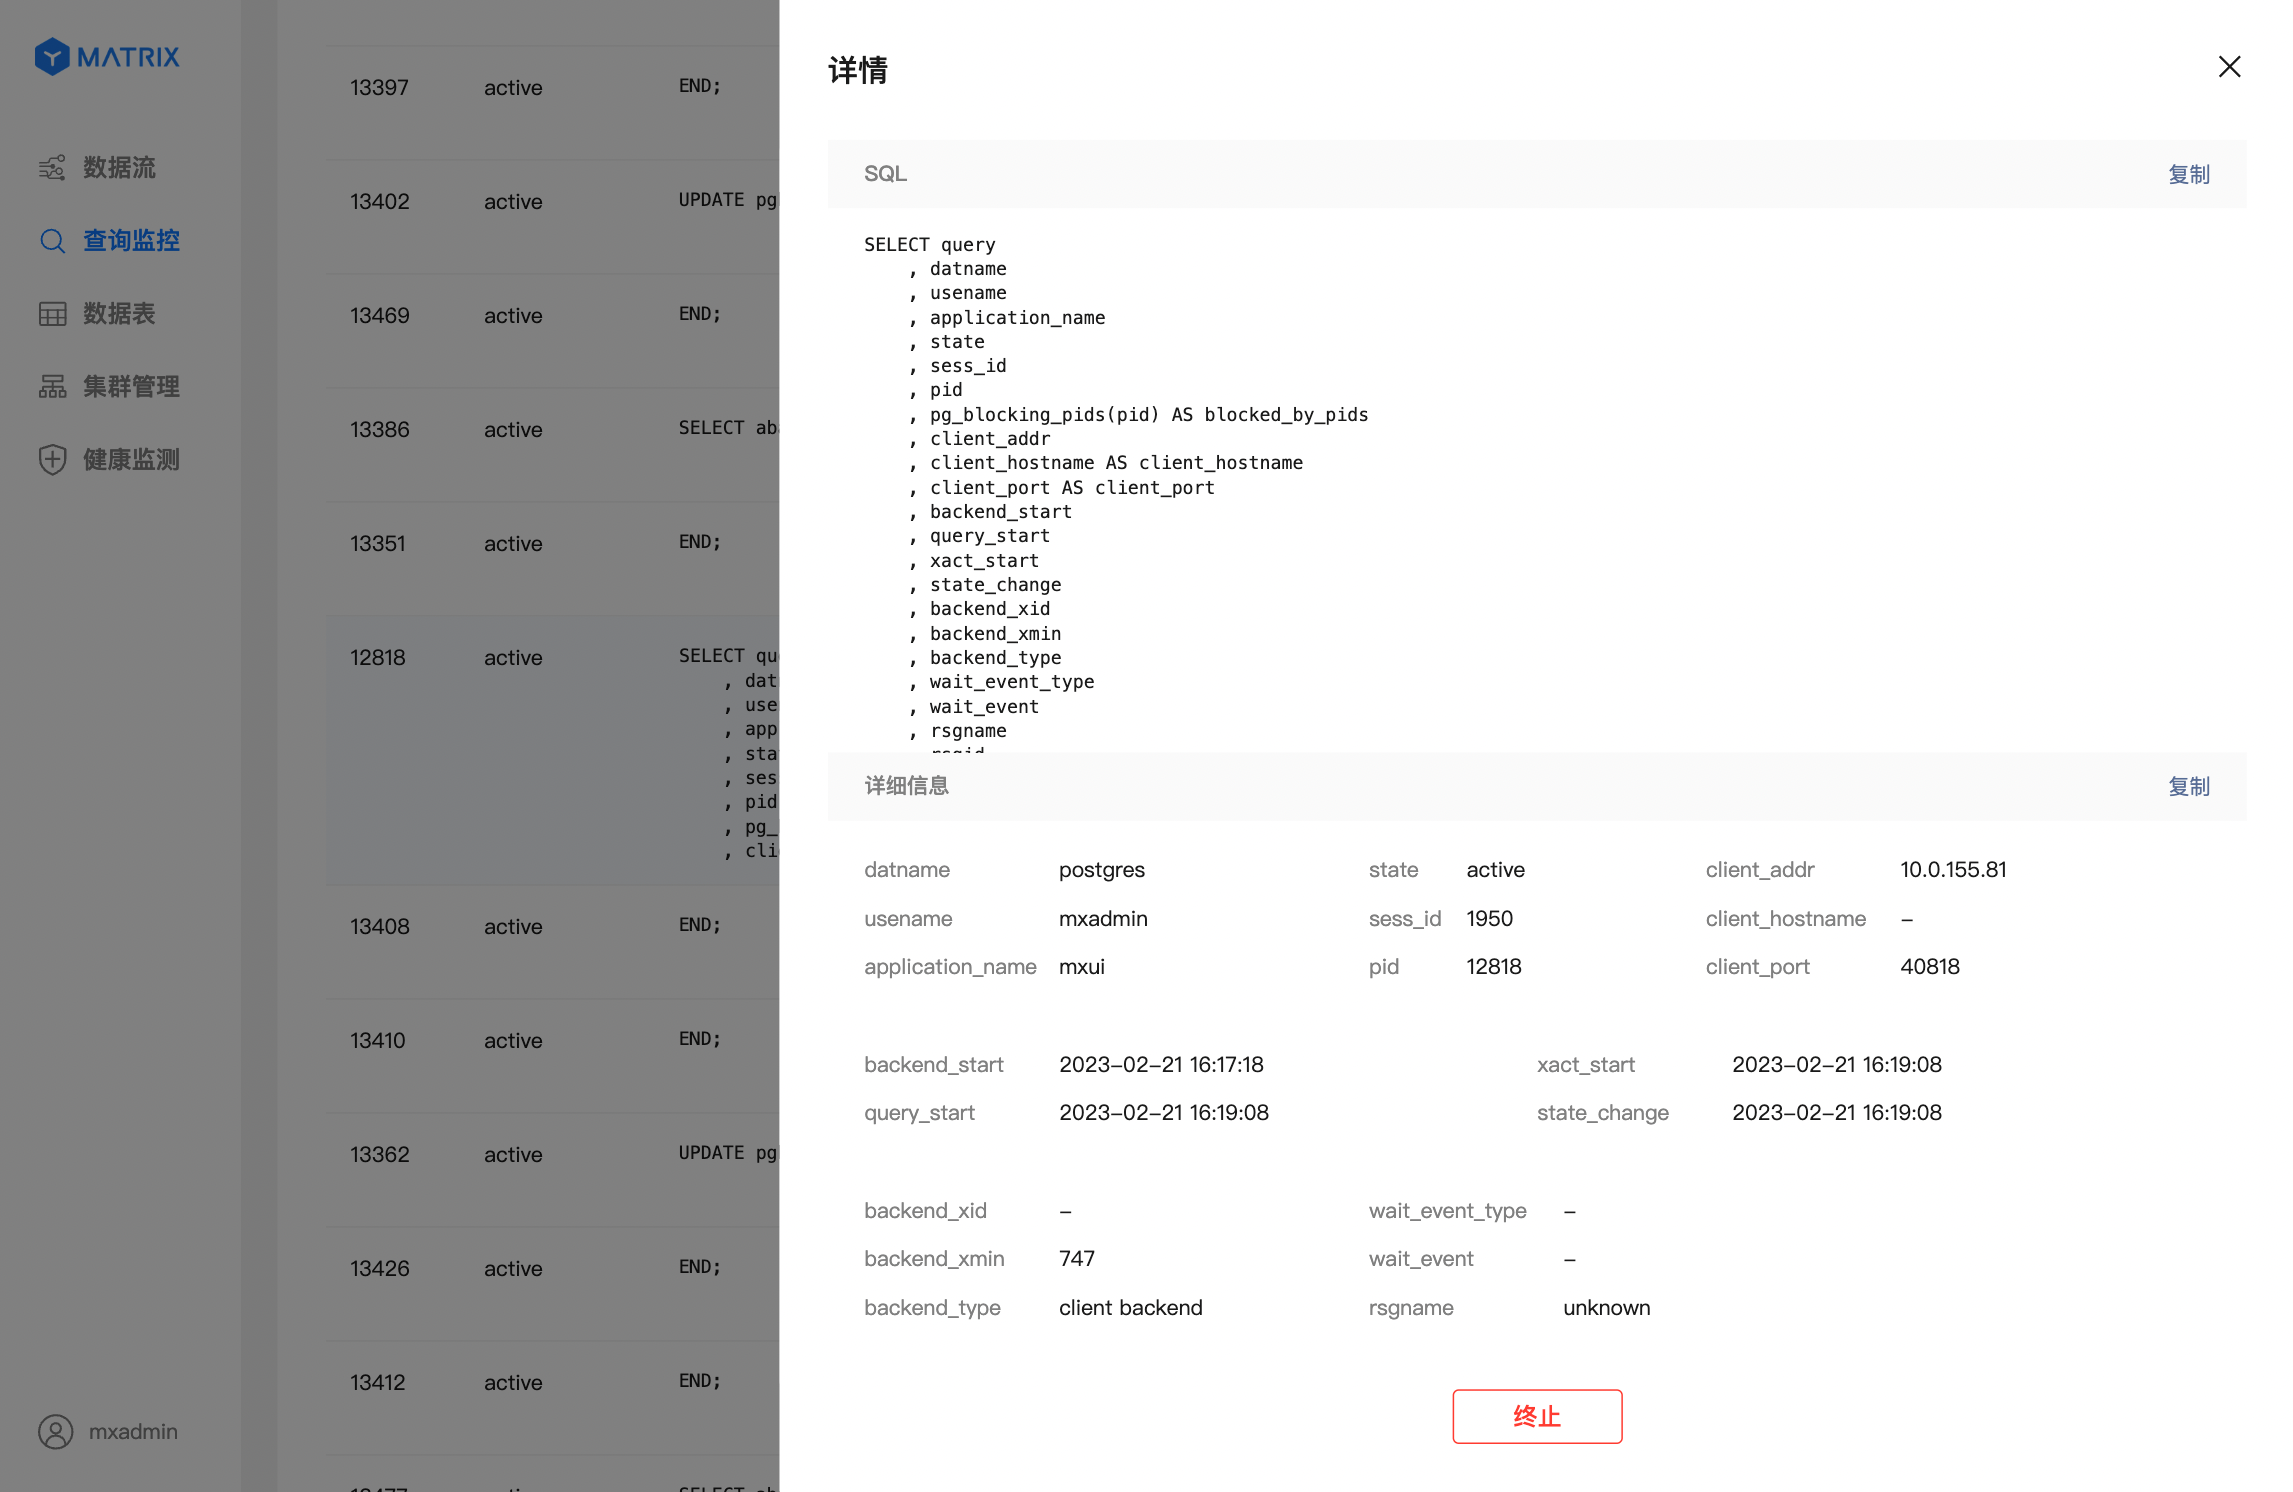
Click the "View" button on the right side of the target session to pop up the query details page, displaying all the field information of the query in the pg_stat_activity table, and supports termination of the session.
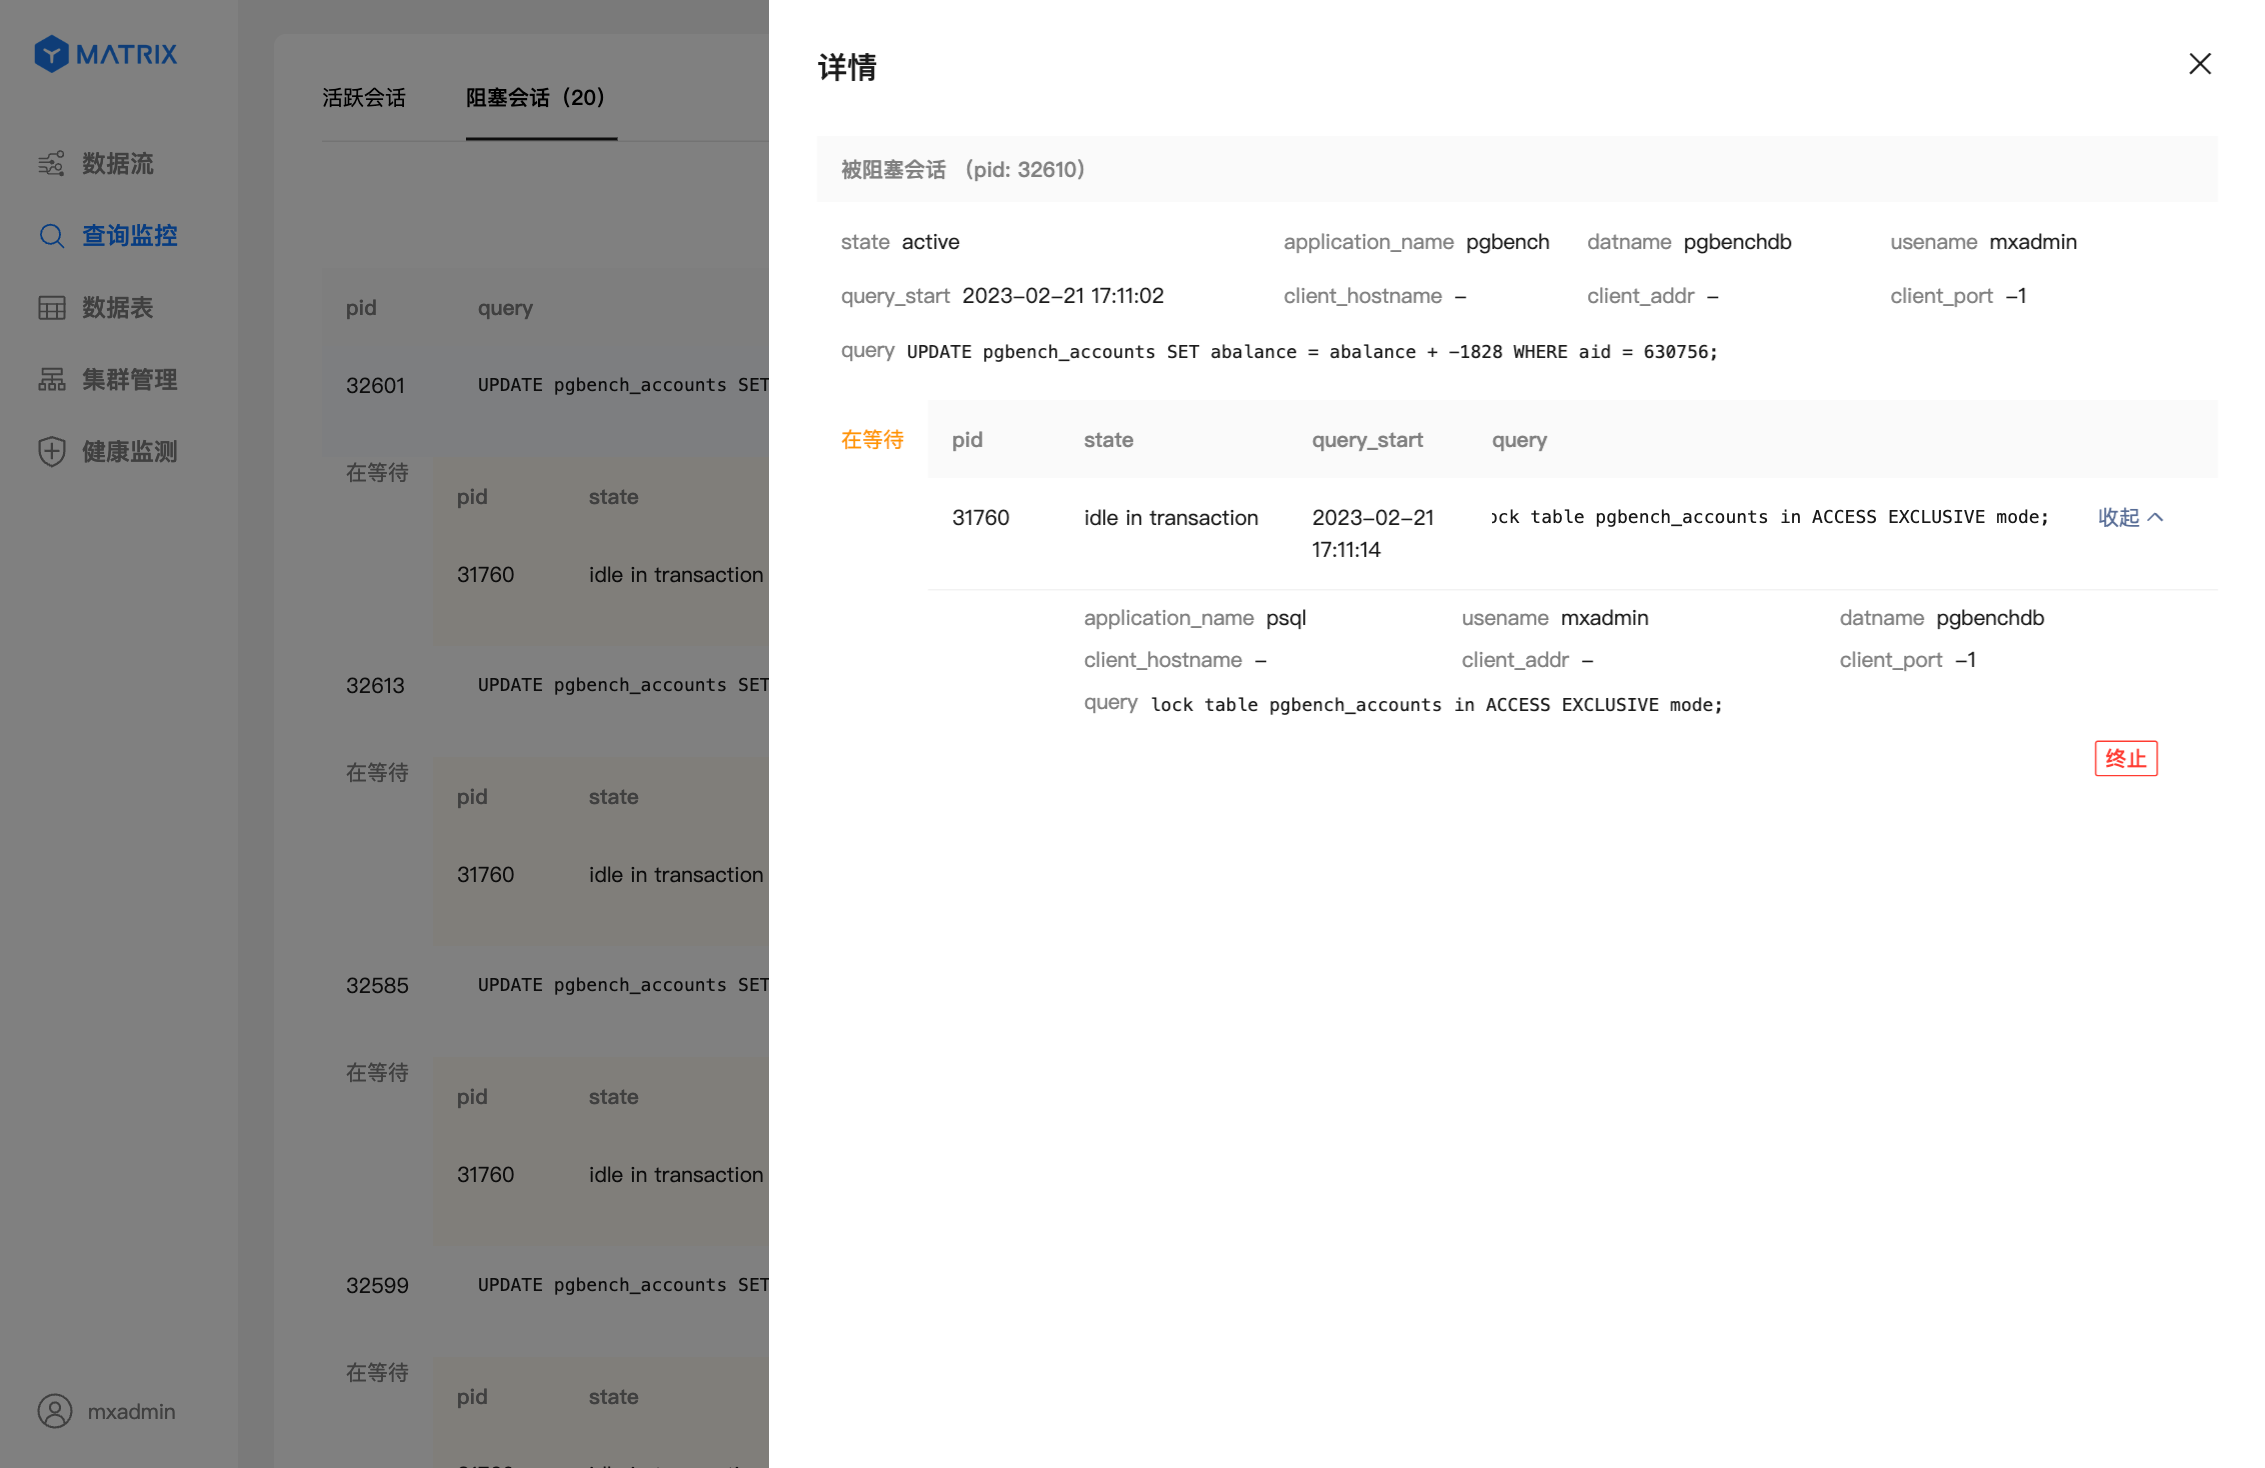
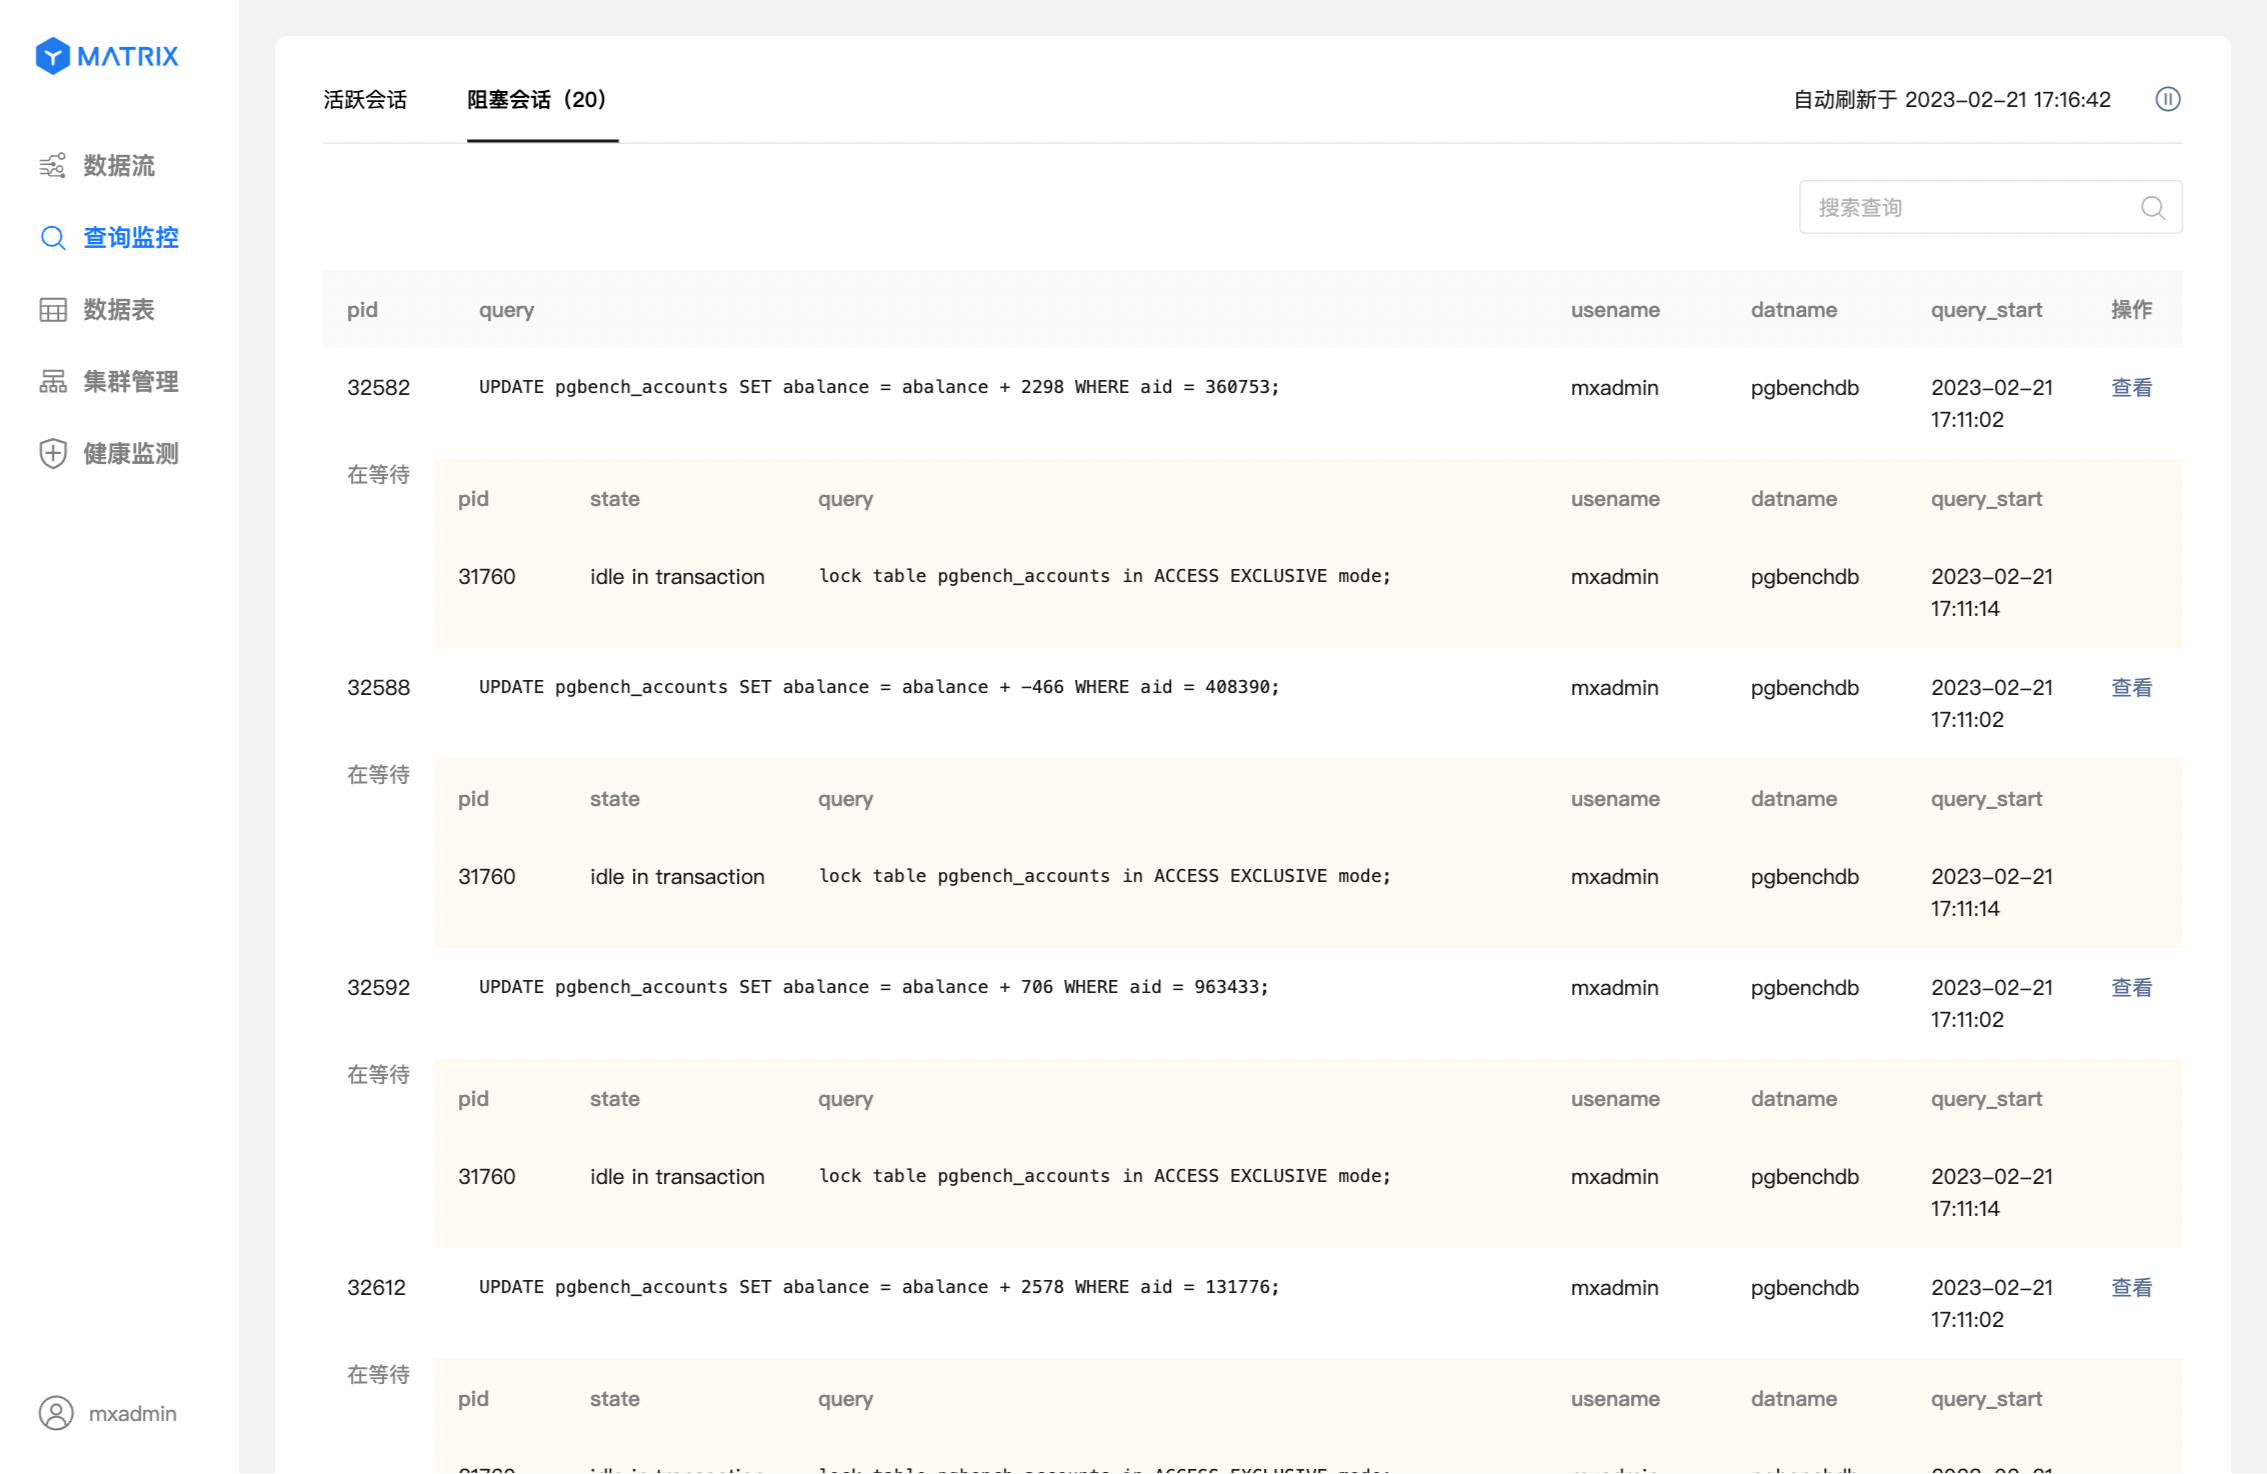
Click "Blocking Session" to switch to the blocking session list to display the session blocking relationship in the current database. By default, the default is arranged in reverse order of the blocking time, that is, the longer the blocking relationship exists, the higher the order. List content: 10 seconds Automatic refresh. If you need to carefully view a set of blocking relationship information in the list, you can pause the refresh to prevent the automatic refresh function from filtering out the blocking status session being viewed. In order to reduce the load caused by frequent automatic refreshes, the system will pause automatic refresh when you exit the query monitoring page.
Click the "View" button on the right side of the target blocking relationship to pop up the query details page, and support termination of the session.