This document introduces the basic operation and maintenance management of MatrixDB clusters, which mainly includes two aspects:
The basic operation and maintenance management of the command line includes starting and stopping the cluster, checking the cluster operation status, modifying the cluster configuration, etc.
These commands are controlled through the master node, so they must be executed on the master.
The gpstart -a command can start a MatrixDB cluster.
[mxadmin@mdw ~]$ gpstart -a
20210723:16:00:36:002624 gpstart:sdw2:mxadmin-[INFO]:-Starting gpstart with args: -a
20210723:16:00:36:002624 gpstart:sdw2:mxadmin-[INFO]:-Gathering information and validating the environment...
20210723:16:00:36:002624 gpstart:sdw2:mxadmin-[INFO]:-Greenplum Binary Version: 'postgres (MatrixDB) 4.1.0-community (Greenplum Database) 7.0.0+dev.16905.gc6dbf4f14d build commit:c6dbf4f14d4452a414198fd45d507819803fffb2'

......

20210723:16:00:38:002624 gpstart:sdw2:mxadmin-[INFO]:-Database successfully started
Notes!
For detailed usage methods ofgpstart, please refer to Document.
The gpstop -a command is used to stop a running cluster.
[mxadmin@mdw ~]$ gpstop -a
20210723:16:08:41:002827 gpstop:sdw2:mxadmin-[INFO]:-Starting gpstop with args: -a
20210723:16:08:41:002827 gpstop:sdw2:mxadmin-[INFO]:-Gathering information and validating the environment...

......

20210723:16:08:43:002827 gpstop:sdw2:mxadmin-[INFO]:-Successfully shutdown 1 of 1 segment instances
20210723:16:08:43:002827 gpstop:sdw2:mxadmin-[INFO]:-Database successfully shutdown with no errors reported
The prerequisite for stopping the cluster with gpstop -a is that there is currently no active connection, otherwise it will be suspended until other connections exit.
If you want to forcefully kill the user connection and close the cluster, use gpstop -a -M fast.
gpstop -ar can restart the cluster.
After modifying the pg_hba.conf authorization configuration, you need to call gpstop -u to reload the authorization configuration.
Notes!
For detailed usage methods ofgpstop, please refer to Document.
gpstate can view the running status of the cluster, including:
[mxadmin@mdw ~]$ gpstate
20210723:17:00:15:004109 gpstate:sdw2:mxadmin-[INFO]:-Starting gpstate with args:
......
20210723:17:00:15:004109 gpstate:sdw2:mxadmin-[INFO]:-Obtaining Segment details from master... 20210723:17:00:15:004109 gpstate:sdw2:mxadmin-[INFO]:-Gathering data from segments... 20210723:17:00:16:004109 gpstate:sdw2:mxadmin-[INFO]:-Greenplum instance status summary 20210723:17:00:16:004109 gpstate:sdw2:mxadmin-[INFO]:----------------------------------------------------- 20210723:17:00:16:004109 gpstate:sdw2:mxadmin-[INFO]:- Master instance = Active 20210723:17:00:16:004109 gpstate:sdw2:mxadmin-[INFO]:- Master standby = No master standby configured 20210723:17:00:16:004109 gpstate:sdw2:mxadmin-[INFO]:- Total segment instance count from metadata = 1 20210723:17:00:16:004109 gpstate:sdw2:mxadmin-[INFO]:----------------------------------------------------- 20210723:17:00:16:004109 gpstate:sdw2:mxadmin-[INFO]:- Primary Segment Status 20210723:17:00:16:004109 gpstate:sdw2:mxadmin-[INFO]:----------------------------------------------------- 20210723:17:00:16:004109 gpstate:sdw2:mxadmin-[INFO]:- Total primary segments = 1 20210723:17:00:16:004109 gpstate:sdw2:mxadmin-[INFO]:- Total primary segment valid (at master) = 1 20210723:17:00:16:004109 gpstate:sdw2:mxadmin-[INFO]:- Total primary segment failures (at master) = 0 20210723:17:00:16:004109 gpstate:sdw2:mxadmin-[INFO]:- Total number of postmaster.pid files missing = 0 20210723:17:00:16:004109 gpstate:sdw2:mxadmin-[INFO]:- Total number of postmaster.pid files found = 1 20210723:17:00:16:004109 gpstate:sdw2:mxadmin-[INFO]:- Total number of postmaster.pid PIDs missing = 0 20210723:17:00:16:004109 gpstate:sdw2:mxadmin-[INFO]:- Total number of postmaster.pid PIDs found = 1 20210723:17:00:16:004109 gpstate:sdw2:mxadmin-[INFO]:- Total number of /tmp lock files missing = 0 20210723:17:00:16:004109 gpstate:sdw2:mxadmin-[INFO]:- Total number of /tmp lock files found = 1 20210723:17:00:16:004109 gpstate:sdw2:mxadmin-[INFO]:- Total number postmaster processes missing = 0 20210723:17:00:16:004109 gpstate:sdw2:mxadmin-[INFO]:- Total number postmaster processes found = 1 20210723:17:00:16:004109 gpstate:sdw2:mxadmin-[INFO]:----------------------------------------------------- 20210723:17:00:16:004109 gpstate:sdw2:mxadmin-[INFO]:- Mirror Segment Status 20210723:17:00:16:004109 gpstate:sdw2:mxadmin-[INFO]:----------------------------------------------------- 20210723:17:00:16:004109 gpstate:sdw2:mxadmin-[INFO]:- Mirrors not configured on this array 20210723:17:00:16:004109 gpstate:sdw2:mxadmin-[INFO]:-----------------------------------------------------
### 1.4 Modify cluster configuration
`gpconfig` is used to view or modify configuration parameters in the configuration file `postgresql.conf`.

#### 1.4.1 View configuration
You can view the configuration by adding the configuration name:
[mxadmin@mdw ~]$ gpconfig -s shared_buffers Values on all segments are consistent GUC : shared_buffers Master value: 1078464kB Segment value: 1078464kB
#### 1.4.2 Modify the configuration
Modify the configuration via `gpconfig -c <config name> -v <value>`:
[mxadmin@mdw ~]$ gpconfig -c shared_buffers -v 128MB 20210723:17:13:35:004318 gpconfig:sdw2:mxadmin-[INFO]:-completed successfully with parameters '-c shared_buffers -v 128MB'
After modifying the configuration, you must restart the cluster before it can take effect:[mxadmin@mdw ~]$ gpstop -ar
After restarting, check the configuration:[mxadmin@mdw ~]$ gpconfig -s shared_buffers Values on all segments are consistent GUC : shared_buffers Master value: 128MB Segment value: 128MB
>***Notes!***
For detailed usage methods of `gpconfig`, please refer to [Document](/doc/4.8/tools/gpconfig).

## 2 Graphical operation and maintenance management
Understanding cluster operation and maintenance can not only perform basic management operations on the cluster, but also helps to clearly understand the operating status of the database, such as whether the node's operating pressure is too high, whether the instance's operation is stable, etc.
In order to achieve a better user operation and maintenance experience, YMatrix provides core indicator monitoring views and database topology views, periodically collecting indicators such as CPU occupancy and memory occupancy and instance operation status, and displaying them in real time, so that you can observe the database operation status in a more intuitive way.
### 2.1 Preparation
First, you need to log in to the graphical interface. Enter the IP of the machine where the graphical interface MXUI process is located (the default is the IP of Master) and the port number:
http://
### 2.2 Cluster Management
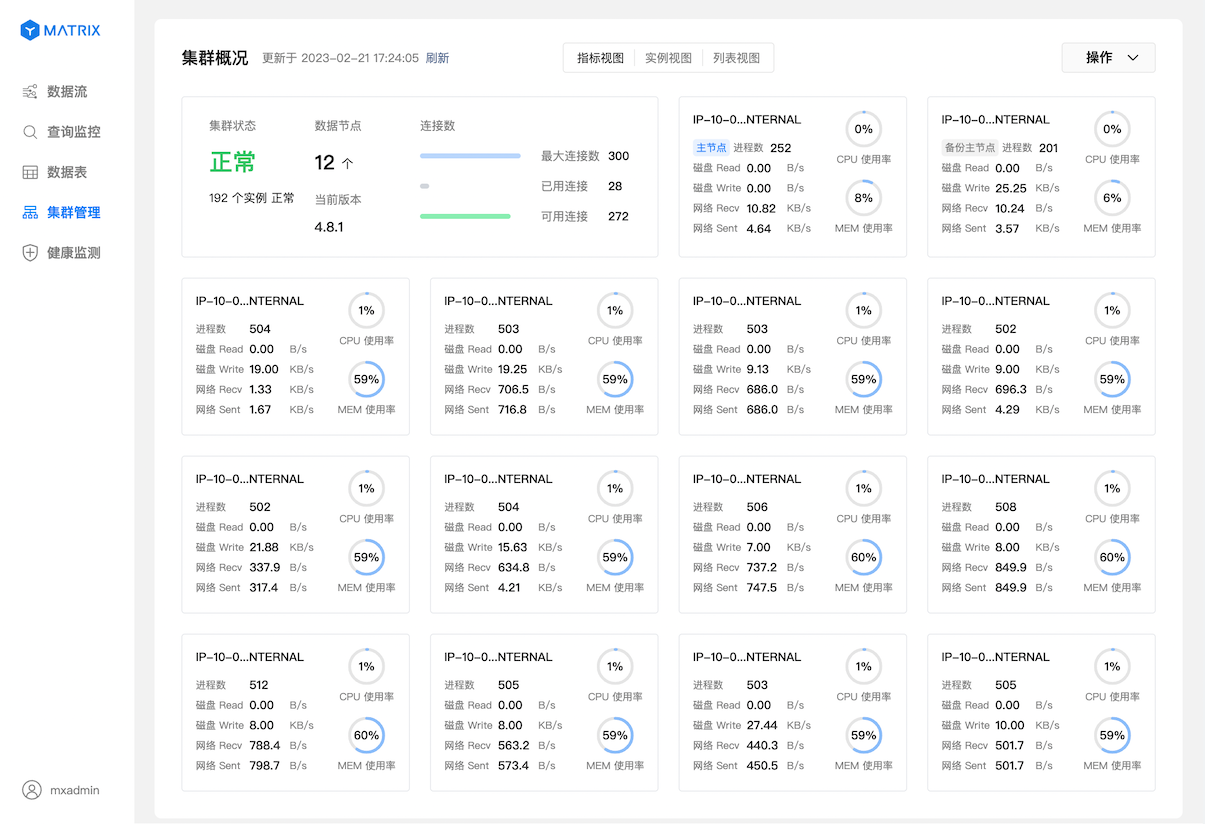
#### 2.2.1 Indicator View
After successfully logging in, enter the "Cluster Management" page, and the "Metrics View" is displayed by default, including 2 parts:
1. Cluster information: including cluster status, data, quantity and database version information.
2. Indicator information: resource usage of database connections, core indicator information of each node. YMatrix automatically collects and displays the indicator information every 5 seconds, including CPU usage, memory usage, disk I/O, network I/O, connection number, etc.
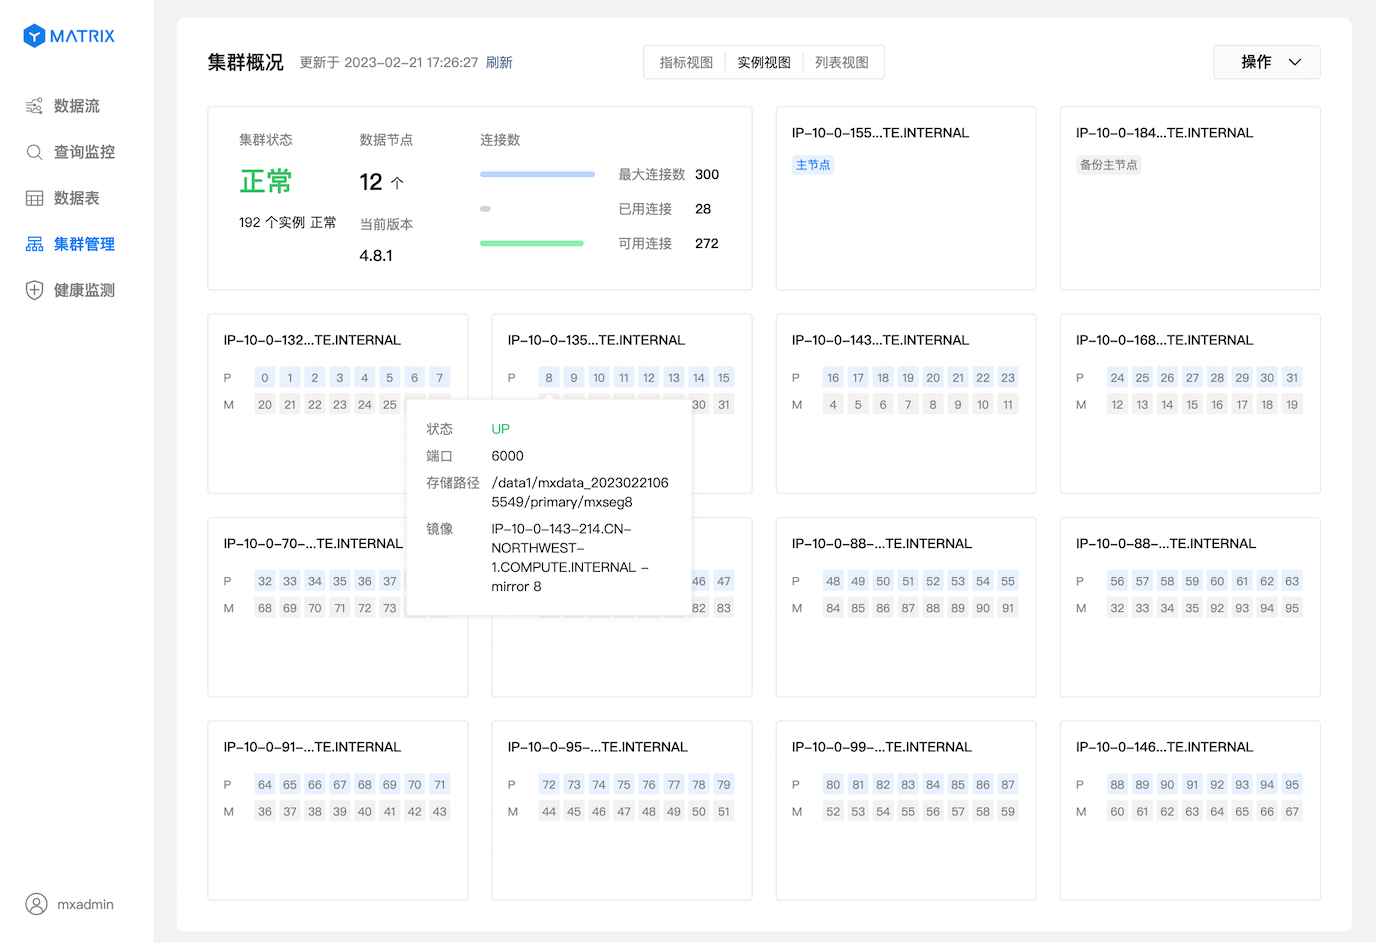
#### 2.2.2 Instance View
Switch to "Instance View", and the information of each node is switched from the indicator to the status and distribution of the instance.

The mouse is suspended in any instance to obtain detailed information about the instance.
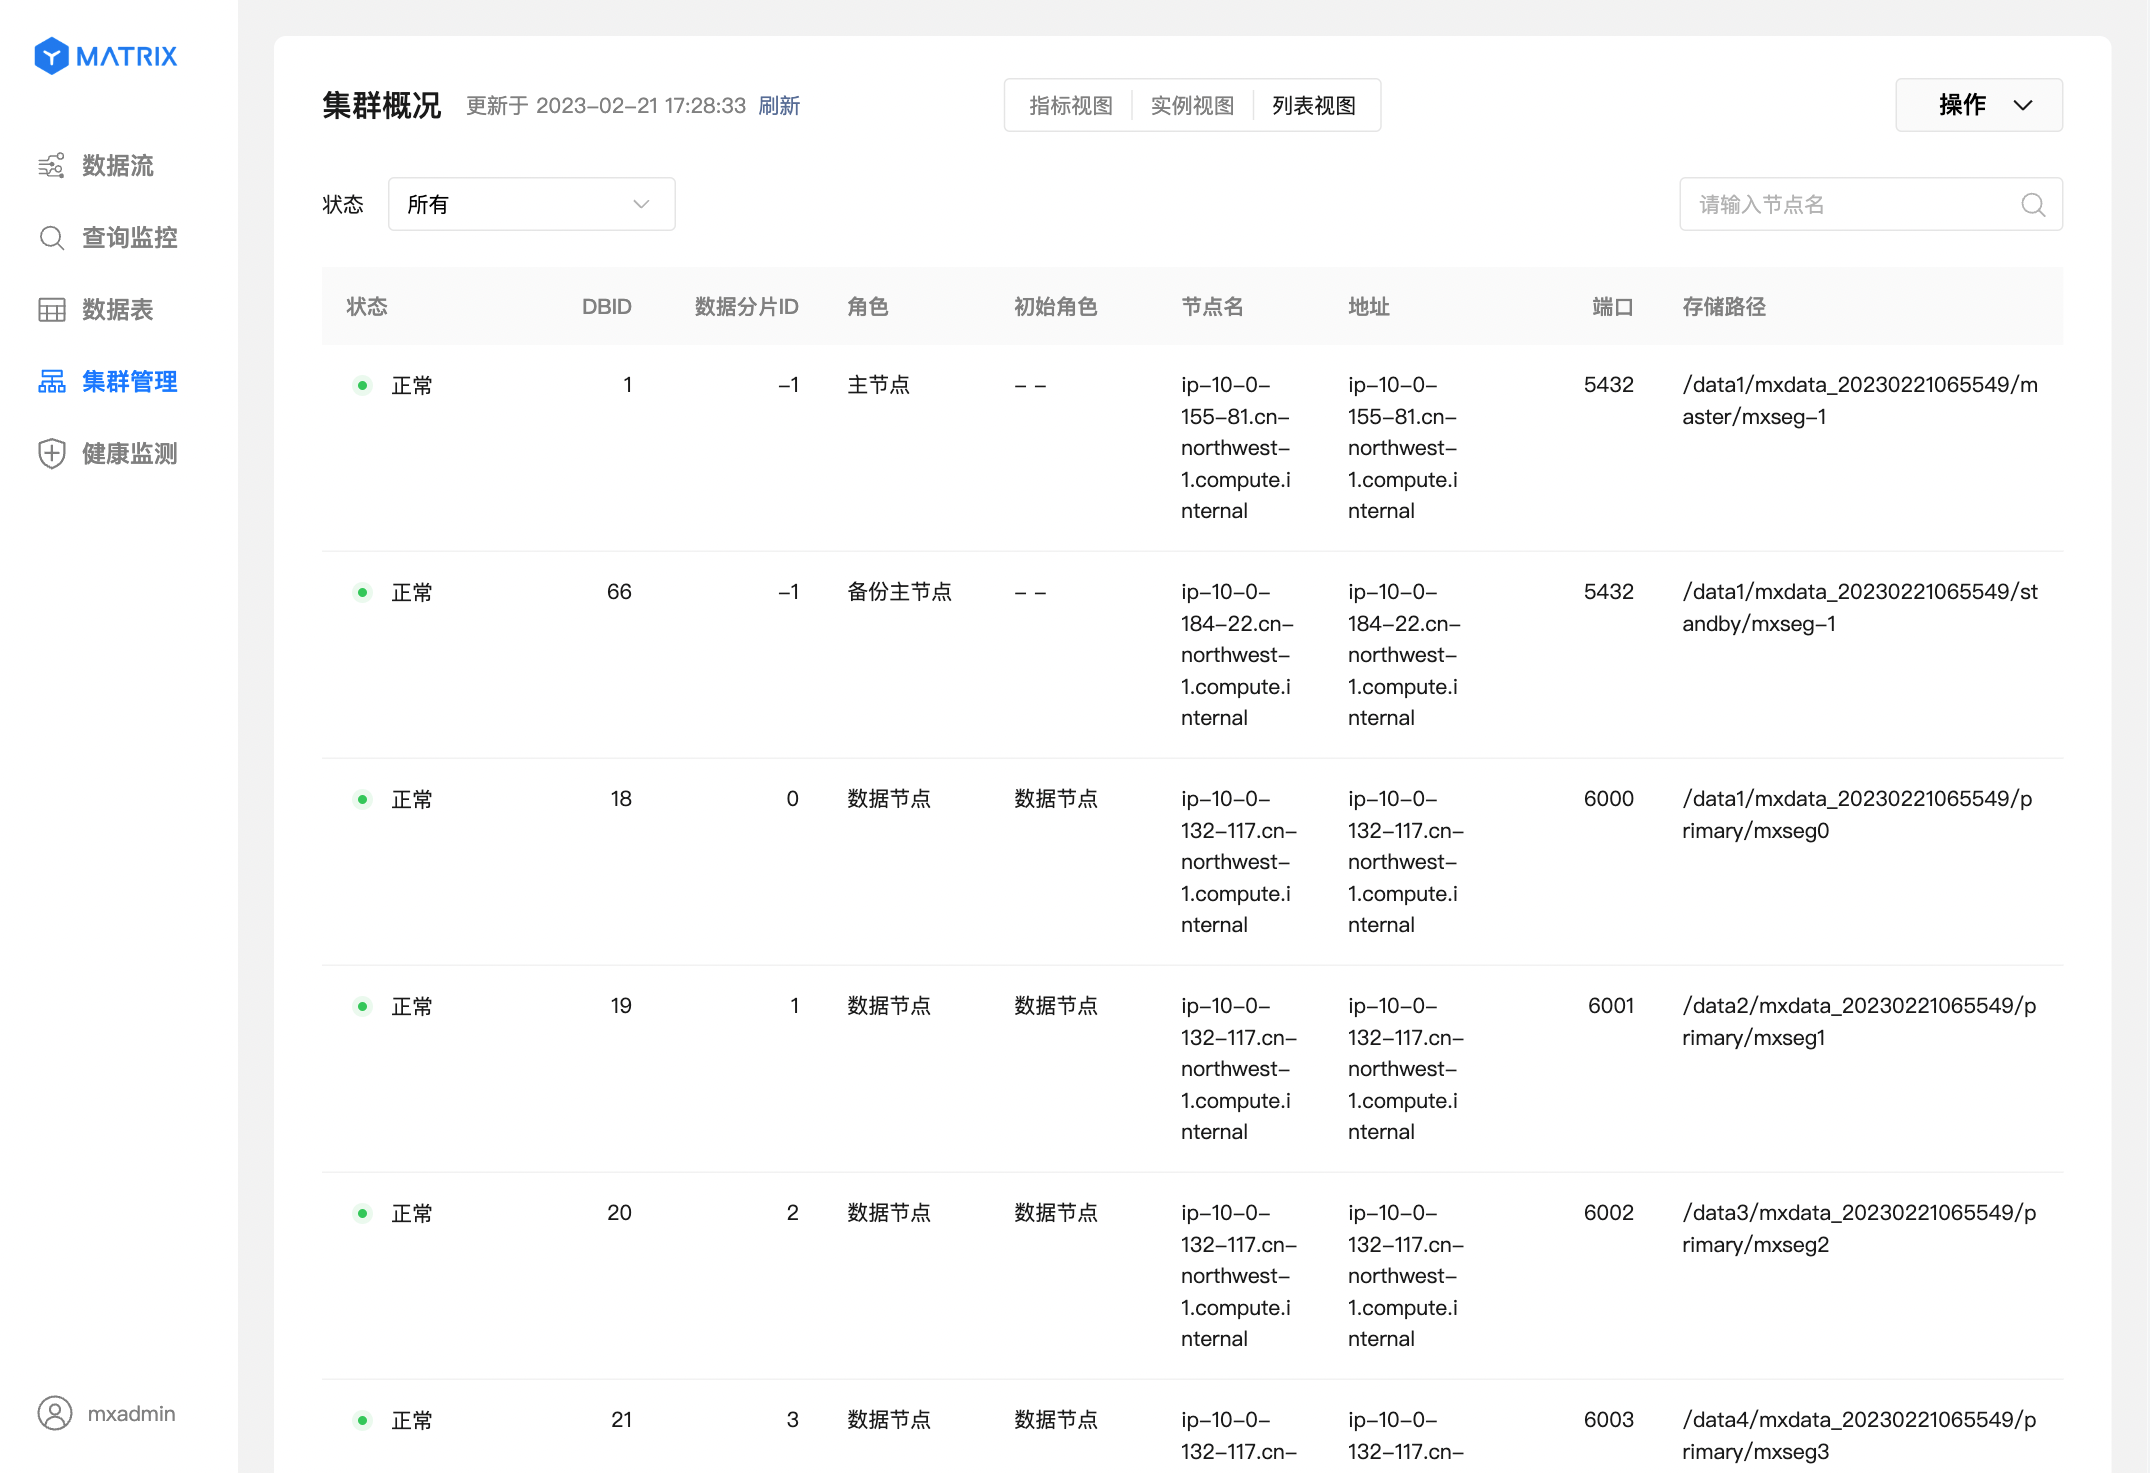
#### 2.2.3 List View
Switch to "List View", and displays the information of each node in the list form such as the status of the instance, DBID, port, storage path, etc.