It can be imagined that when you are driving a new energy vehicle on the highway, the data collector under your feet collects 80 data through 80 indicators set in advance in one second, with a total size of 2KB. You can observe these data that are constantly being returned within one minute, and use them to analyze any situation you want to know in real time, but before that, you must write and save precious data through a reliable database. There is no doubt that the timing database needs to be connected to a large amount of real-time data of devices, and loading performance is crucial! In this section, you will use MatrixGate and MatrixBench, the advanced components in MatrixDB, to conduct powerful data access performance testing, providing reliable guarantees for subsequent data analysis. Our physical machine hardware testing environment is as follows. The hardware environment parameters may affect the tool configuration parameters. Remember to choose the one that suits you.
The machine configuration is as follows:
| Parameters | Configuration |
|---|---|
| Number of CPU cores | 2 physical cores 32 logical cores |
| CPU Platform | Intel(R) Xeon(R) Gold 5218 CPU @ 2.30GHz |
| Memory | 256GB |
| Storage capacity | 9.0TB (1.4 GB/sec write, 3.3 GB/sec read) |
| Linux distribution | CentOS Linux release 7.8.2003 (Core) |
| linux kernel | 3.10.0-1127.el7.x86_64 |
MatrixGate is abbreviated as mxgate. It is a high-performance streaming data loading server located in bin/mxgate in the MatrixDB installation directory. This tool will give full play to the parallel processing performance of distributed databases and is a necessary tool for data loading in production environments. During the test, mxgate will work with mxbench's data writing tool writer to write the data generated by the random data generator generator at high speed.
For more information, please see mxgate
mxbench is a stress measurement tool for data loading and querying. It can configure and quickly generate random data based on the number of devices, time range, number of indicators, etc. you want, automatically create data tables, and perform data loading and querying in serial or concurrently. You can configure and run mxbench through the command line, and you can also write it into specific configuration files to follow your personal habits. The mxbench tool is located in bin/mxbench in the MatrixDB installation directory.
MatrixDB: stand-alone deployment, master + 6 segments
Notes!
You need to deploy MatrixGate, MatrixBench and MatrixDB cluster on the same machine.
We prepared three timing scenario test cases with different metric sizes. At the end of this section, we will intuitively compare the write speed of MatrixDB under different metric scales.
Notes!
Before using mxbench for loading tests, you need to prepare the mxbench test environment: including a normally running MatrixDB cluster, as well as the configured related environment variables. This step is a necessary step! mxgate does not require manual configuration, because while starting mxbench, you have already gained the configuration and startup of mxgate.
For cluster deployment methods, please refer to Cluster Deployment, for mxbench configuration methods, please refer to mxbench - 1 Preparation
The commonly used parameter configuration of mxbench is mainly divided into two parts: global configuration and plug-in-based local configuration. The global configuration includes two sections: database and global; the plug-in configuration includes the data generator generator, the data writing tool writer, and the data query tool benchmark.
Since the main purpose of this section is to experience MatrixDB loading performance, the mxbench query tool benchmark will not be described in detail. For reference information about benchmark, please refer to mxbench - 2.2.5 benchmark
The details are as follows:
| Parameter name | Default value | Parameter meaning |
|---|---|---|
| --database | The default value is the environment variable PG_DATABASE, if not set, it is postgres | Target database name |
| --db-master-port | The port number of the instance must be consistent with the port number configured in the environment variable | |
| --db-user | Check the current username and use it as the default | Username |
| --workplace | /tmp/mxbench | csv data file, query file directory |
| --watch | true | Whether to enable process observation, it is enabled by default |
| --simultaneous-loading-and-query | false | Whether to perform data loading and querying at the same time. The default value is false. Data loading is performed first, and query is performed after execution |
| --table-name | Target table name, default value is empty, must be specified manually | |
| --tag-num | 25000 | Number of target devices |
| --metrics-type | float8 | Metric type, only supports "int4", "int8", "float4", "float8", 4 types |
| --total-metrics-count | 300 | Total number of indicators |
| --ts-start | Generate data timestamp start time | |
| --ts-end | Generate data timestamp termination time | |
| --ts-step-in-second | 1 | Acquire indicators every few seconds |
| --generator | telematics | Random data generator, generates timing data for Internet of Vehicles scenarios by default. You can also choose to read data from your own data file and send it to mxgate to load it. It is also allowed to not generate any data |
| --generator-batch-size | 1 | Under a specific timestamp, the data for each metric of each device is split into several pieces and uploaded to the cluster. The default value is 1, which means no splitting is done |
| --generator-disorder-ratio | 0 | The proportion of delayed reporting of data. Values 0 to 100. The default value is 0, which means there is no delayed reporting of data. By setting this parameter, you can simulate any delayed reporting status of the actual timing scenario according to your needs |
| --generator-empty-value-ratio | 90 | Null value rate for each row of data. The values are 0 to 100. The default value is 90, that is, 90% of the indicators will be empty. This parameter is to simulate the null value situation in the actual timing scenario |
| --generator-randomness | OFF | Randomness of indicator data. It is divided into four levels: OFF/S/M/L. The default is OFF, that is, the data value of each row is the same. The randomness of data at SMALL, MIDDLE, and LARGE levels increases in sequence |
| --writer | http | Data writing tool. You can choose in which mode to start mxgate and receive data from the data source. |
You can find more configurable parameters in mxbench - 2 Usage, or enter mxbench --help on the command line to see the full usage.
Use the following command line to configure and run mxbench, please refer to the above table and adjust the parameter values according to actual conditions. Since mxgate and mxbench are deployed on a machine, the writer tool does not need to establish a network connection or transmit it through the network, but can directly utilize the pipeline provided by the Linux system. Therefore, we use the "stdin" parameter in the example, which is light and convenient.
[mxadmin@mdw ~]$ mxbench run \
  --db-database "load_test" \
  --db-master-port 5432 \
  --db-master-host "mdw" \
  --db-user "mxadmin" \
  --workspace "/tmp/mxbench/workspace" \
  --watch \
  --simultaneous-loading-and-query \
  --table-name "test_table" \
  --tag-num 100000 \
  --metrics-type "float8" \
  --total-metrics-count 10 \
  --ts-start "2022-04-19 00:00:00" \
  --ts-end "2022-04-19 00:01:00" \
  --generator "telematics" \
  --generator-batch-size 1 \
  --generator-disorder-ratio 0 \
  --generator-empty-value-ratio 0 \
  --generator-randomness "OFF" \
  --writer "stdin"
If you do not set watch to "false", you can see progress information in real time every 5 seconds during the run, and you will get the following statistics after completion:
┌───────────────────────────────────────────────────────┐
│             Summary Report for STDIN Writer            │
├─────────────────────────────────┬─────────────────────┤
│ start time:                     │ 2022-07-21 15:14:08 │
├─────────────────────────────────┼─────────────────────┤
│ stop time:                      │ 2022-07-21 15:14:27 │
├─────────────────────────────────┼─────────────────────┤
│ size written to MxGate (bytes): │ 695333400           │
├─────────────────────────────────┼─────────────────────┤
│ lines inserted:                 │ 6000000             │
├─────────────────────────────────┼─────────────────────┤
│ compress ratio:                 │ 5.399120 : 1        │
└─────────────────────────────────┴─────────────────────┘
Wirter statistical report output interpretation:
| Parameter name | Parameter meaning |
|---|---|
| start time | data loading start time |
| end time | Data loading termination time |
| size written to MxGate (bytes) | Number of bytes to write data to mxgate |
| lines inserted | Number of lines (number of rows) of inserted data |
| compress ratio | compression ratio, that is, the ratio of the size of the data written to mxgate to the size of the table in the actual database |
The actual running time is related to the overall loading of data and machine performance. As long as you don’t turn off the watch, you can see the progress information of data writing in real time at 5s intervals, and always grasp the writing speed and time!
Notes!
After mxbench is started, the pressure measurement will be continued until all the data from the timestamp value from ts-start to ts-end is loaded. You can also choose to press ctrl-c on the keyboard to end the run in advance.
If you think it is too complicated to write large-scale command lines directly, you can also choose the following method: Create the configuration file mxbench.conf, write the parameters in, and then run it.
[mxadmin@mdw ~]$ mxbench --config mxbench.confNotes!
You may encounter "stuck" problems when writing data, and the progress information will continue to be printed, but there is no substantial writing progress. Don't panic, you can run the following statement to view the run log and troubleshoot problems.[mxadmin@mdw ~]$ cd ~/gpAdminLogs/4.2.2 10w equipment 100 indicators
[mxadmin@mdw ~]$ mxbench run \
--db-database "load_test" \
--db-master-port 5432 \
--db-master-host "mdw" \
--db-user "mxadmin" \
--workspace "/tmp/mxbench/workspace" \
--watch \
--simultaneous-loading-and-query \
--table-name "test_table2" \
--tag-num 100000 \
--metrics-type "float8" \
--total-metrics-count 100 \
--ts-start "2022-04-19 00:00:00" \
--ts-end "2022-04-19 00:01:00" \
--generator "telematics" \
--generator-batch-size 1 \
--generator-disorder-ratio 0 \
--generator-empty-value-ratio 0 \
--generator-randomness "OFF" \
--writer "stdin"
After completion, you will get the following statistics:
┌───────────────────────────────────────────────────────┐
│             Summary Report for STDIN Writer            │
├─────────────────────────────────┬─────────────────────┤
│ start time:                     │ 2022-07-21 15:19:48 │
├─────────────────────────────────┼─────────────────────┤
│ stop time:                      │ 2022-07-21 15:21:02 │
├─────────────────────────────────┼─────────────────────┤
│ size written to MxGate (bytes): │ 5555333400          │
├─────────────────────────────────┼─────────────────────┤
│ lines inserted:                 │ 6000000             │
├─────────────────────────────────┼─────────────────────┤
│ compress ratio:                 │ 25.519937 : 1       │
└─────────────────────────────────┴─────────────────────┘
#### 4.2.3 10w equipment 1000 indicators[mxadmin@mdw ~]$ mxbench run \ --db-database "load_test" \ --db-master-port 5432 \ --db-master-host "mdw" \ --db-user "mxadmin" \ --workspace "/tmp/mxbench/workspace" \ --watch \ --simultaneous-loading-and-query \ --table-name "test_table3" \ --tag-num 100000 \ --metrics-type "float8" \ --total-metrics-count 1000 \ --ts-start "2022-04-19 00:00:00" \ --ts-end "2022-04-19 00:01:00" \ --generator "telematics" \ --generator-batch-size 1 \ --generator-disorder-ratio 0 \ --generator-empty-value-ratio 0 \ --generator-randomness "OFF" \ --writer "stdin"
After completion, you will get the following statistics:┌──────────────────────────────────────────────────────────────────────────────┐ │ Summary Report for STDIN Writer │ ├──────────────────────────┬────────────────────────────────────────────────────────� │ start time: │ 2022-07-21 15:22:27 │ ├───────────────────────────────────────────────────────────────────────────────────� │ stop time: │ 2022-07-21 15:33:40 │ ├───────────────────────────────────────────────────────────────────────────────────� │ size written to MxGate (bytes): │ 54305333400 │ ├───────────────────────────────────────────────────────────────────────────────────� │ lines inserted: │ 6000000 │ ├───────────────────────────────────────────────────────────────────────────────────� │ compress ratio: │ 47.488209 : 1 │ └──────────────────────────────────────────────────────────────────────────────┘
According to the above writer statistical report, we provide you with a more intuitive line chart comparison. You can clearly understand the powerful data loading performance of MatrixDB and how it will grow with the scale of the indicators. In actual scenarios, you are more confident about how many indicators are set.
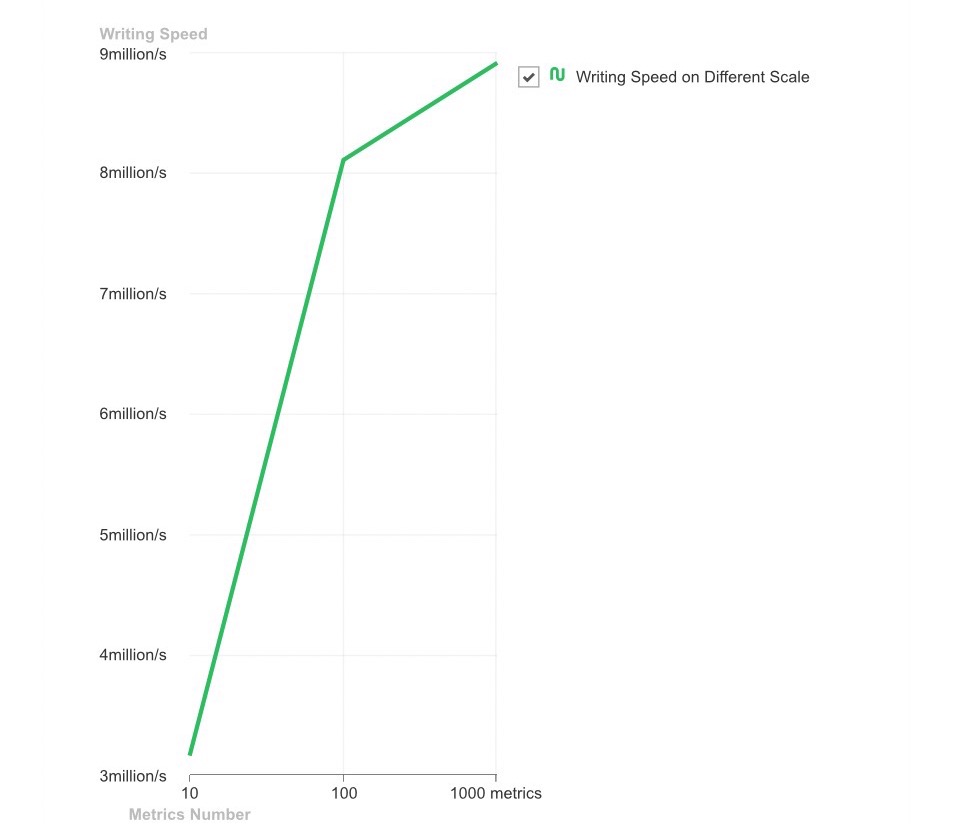
The data in a timing scenario is a data point with a time stamp attribute, which represents the value of a certain indicator at a certain time. If the timestamp attribute is discarded, it cannot be called data in a timing scenario. After understanding the concept of data points, you can better understand the above figure. The horizontal axis in the figure is the different indicator scales set in the use case, corresponding to the parameter total-metrics-count, and the vertical axis is the writing speed, indicating the number of data points that can be written per second per unit time. You must have understood that as the scale of the indicator expands, the writing speed shows a very rapid growth, but if there is more indicator data, the speed growth will be more limited. However, no matter what, MatrixDB's writing speed is millions. Compared to using INSERT statements to insert one by one with a bitter face, why not try driving MarixDB on the highway!