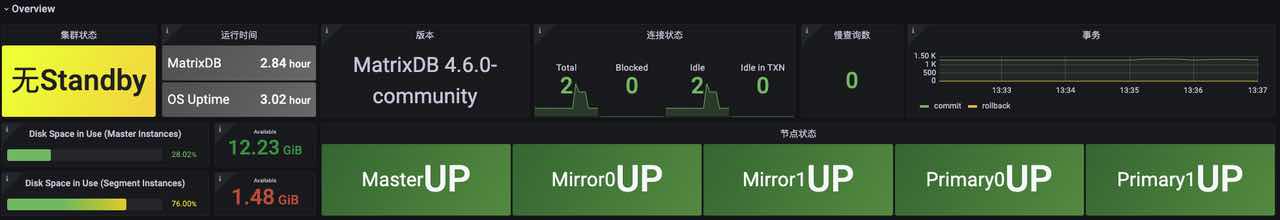
 The overview section displays the overall operating status of the cluster, including:
| Parameter name | Description | Reference Alarm Threshold |
|---|---|---|
| Cluster status | Cluster node status, including: 0: Normal 1: No Standby 2: No Mirror 10: Distribution unbalanced (Some nodes are down and restored, and the master-slave role is not rebalanced) 11: There are master-slave asynchronous nodes (Some mirror nodes are not synchronous with primary) 12: Only Master (The cluster only starts the Master node, usually used during diagnosis) 20: Segment downtime (There is an unavailable Segment node, the cluster is not available) |
Segment downtime is a serious event, and an alarm is required |
| Runtime | Includes MatrixDB's run time since startup and master host operating system run time | |
| Version | Version of MatrixDB | |
| Connection status | Connection status displays the number of connections in the database system, including: total number of connections, number of blocked connection queries, number of idle connections, number of idle connections in transactions | |
| Slow query | In the current system, the number of queries that have been executed for more than 1 day | greater than 0 means that there are particularly slow queries and an alarm is required |
| Transactions | Statistics on transaction submission and rollback count | Rollback alarm threshold can be set |
| Disk usage | Disk usage and remaining space for master nodes and segment nodes | Alarms are recommended to set directly in node_exporter |
| Node status | State of each node, including: 0: UP (Normal) 10: Switched (Role swap, indicating that master-slave switching has occurred and needs to be rebalanced) 11: Resync (Master-slave synchronization) 20: Down (Downtime) |
11 and 20 need to add alarms |
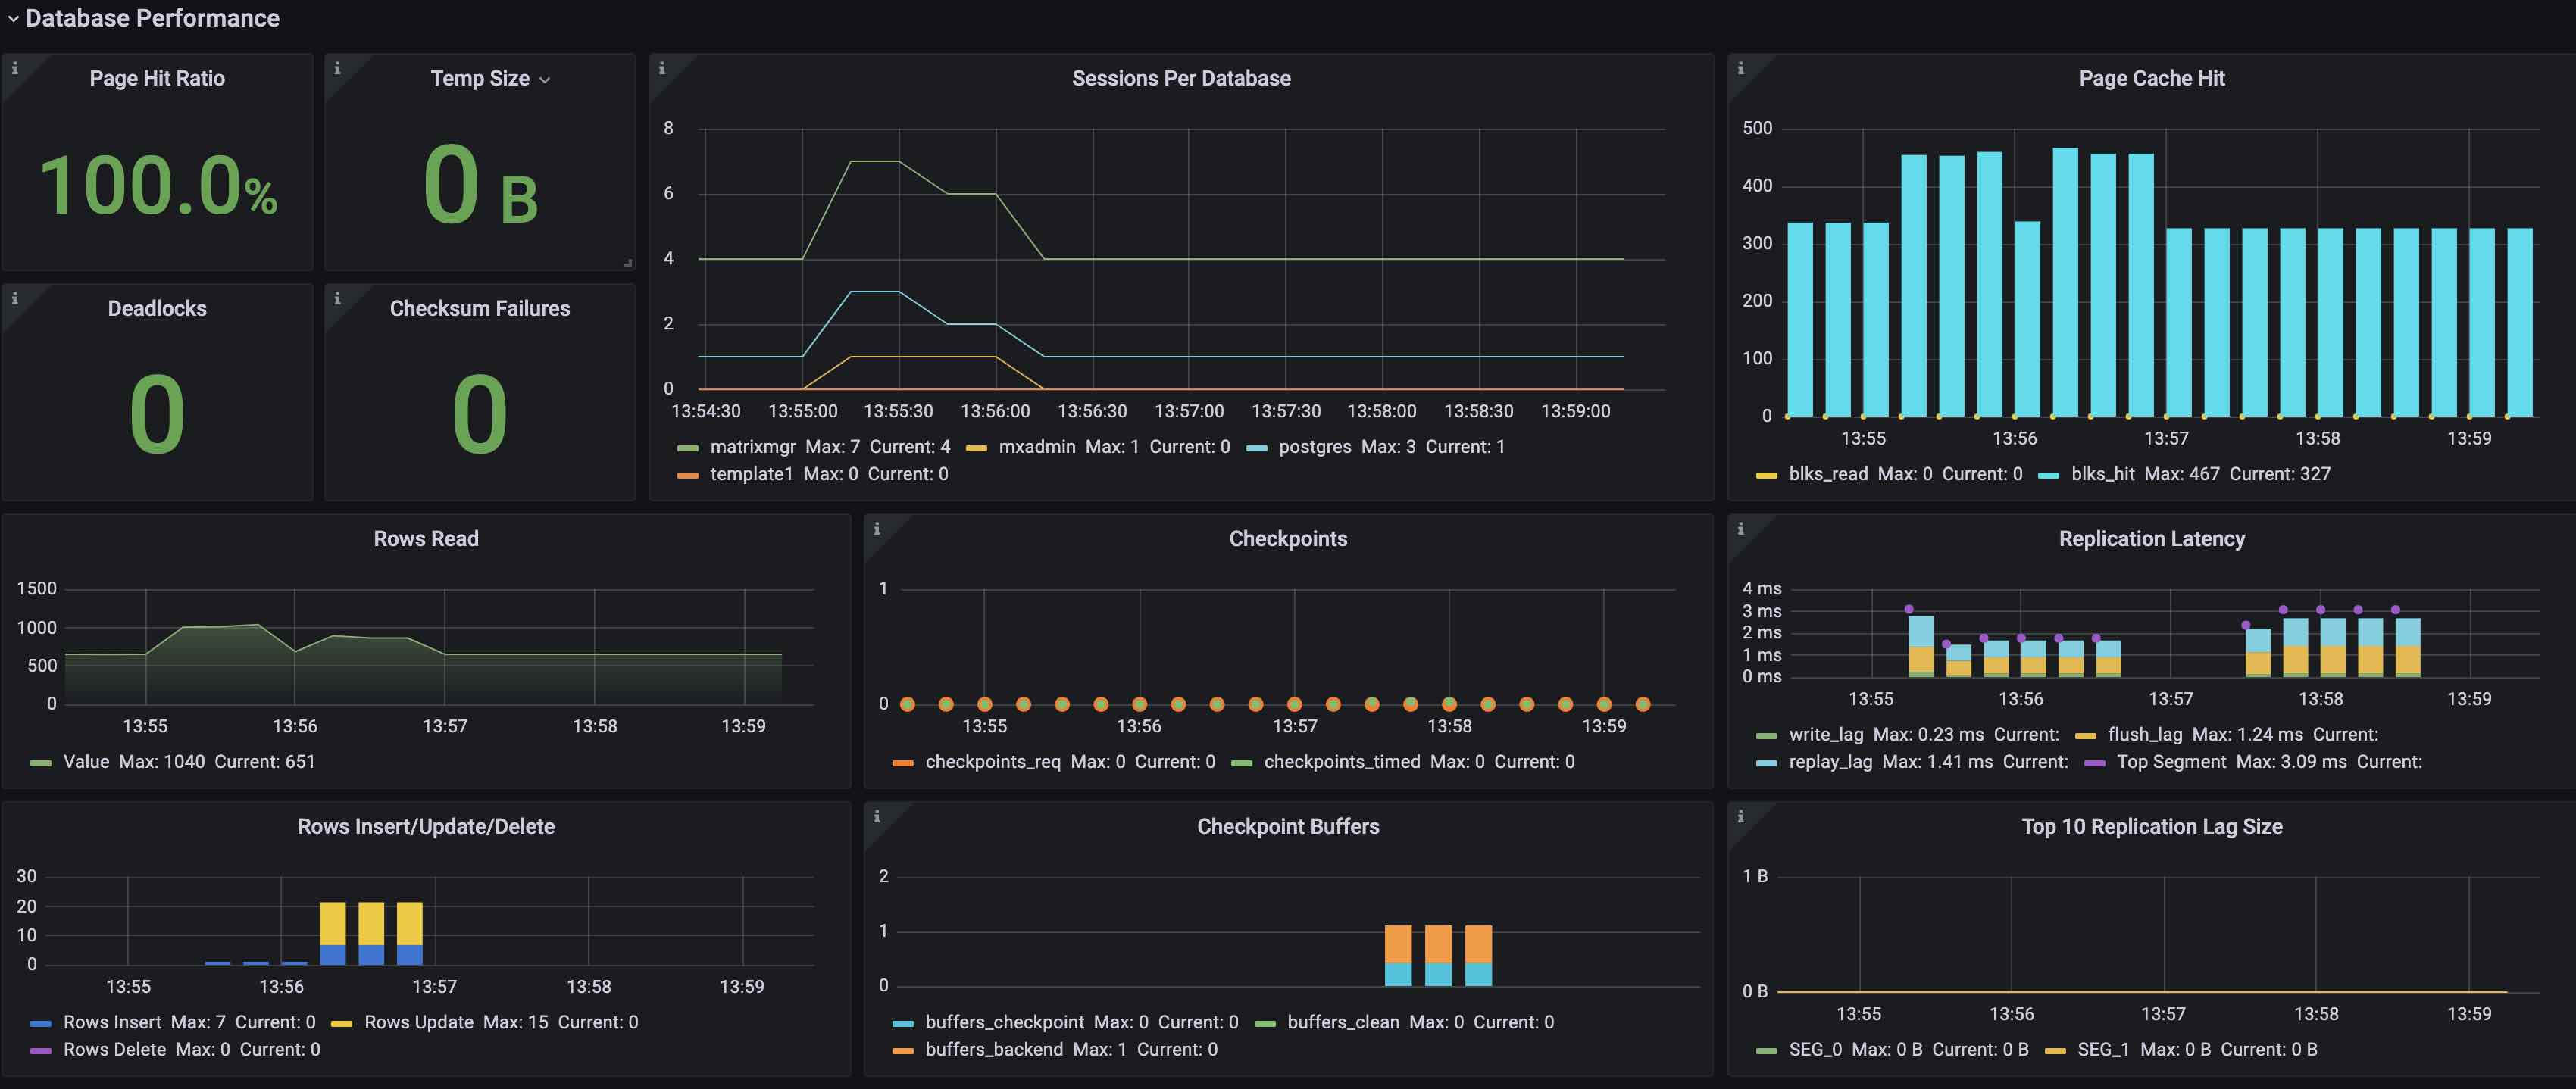 The Database Performance section demonstrates database performance, including:
| Parameter name | Description | Reference Alarm Threshold |
|---|---|---|
| Page Hit Ratio | Hit Buffer Ratio when reading a data page | |
| Temp Size | Temp file usage | |
| Deadlocks | Number of deadlocks | Automatically greater than 0 |
| Checksum Failures | Number of data page verification failure | Automatically greater than 0 |
| Sessions Per Database | Number of connections per database | |
| Page Cache Hit | blks_hit: Number of hit caches when reading data pages blks_read: Number of times cache missed and disks to be read |
|
| Rows Read | Query read and return tuple number | |
| Checkpoints | checkpoints trigger times, including: checkpoints_req: manual trigger checkpoints_timed: periodic trigger |
|
| Replication Latency | Master-slave replication delay, unit ms write_lag: delay in log writing to mirror file cache flush_lag: delay in log flushing to mirror disk replay_lag: delay in log playback completion Top Segment: All nodes write_lag+flush_lag+replay_lag delay and maximum value |
Alarm threshold can be set according to the situation |
| Rows Insert/Update/Delete | Rows Insert: Insert number of rows Rows Update: Updating number of rows Rows Delete: Delete number of rows |
|
| Checkpoint buffers | Dirty page writing statistics buffers_checkpoint: checkpoint number of dirty pages buffers_clean: bgwriter number of dirty pages buffers_backend: backend process writing number of dirty pages |
|
| Top 10 Replication Lag Size | Statistics of the delay amount of the Top 10 nodes, the calculation method is the difference between the sent lsn and the replay lsn | The alarm threshold can be set according to the situation |
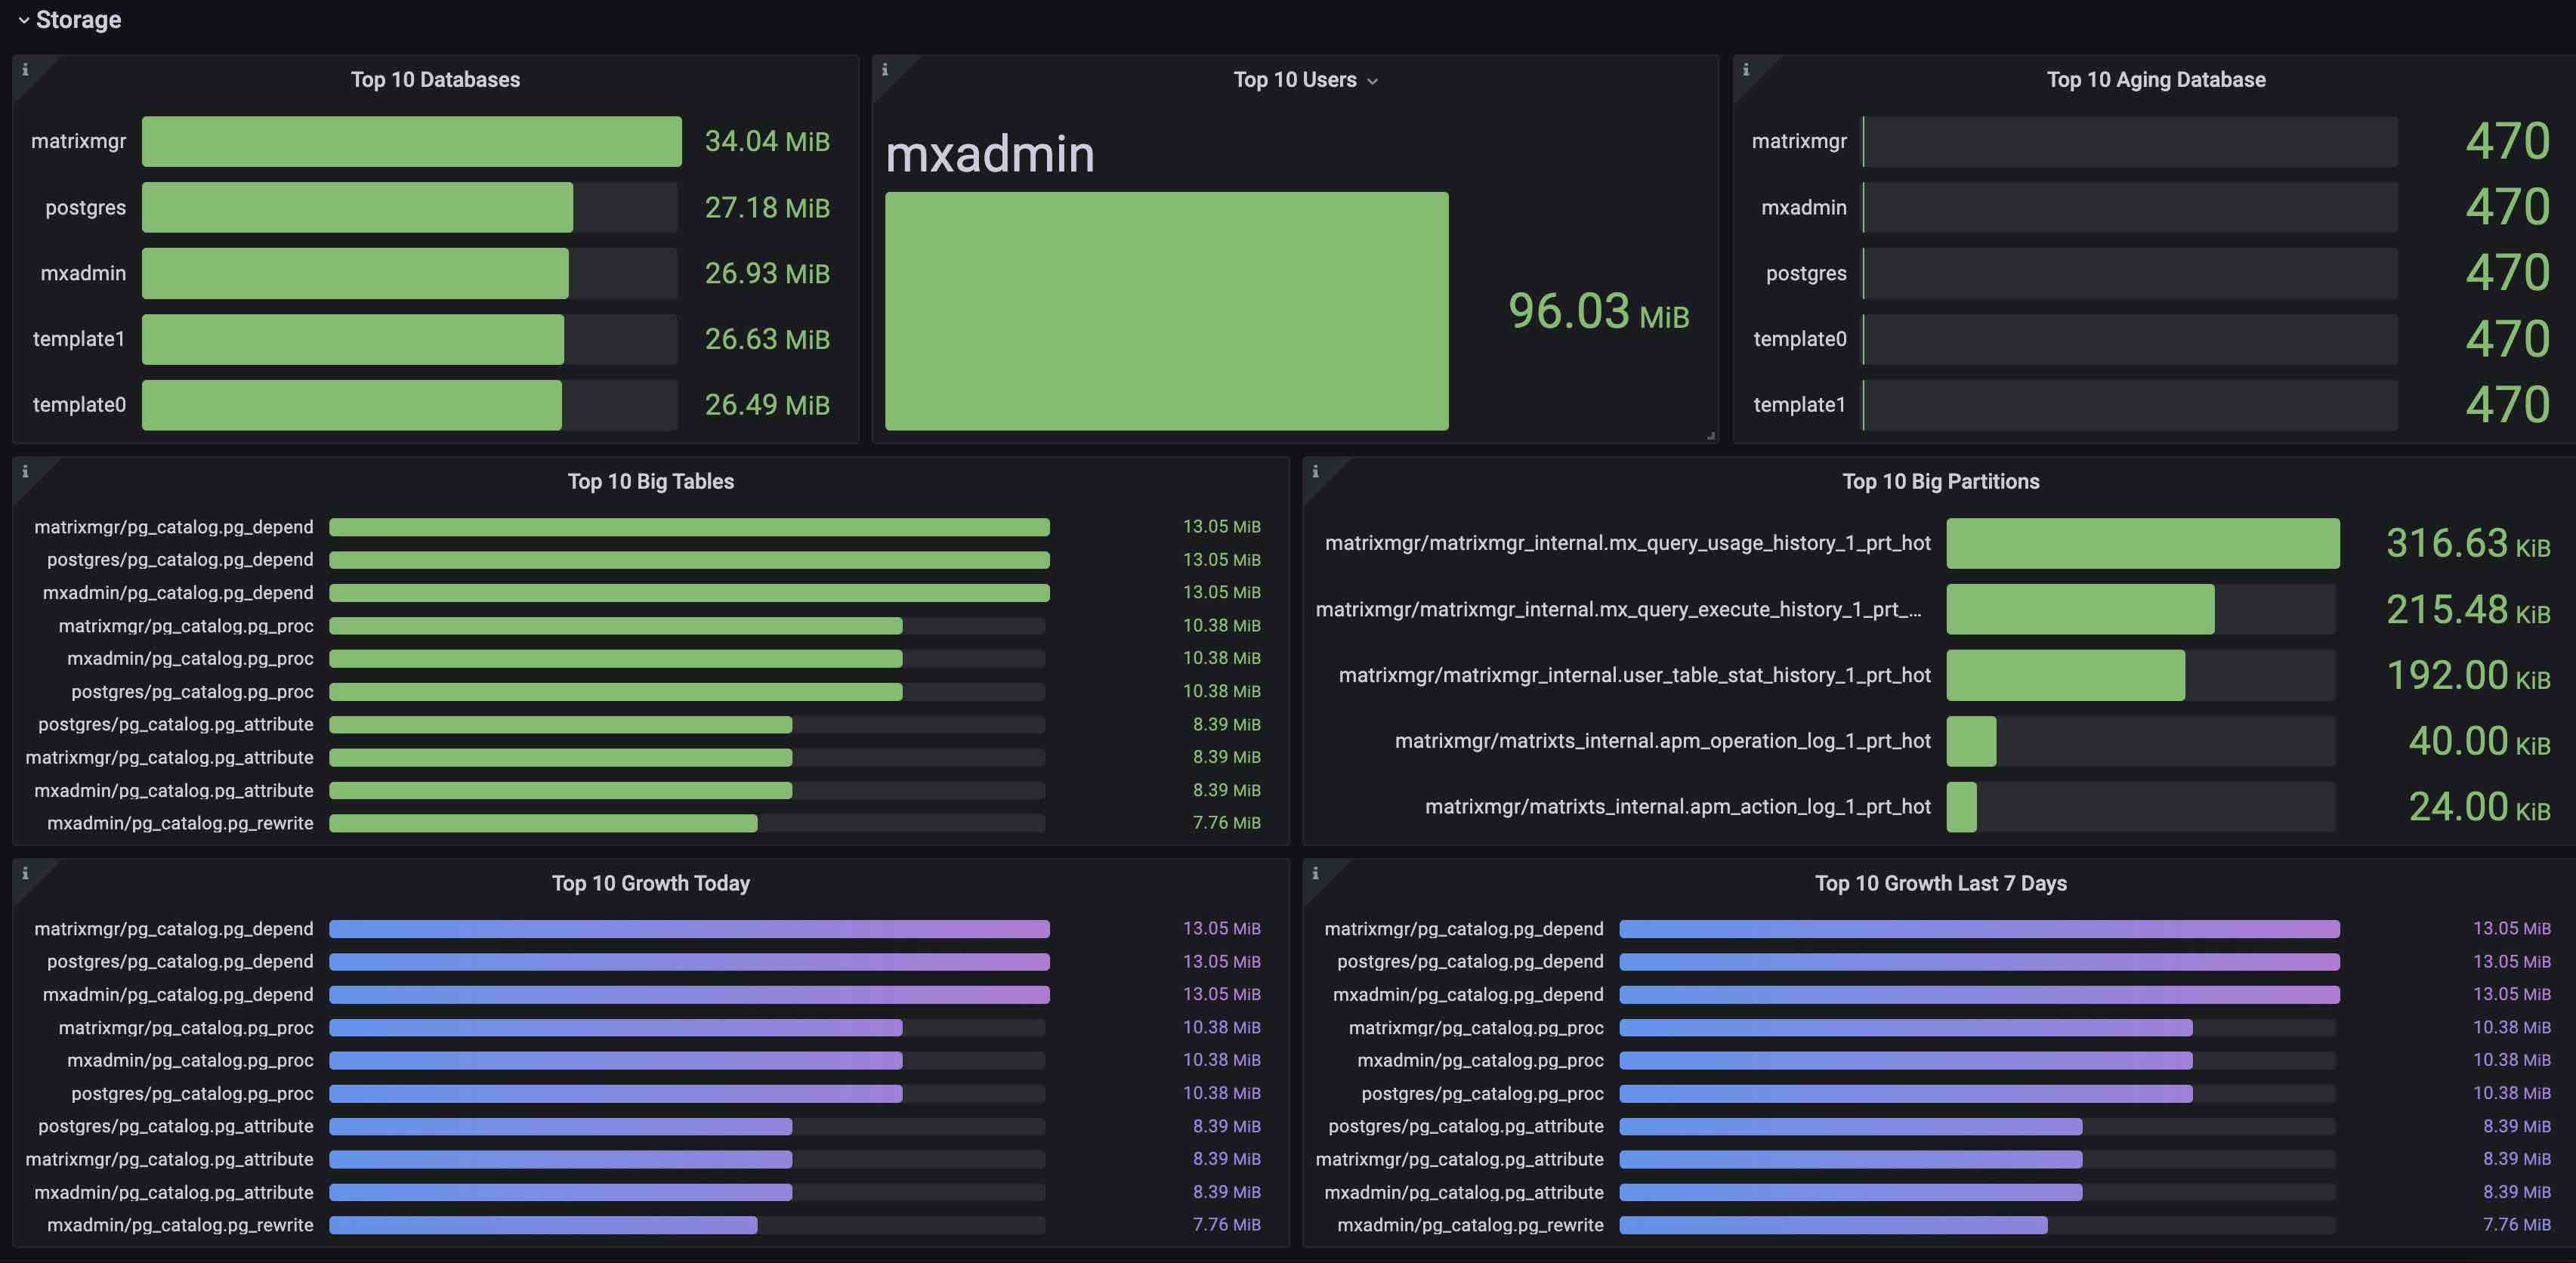 Storage section displays storage-related statistics, including:
| Parameter name | Description | Reference Alarm Threshold |
|---|---|---|
| Top 10 Databases | Top 10 Databases | |
| Top 10 Users | Top 10 User Generated Data Size | |
| Top 10 Aging Database | Top10 Database Age (transaction ID less than this value is replaced by Frozen) | |
| Top 10 Big Tables | Top 10 Database Table Size | |
| Top 10 Big Partitions | Top 10 Partition Table Size | |
| Top 10 Growth Today | Top 10 table size increments on the day | |
| Top 10 Growth Last 7 Days | Top 10 table size increments in the past 7 days |