Quick Start
Cluster Deployment
Data Model
Data Writing
Data Query
SQL Reference
Maintenance and Monitoring
Tool Guide
Troubleshooting
FAQ
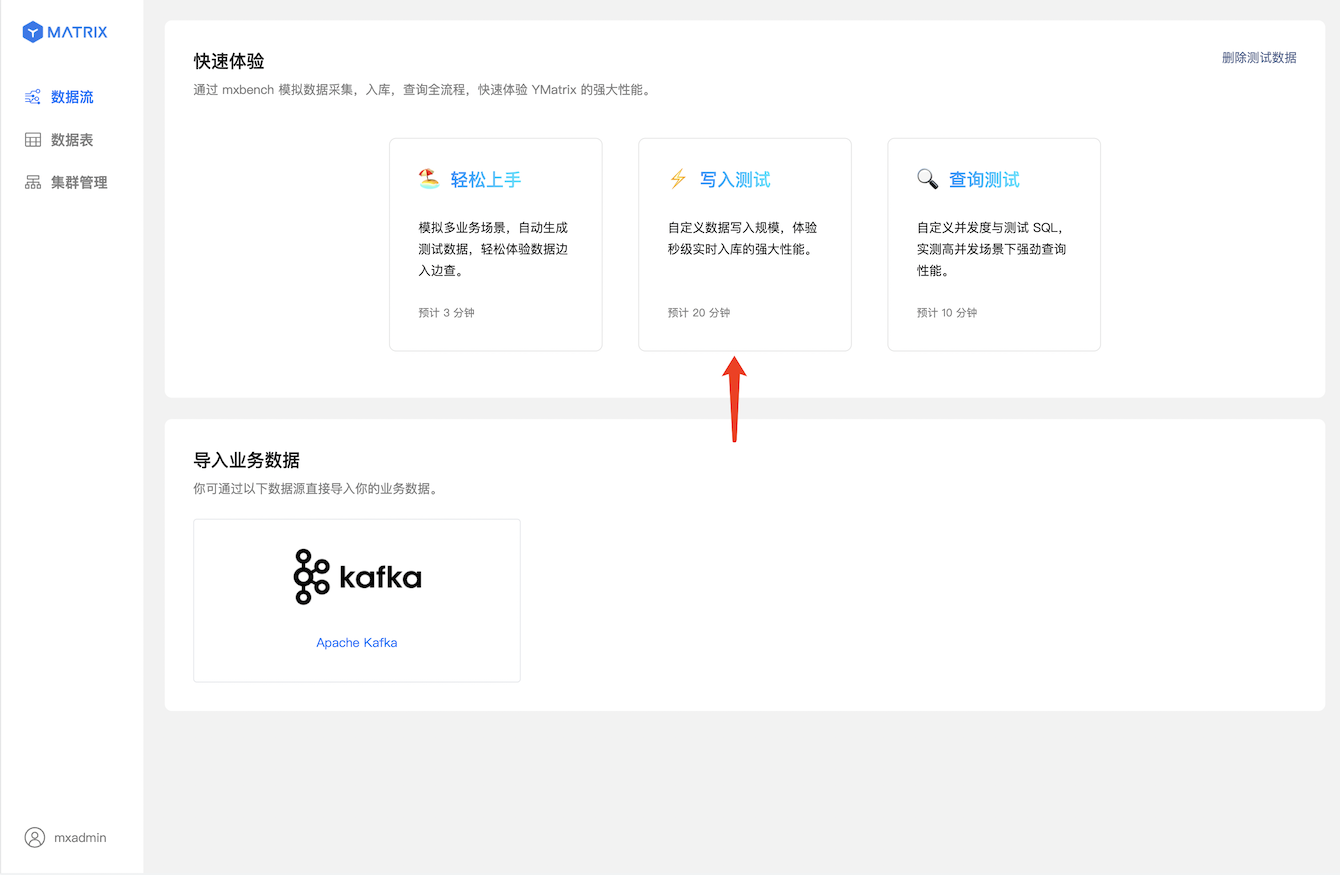
MatrixDB supports graphical experience database function, and customizes the data writing scale according to business scenarios on the page to experience MatrixDB's powerful data writing performance.
Notes!
The performance of the database also depends on the performance of the server, and we recommend using a physical machine to complete the test whenever possible.
Server Minimum configuration is as follows:
| CPU | Memory | Hard disk capacity |
|---|---|---|
| 8 cores | 16G | 50G |
Enter the IP of the machine where MatrixGate is located (the default is mdw's IP) and port number in the browser:
http://<IP>:8240After successfully logging in, enter the data flow list page

Select the Write Test module in the Quick Experience section.
You can customize the data writing amount and data characteristics based on the business scenario, and the general parameters include 4:
After filling, the page will display "Expected Generated Data". You can adjust the amount of generated data you expect by modifying the above 4 common parameters. At the same time, in order to meet the diversification of business scenario data characteristics, we provide personalized parameter settings, click "Advanced Settings", which contains 4 parameters:

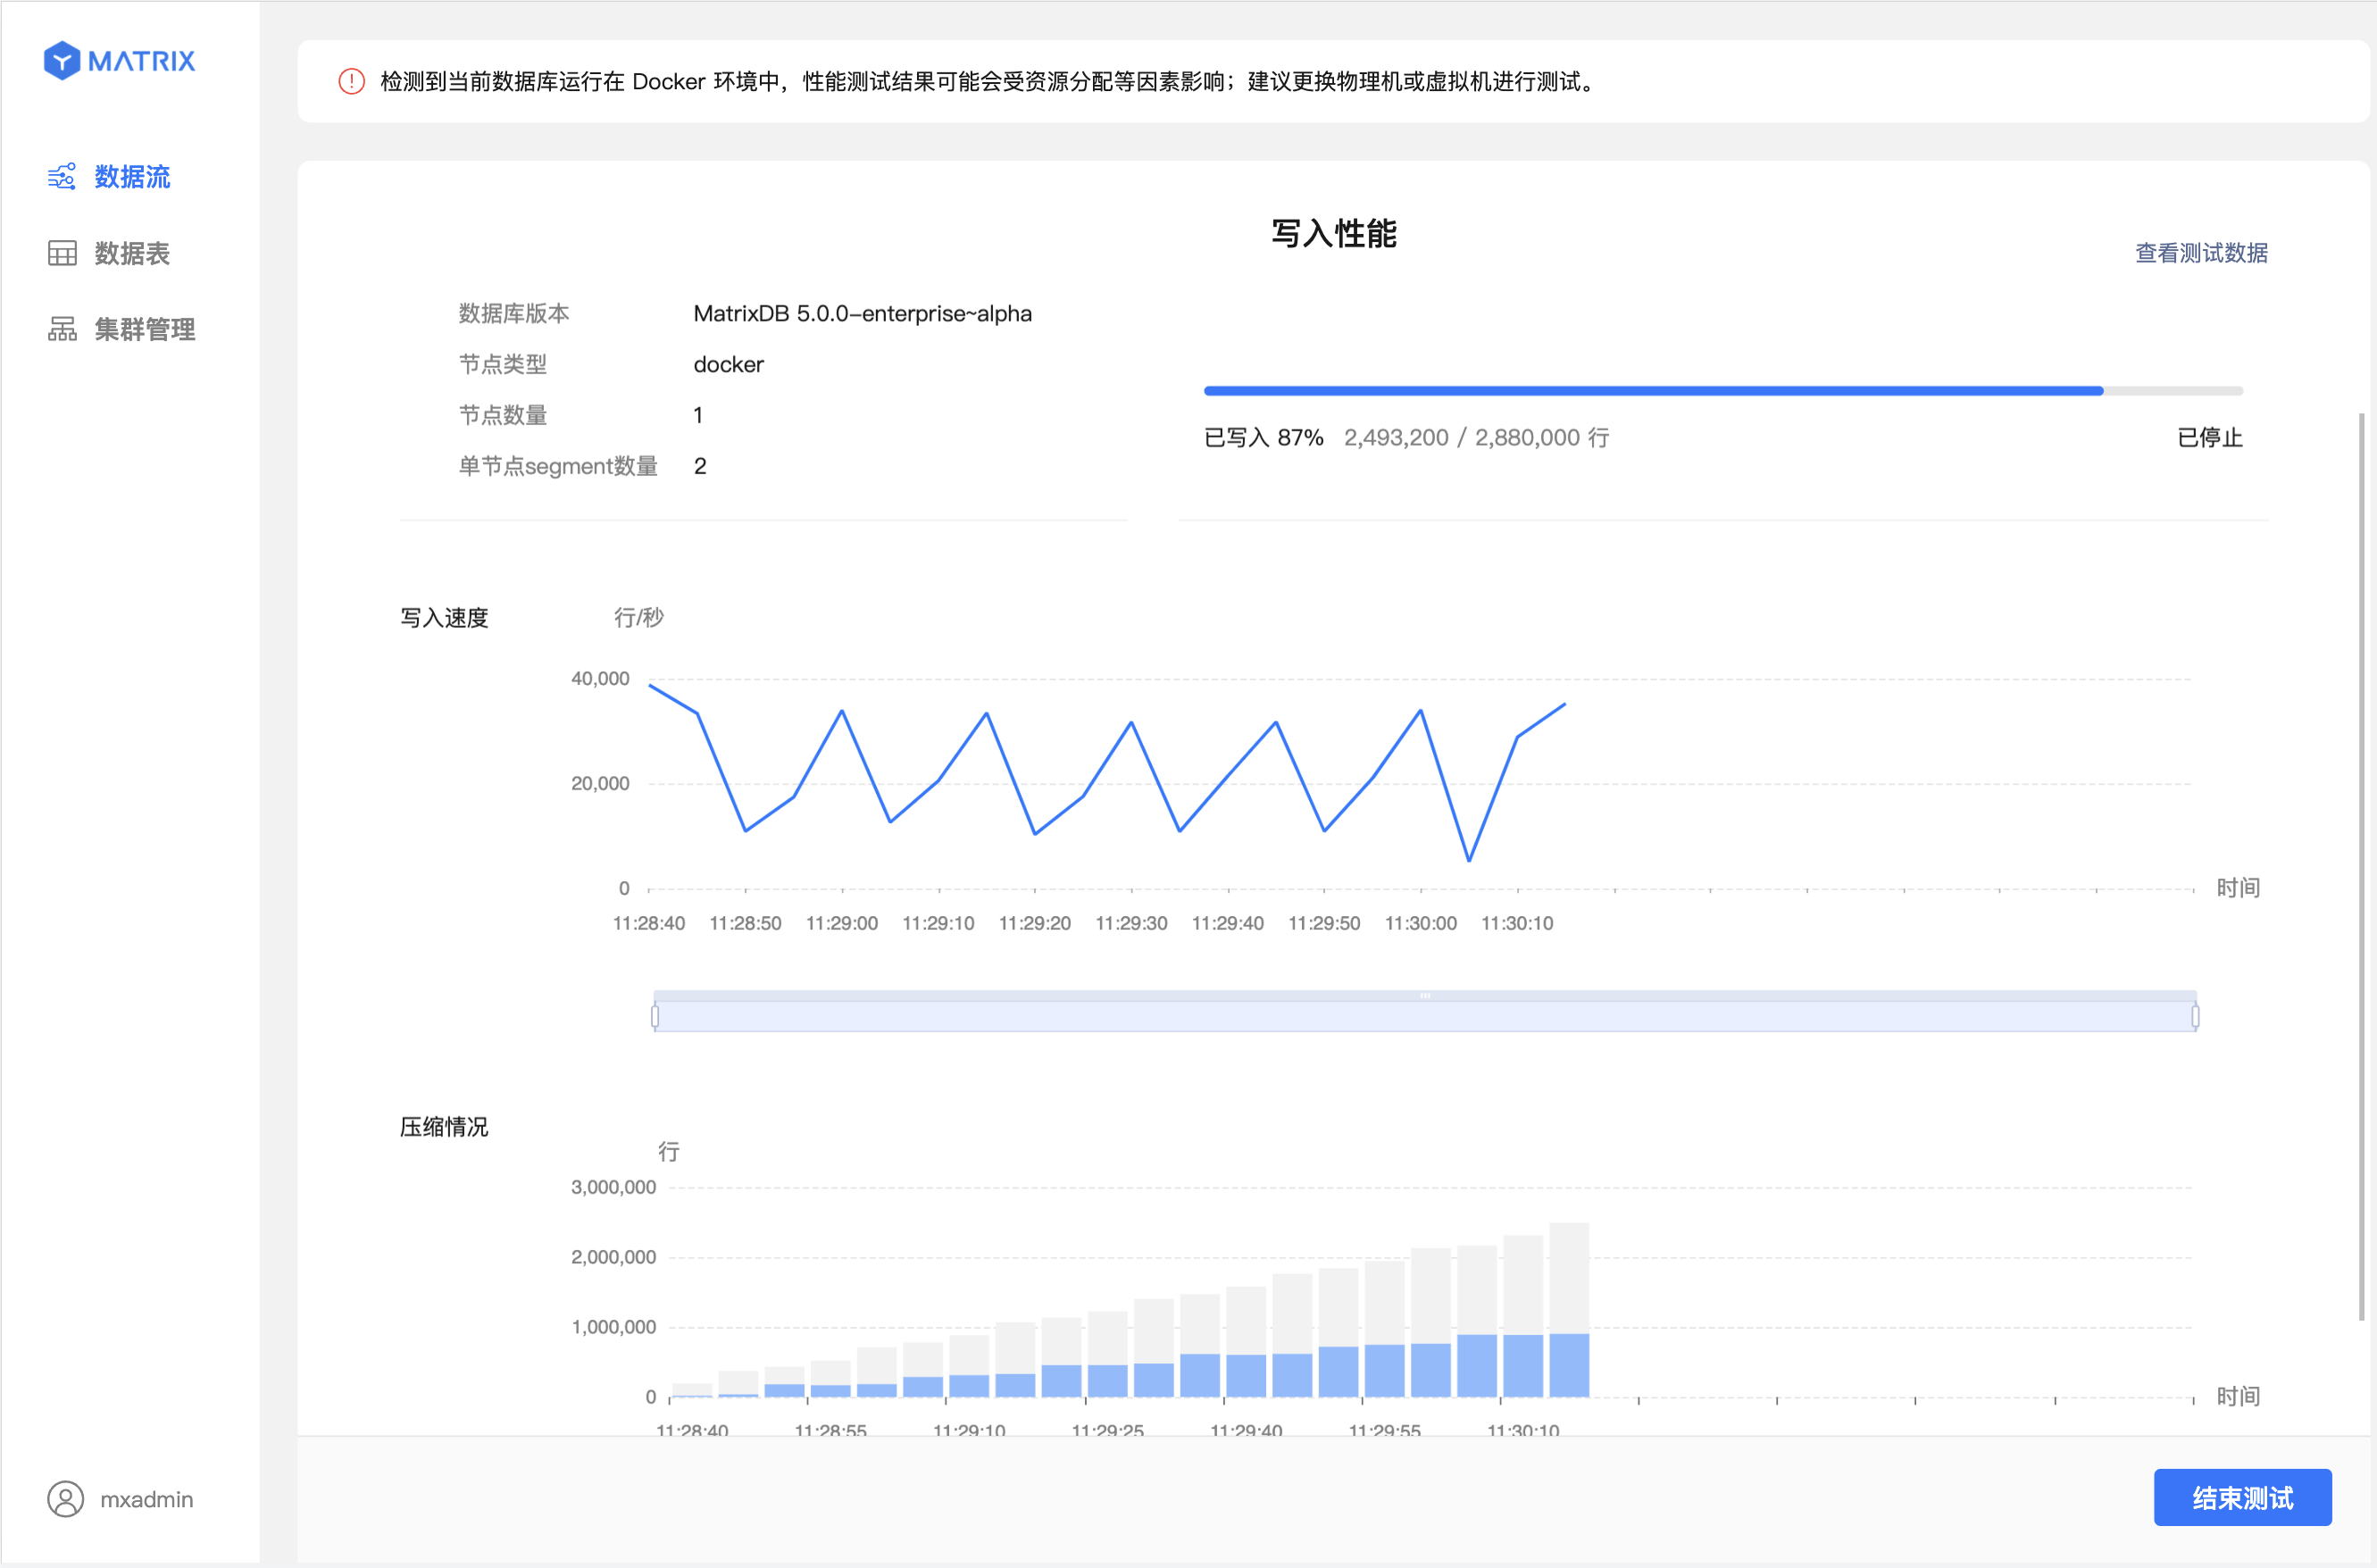
After starting the test, the data is started to be entered into the database. The page updates the data writing speed and compression every 5 seconds, intuitively displaying the database performance and supporting stopping the writing of data at any time.