YMatrix provides native Grafana-based graphic monitoring tools, and this document describes the steps to deploy monitoring components and manage usage. YMatrix provides a default monitoring panel that monitors the following information. Users can also create new panels in Grafana based on the data collected by the system to customize the required monitoring items.
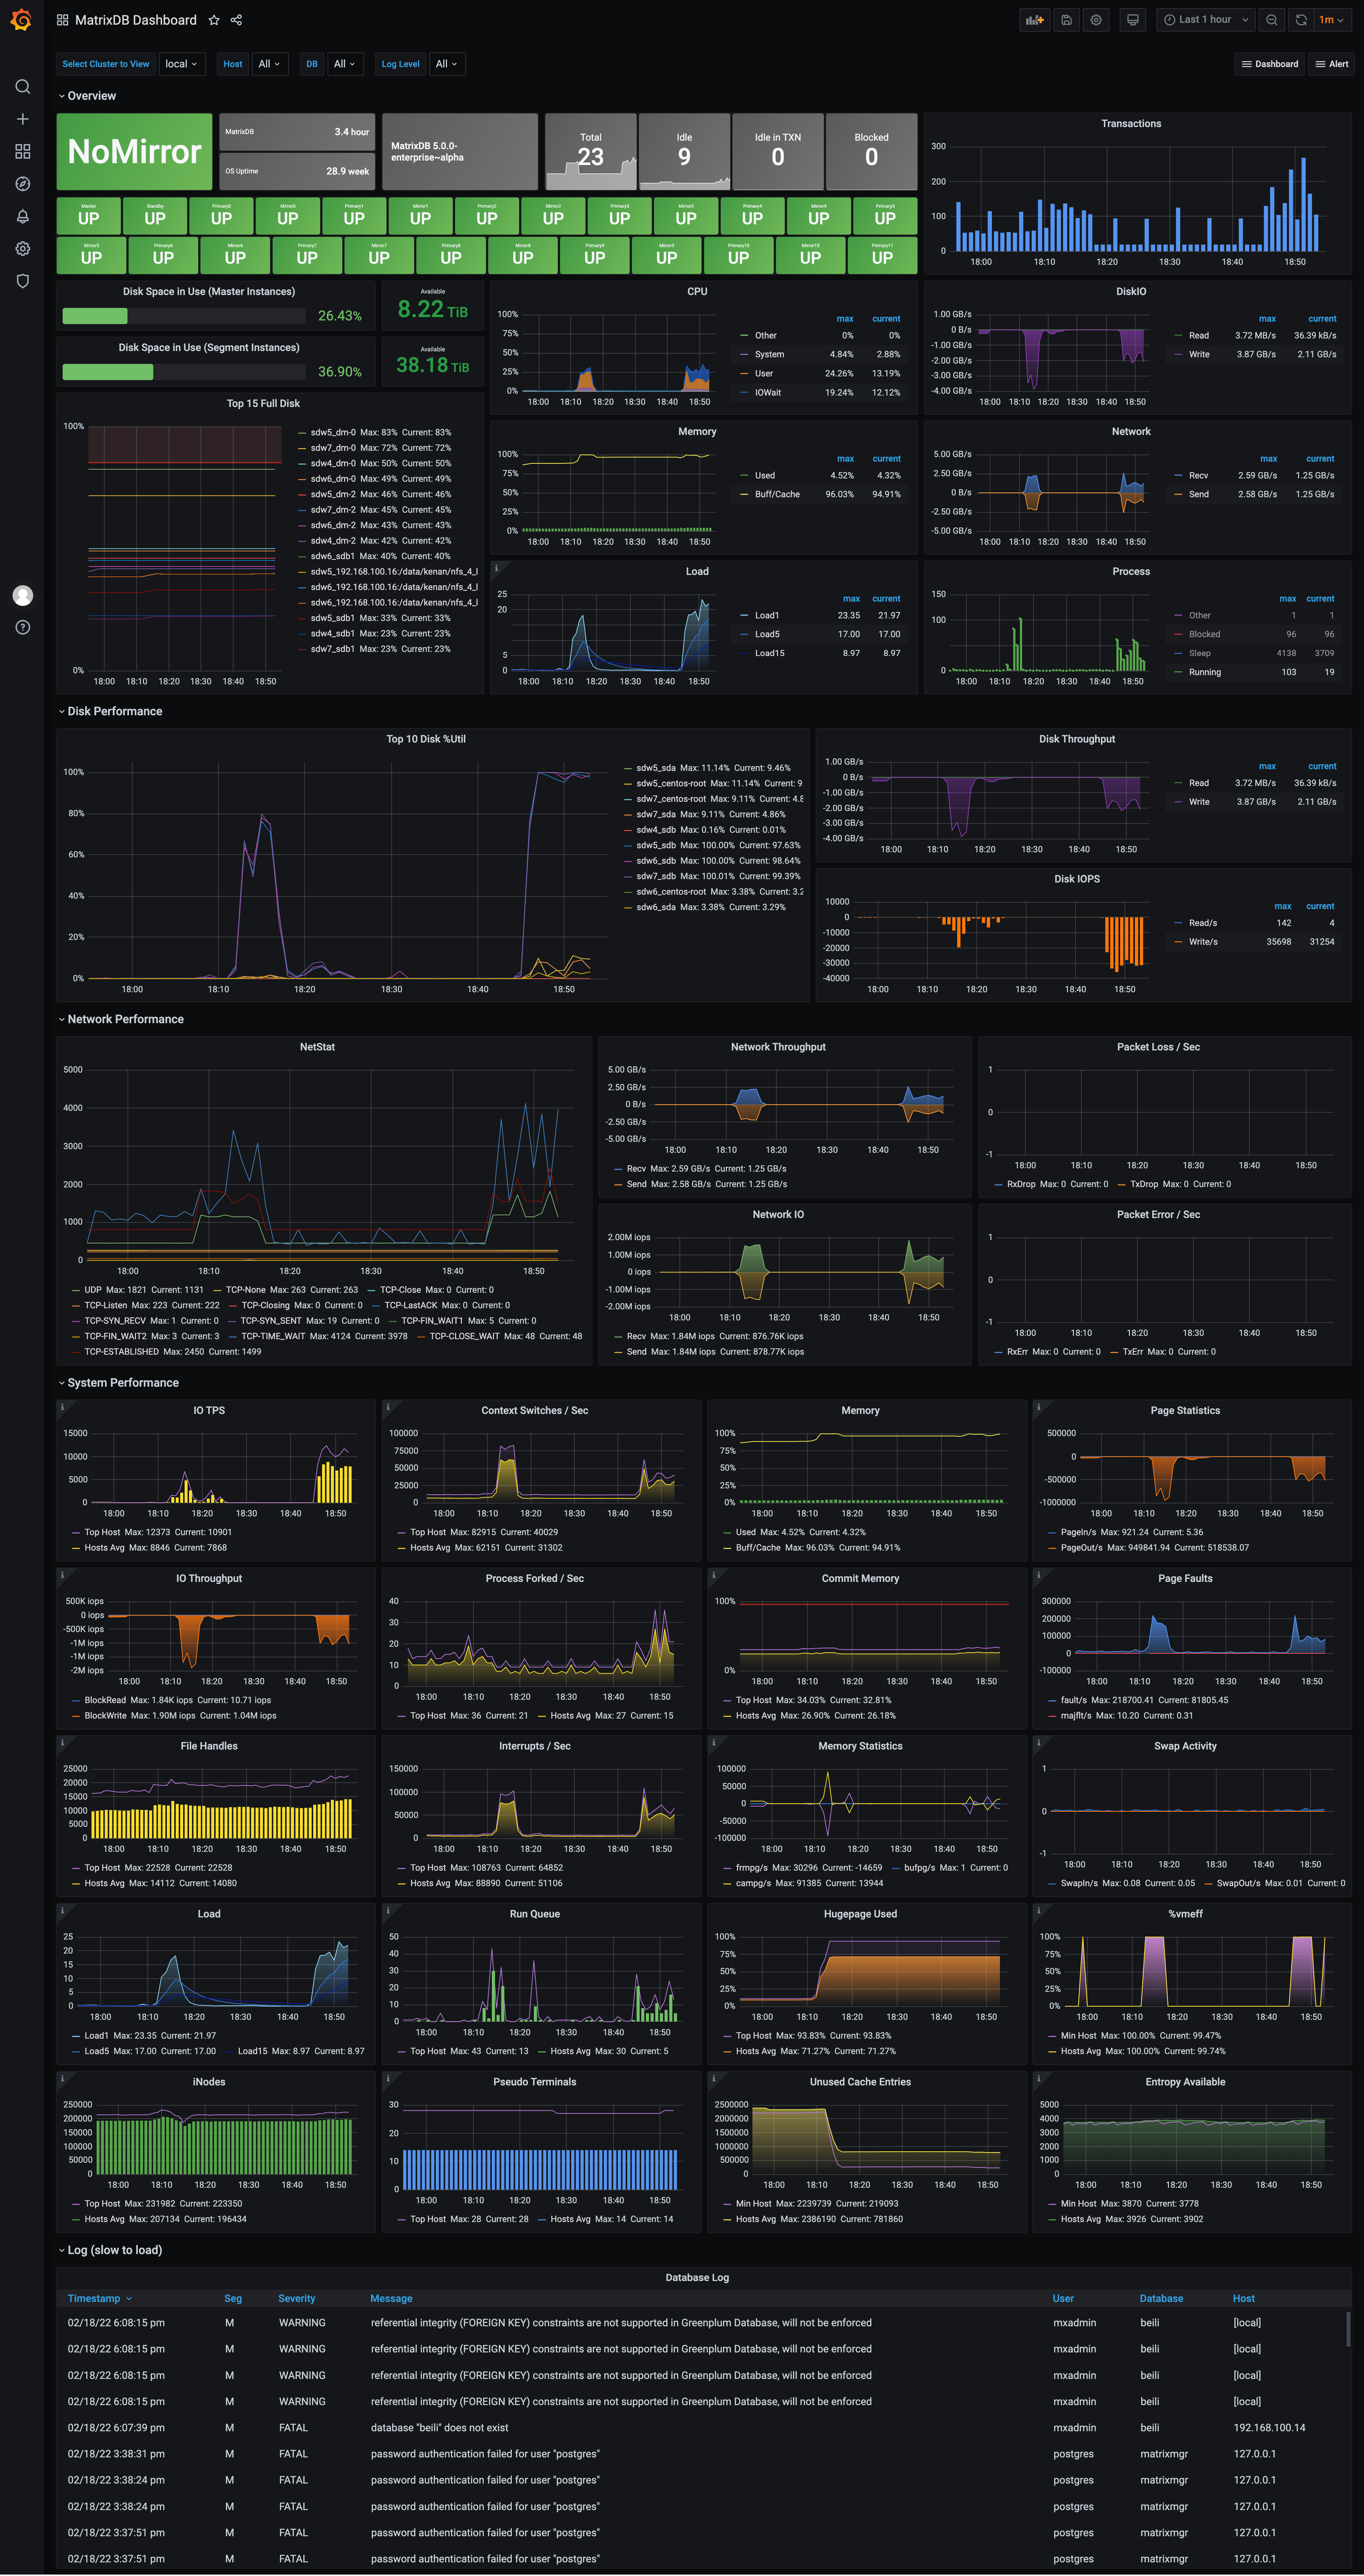
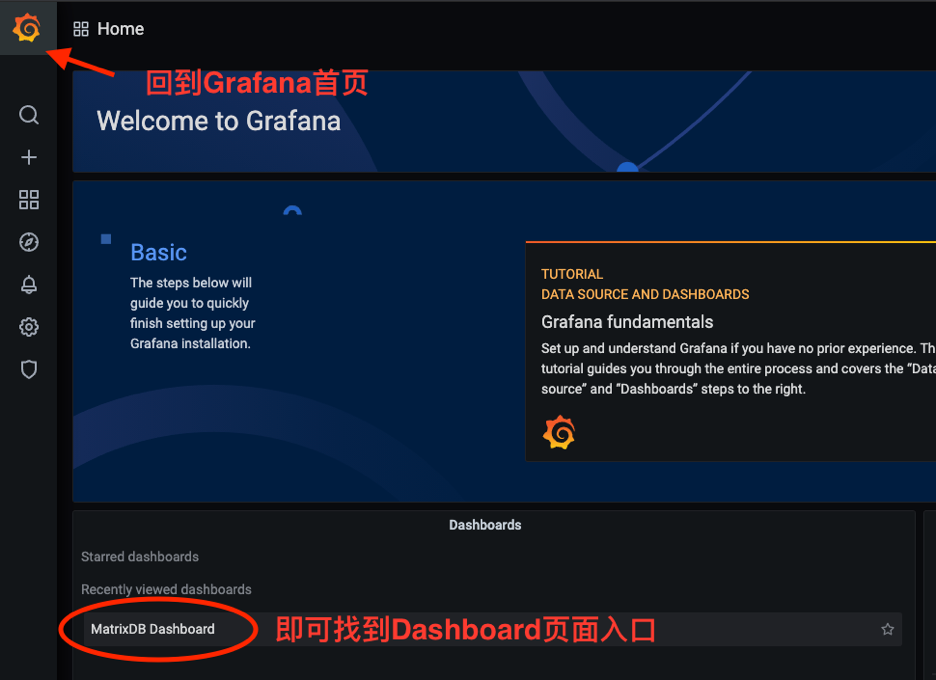
The deployed rendering is as follows. Starting from version 4.4, monitoring has been divided into two panels, named MatrixDB Dashboard and MatrixDB Database.
MatrixDB Dashboard:
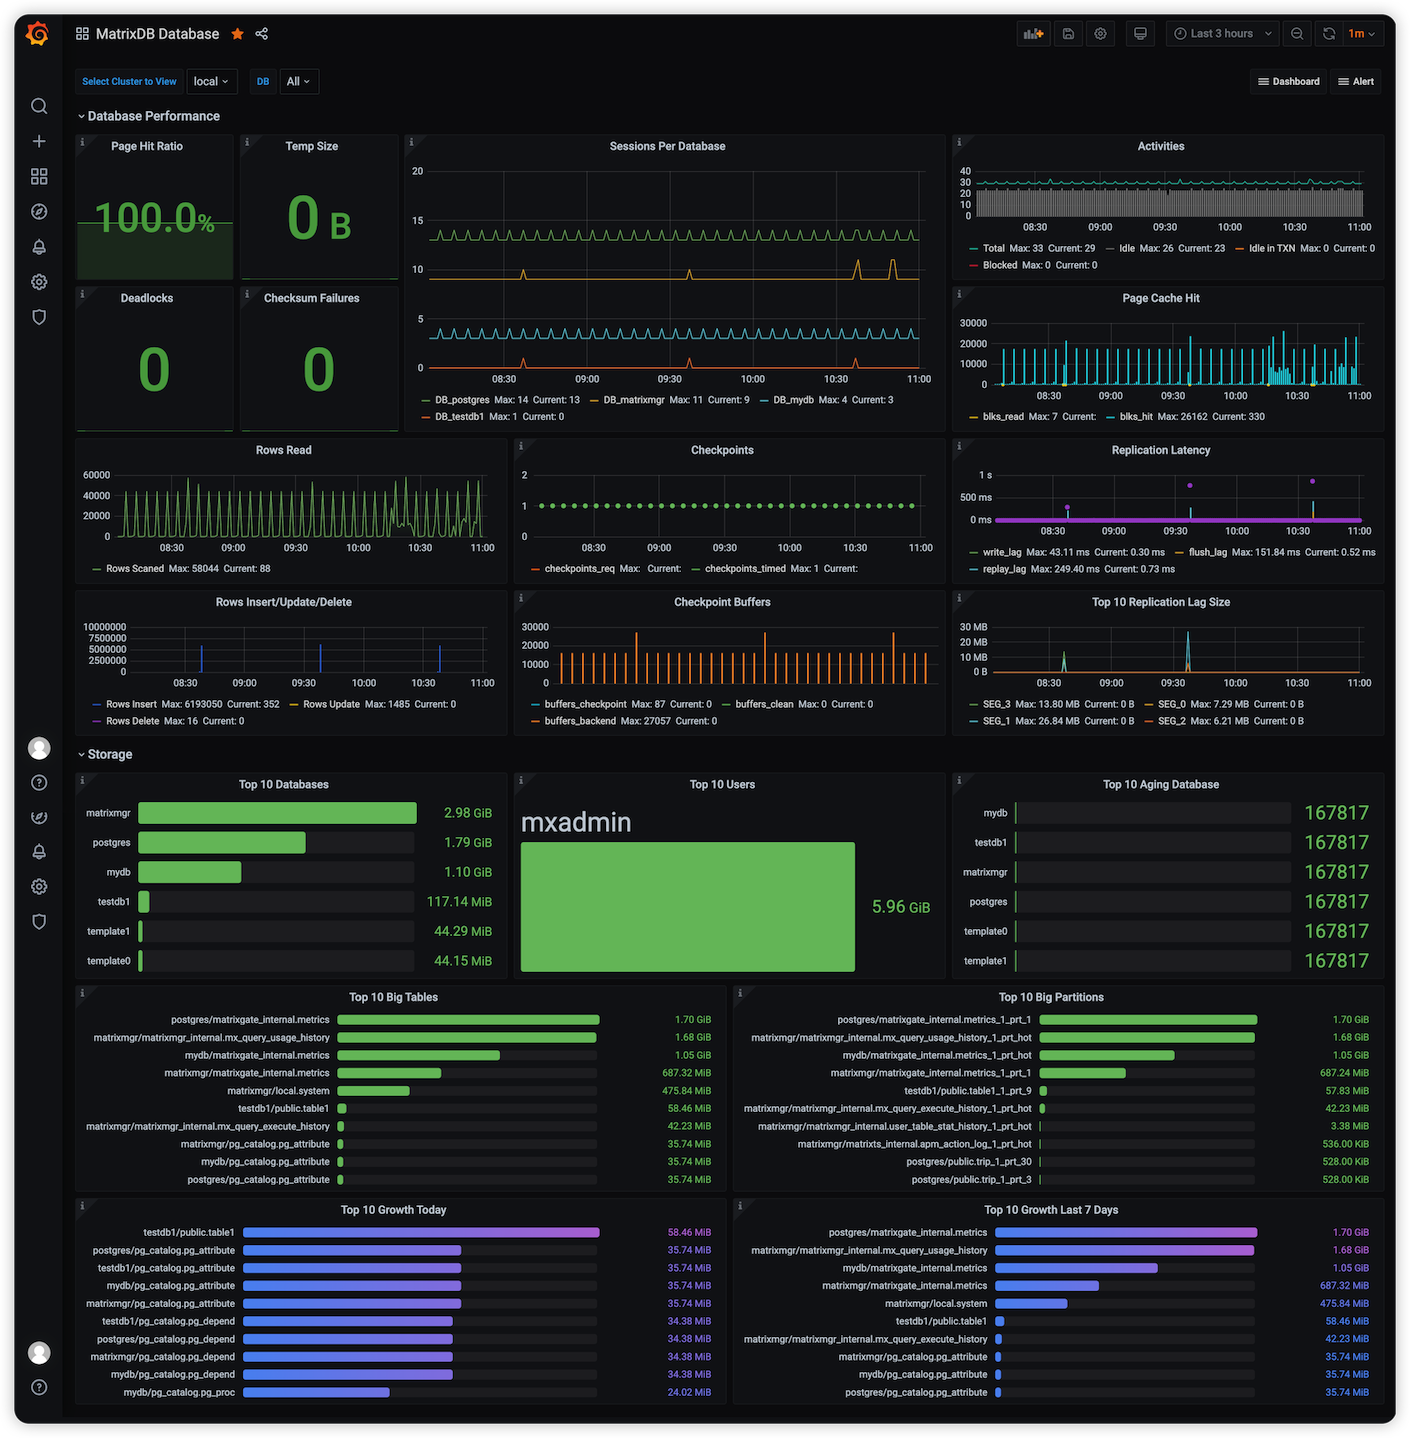
 MatrixDB Database:
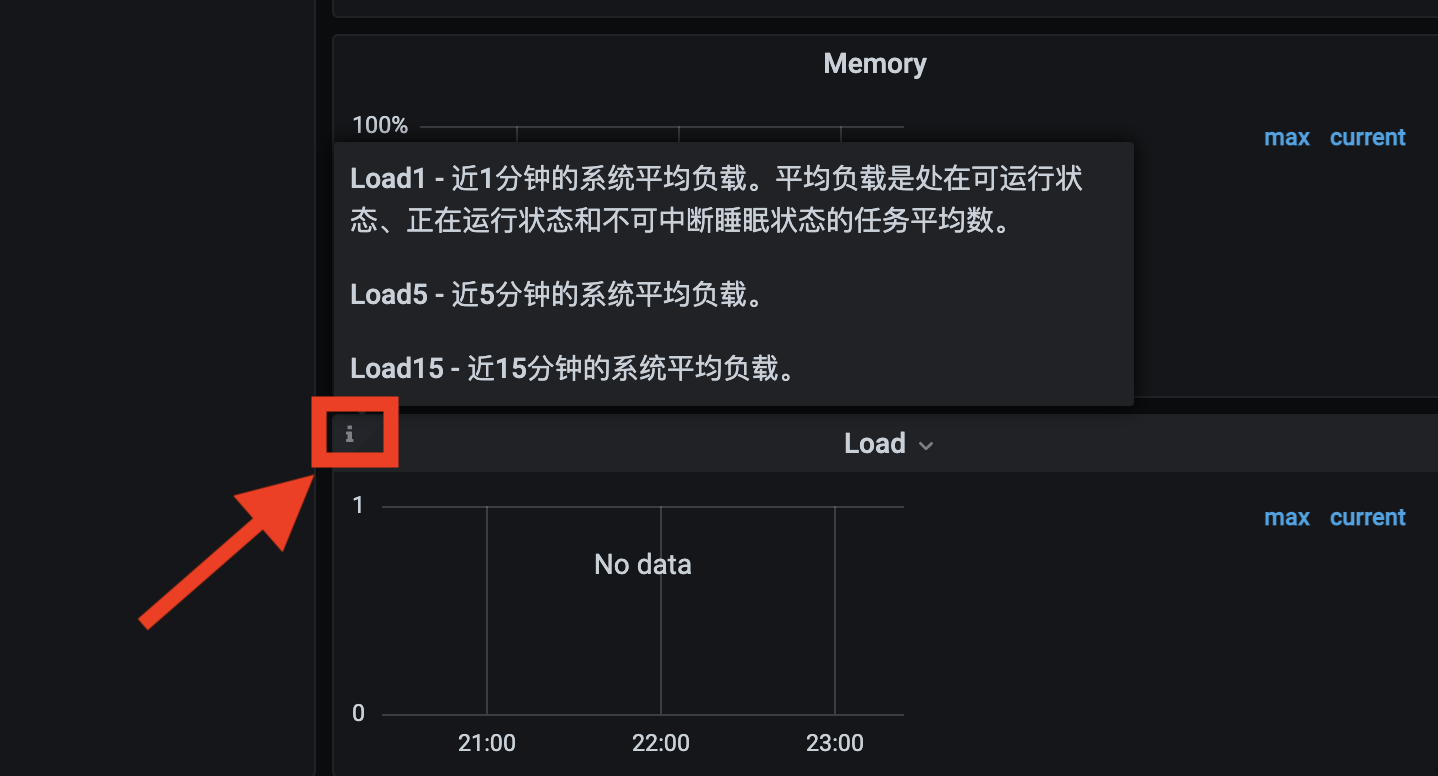
And add descriptions to the more difficult-to-understand panel. You can get the icon in the upper left corner of the panel by hovering the mouse over the icon:
Monitoring-related components are included in the YMatrix installation package. After YMatrix deployment, the monitoring deployment is completed through two steps: metric acquisition activation and Grafana installation and configuration.
The following operations can activate the acquisition of metrics for YMatrix and system resources, and store the collected data in YMatrix newly created database matrixmgr. In the following example, Master is mdw.
[<普通用户>@mdw ~]$ sudo su - mxadmin[mxadmin@mdw ~]$ psql -d matrixmgr
matrixmgr=# SELECT mxmgr_init_local();After success, you can observe that a new pattern called "local" appears under the matrixmgr database. Tables and views in this mode contains cluster monitoring and configuration information. Do not change the definitions and contents of these tables and views by yourself.
Prepare a host that can access Master and external network at the same time, which can be a Master or Standby Master node, or a separate machine (all for Linux, MacOS, Windows and other systems).
Install Grafana software, recommended version 7.3 or higher. The official download and installation link is https://grafana.com/grafana/download.
The following commands describe the operation method using CentOS 7 as an example. For commands for other operating systems, please refer to the corresponding operating system usage guide.
Notes!
YMatrix supports offline installation of Grafana. For details, please refer to Monitoring Alarm FAQ.
wget https://dl.grafana.com/oss/release/grafana-7.3.6-1.x86_64.rpm
sudo yum install grafana-7.3.6-1.x86_64.rpm[mxadmin@mdw ~]$ sudo systemctl daemon-reload
[mxadmin@mdw ~]$ sudo systemctl start grafana-server
[mxadmin@mdw ~]$ sudo systemctl status grafana-server
[mxadmin@mdw ~]$ sudo systemctl enable grafana-serverNote!
After the installation is completed, use your browser to access the following URL and you can see the Grafana homepage. Here 3000 is the default access port of Grafana, which users can modify. Log in with the default username and password (admin/admin). To ensure security, please change your password yourself. After logging in, click the user avatar icon in the lower left corner to see the modification interface.
http://<安装节点的IP或者域名>:3000Configure monitoring panel
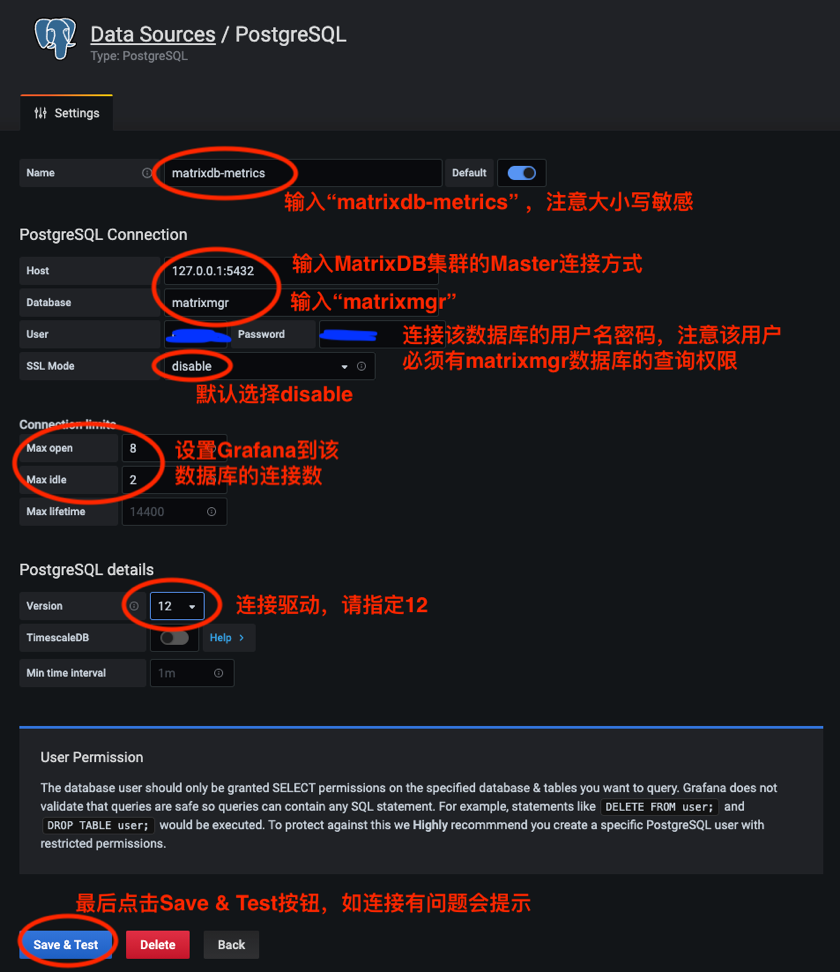
After Grafana is ready to install, you need to add the matrixmgr database in YMatrix as a data source and import the predefined monitoring panel.
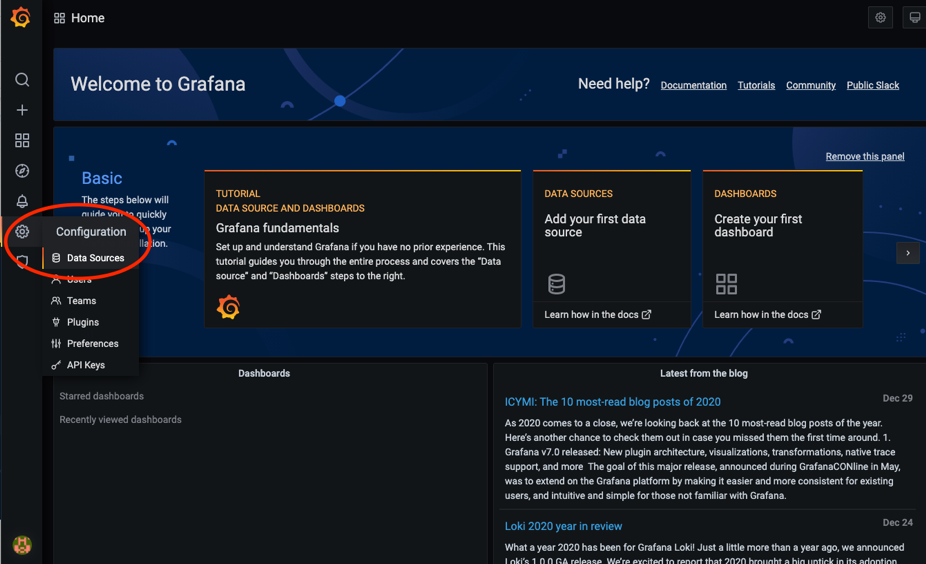
The steps to add a data source are as follows:

Before importing the predefined alarm panel for deployment and configuration, you need to copy the dashboard.json and database.json files to the local area. The idea is: first find the file on the server, then copy it, and finally import and upload it locally. The specific steps are as follows:
First log in to the server, switch to the mxadmin user, and find the dashboard.json and database.json files at the path shown in the picture. You can use the cd command, the find command, or any other method you are good at using. Here, the find command takes the database.json file as an example.
[mxadmin@mdw ~]$ cd /opt/ymatrix/matrixdb5/share/doc/postgresql/extension

##or

[mxadmin@mdw ~]$ find /opt/ymatrix/matrixdb5/share/doc/postgresql/extension -name database.json
Secondly, use the scp command to copy the file locally. There may be permission issues here. You can consider copying the file to the public area /tmp/ and then copying the file locally from /tmp/. Here we take the database.json file as an example.
Notes!
Pay attention to switching users when copying files from /tmp/ to locally to avoid permission issues.
[mxadmin@mdw]$ scp mxadmin@< 服务器IP地址 >:/opt/ymatrix/matrixdb5/share/doc/postgresql/extension/"database.json" mxadmin@< 服务器IP地址 >:/tmp/

~ scp waq@< 服务器IP地址 >:/tmp/"database.json" /Users/akkepler/workplace/Grafana
Finally, click the local folder directly, or use the command line to check whether the file is copied successfully. After success, just import and upload the file in the Grafana interface.
Notes!
If the import cannot be successfully imported, please add the following steps to modify the change.
Change all ${cluster} in the dashboard.json file to local , and $host is the actual host name, meaning that if you now have a cluster master + 2 segment, with names called mdw, sdw1, sdw2, then you need to change all $host in your dashboard.json file to 'mdw','sdw1','sdw2' . database.json Just modify the former, and import and upload files in the Grafana interface after modification.
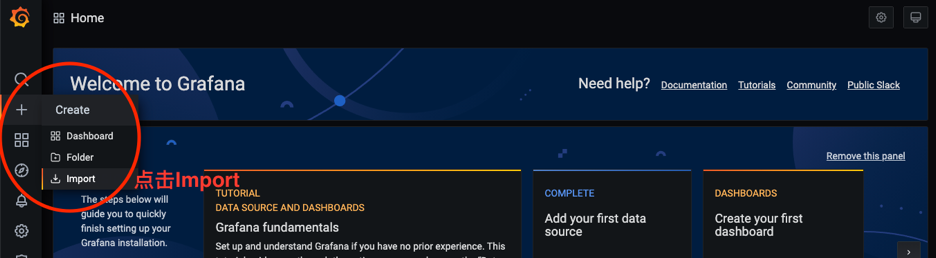
 Click the Upload JSON file button to select the dashboard.json and database.json file to import. Both files are located in the /opt/ymatrix/matrixdb5/share/doc/postgresql/extension directory by default.
After cluster state acquisition is activated, each host will run the acquisition service and the relevant logs are saved in the /var/log/matrixdb directory.
If YMatrix is restarted, or YMatrix is restarted before restarting the server, the data collection service will also be automatically started without manual intervention.
If you need to terminate the data collection service, you can connect to the matrixmgr database and execute the mxmgr_remove_all command. After the termination, the collected data will continue to be retained:
[mxadmin@mdw ~]$ psql -d matrixmgr

matrixmgr=# SELECT mxmgr_remove_all('local');
If you manually terminate the data acquisition service or YMatrix reinstallation, you need to activate data acquisition again, you can connect to the matrixmgr database and execute the mxmgr_deploy command:
matrixmgr=# SELECT mxmgr_deploy('local');