Imagine driving an electric vehicle on a highway. A data collector in your car captures 80 data points per second across 80 predefined metrics, totaling 2 KB. Over one minute, you observe this continuous stream of incoming data and use it to analyze real-time conditions. But before any analysis, this valuable data must be reliably written and stored in a robust database.
Undoubtedly, time-series databases must handle massive volumes of real-time data from numerous devices—loading performance is critical!
In this section, you will use advanced components MatrixGate and MatrixBench in YMatrix to conduct high-performance data ingestion testing, ensuring reliable data loading for downstream analytics.
Below is our physical machine test environment. Hardware specifications may affect tool configuration; please adjust accordingly.
Machine configuration:
| Parameter | Configuration |
|---|---|
| CPU Cores | 2 physical cores, 32 logical cores |
| CPU Platform | Intel(R) Xeon(R) Gold 5218 CPU @ 2.30GHz |
| Memory | 256 GB |
| Storage Capacity | 9.0 TB (1.4 GB/s write, 3.3 GB/s read) |
| Linux Distribution | CentOS Linux release 7.8.2003 (Core) |
| Linux Kernel | 3.10.0-1127.el7.x86_64 |
MatrixGate (shortened as mxgate) is a high-performance streaming data loading server located at bin/mxgate under the YMatrix installation directory. It fully leverages the parallel processing capabilities of distributed databases and is the preferred tool for data loading in production environments.
During testing, mxgate works with the writer component of mxbench to rapidly ingest data generated by the generator.
For more information, see mxgate.
mxbench is a benchmarking tool for data loading and querying. It generates random data based on configurations such as number of devices, time range, and metric count. It can automatically create tables and perform serial or concurrent data loading and queries.
You can run mxbench via command line or define settings in a configuration file—choose the method that suits your workflow. The tool is located at bin/mxbench under the YMatrix installation directory.
Single-machine deployment: Master + 6 Segments
Note!
MatrixGate and MatrixBench must be deployed on the same machine as the YMatrix cluster.
We provide three test scenarios with varying metric scales. At the end of this section, we compare YMatrix's write performance across different metric counts.
Note!
Before usingmxbenchfor load testing, ensure the test environment is ready: a running YMatrix cluster and properly configured environment variables. This step is required.
MatrixGate does not require manual setup—it is automatically configured and started when you launchmxbench.
For cluster deployment instructions, see Cluster Deployment.
For mxbench configuration, see mxbench.
mxbench parameters are divided into two parts: global and pluggable local configurations. Global settings include database and global. Pluggable components include generator, writer, and benchmark.
Since this section focuses on data loading performance, we will not cover the benchmark query tool here.
For details on benchmark, refer to mxbench.
| Parameter | Default Value | Description |
|---|---|---|
| --database | PGDATABASE environment variable, or postgres if unset |
Target database name |
| --db-master-port | Instance port number, must match environment variable setting | |
| --db-user | Current user name | Database user |
| --workspace | /tmp/mxbench | Directory for CSV and query files |
| --watch | true | Enable process monitoring (default: enabled) |
| --simultaneous-loading-and-query | false | Load and query simultaneously. Default false: load first, then query |
| --table-name | (empty) | Target table name (required) |
| --tag-num | 25000 | Number of devices |
| --metrics-type | float8 | Metric data type. Supported: "int4", "int8", "float4", "float8" |
| --total-metrics-count | 300 | Total number of metrics |
| --ts-start | Start timestamp for generated data | |
| --ts-end | End timestamp for generated data | |
| --ts-step-in-second | 1 | Interval between metric samples (seconds) |
| --generator | telematics | Random data generator. Defaults to telematics scenario. Can also read from custom files or skip generation |
| --generator-batch-size | 1 | Number of rows per device per timestamp. Default 1 (no split) |
| --generator-disorder-ratio | 0 | Percentage of out-of-order data (0–100). Default 0 (no delay) |
| --generator-empty-value-ratio | 90 | Percentage of null values per row (0–100). Default 90 (90% nulls) |
| --generator-randomness | OFF | Data randomness level: OFF/S/M/L. Default OFF (constant values). Increases with S → M → L |
| --writer | http | Data writer mode. Determines how mxgate receives data |
For more configurable parameters, see mxbench or run mxbench --help.
Run the following command to configure and start mxbench. Adjust parameters based on your environment. Since mxgate and mxbench are co-located, using stdin avoids network overhead by leveraging Linux pipes—lightweight and efficient.
[mxadmin@mdw ~]$ mxbench run \
  --db-database "load_test" \
  --db-database "load_test" \
  --db-master-port 5432 \
  --db-master-host "mdw" \
  --db-user "mxadmin" \
  --workspace "/tmp/mxbench/workspace" \
  --watch \
  --simultaneous-loading-and-query \
  --table-name "test_table" \
  --tag-num 100000 \
  --metrics-type "float8" \
  --total-metrics-count 10 \
  --ts-start "2022-04-19 00:00:00" \
  --ts-end "2022-04-19 00:01:00" \
  --generator "telematics" \
  --generator-batch-size 1 \
  --generator-disorder-ratio 0 \
  --generator-empty-value-ratio 0 \
  --generator-randomness "OFF" \
  --writer "stdin"
If --watch is not disabled, progress updates appear every 5 seconds. Upon completion, you’ll see a summary like:
┌───────────────────────────────────────────────────────┐
│             Summary Report for STDIN Writer            │
├─────────────────────────────────┬─────────────────────┤
│ start time:                     │ 2022-07-21 15:14:08 │
├─────────────────────────────────┼─────────────────────┤
│ stop time:                      │ 2022-07-21 15:14:27 │
├─────────────────────────────────┼─────────────────────┤
│ size written to MxGate (bytes): │ 695333400           │
├─────────────────────────────────┼─────────────────────┤
│ lines inserted:                 │ 6000000             │
├─────────────────────────────────┼─────────────────────┤
│ compress ratio:                 │ 5.399120 : 1        │
└─────────────────────────────────┴─────────────────────┘
Writer report interpretation:
| Parameter | Description |
|---|---|
| start time | Data loading start time |
| stop time | Data loading end time |
| size written to MxGate (bytes) | Total bytes sent to mxgate |
| lines inserted | Number of rows inserted |
| compress ratio | Compression ratio: raw input size vs. actual table size in database |
Actual runtime depends on total data volume and machine performance. As long as --watch is enabled, you’ll see real-time progress every 5 seconds, allowing you to monitor write speed and duration.
Note!
mxbenchruns continuously until all data fromts-starttots-endis loaded. You can pressCtrl+Cto terminate early.
If long command lines are cumbersome, create a config file mxbench.conf, place parameters inside, and run:
[mxadmin@mdw ~]$ mxbench --config mxbench.confNote!
You may encounter a "hang" during data loading—progress logs continue but no real progress occurs. Stay calm. Run the following command to check logs and diagnose:cd ~/gpAdminLogs/.
[mxadmin@mdw ~]$ mxbench run \
  --db-database "load_test" \
  --db-master-port 5432 \
  --db-master-host "mdw" \
  --db-user "mxadmin" \
  --workspace "/tmp/mxbench/workspace" \
  --watch \
  --simultaneous-loading-and-query \
  --table-name "test_table2" \
  --tag-num 100000 \
  --metrics-type "float8" \
  --total-metrics-count 100 \
  --ts-start "2022-04-19 00:00:00" \
  --ts-end "2022-04-19 00:01:00" \
  --generator "telematics" \
  --generator-batch-size 1 \
  --generator-disorder-ratio 0 \
  --generator-empty-value-ratio 0 \
  --generator-randomness "OFF" \
  --writer "stdin"
Result:
┌───────────────────────────────────────────────────────┐
│             Summary Report for STDIN Writer            │
├─────────────────────────────────┬─────────────────────┤
│ start time:                     │ 2022-07-21 15:19:48 │
├─────────────────────────────────┼─────────────────────┤
│ stop time:                      │ 2022-07-21 15:21:02 │
├─────────────────────────────────┼─────────────────────┤
│ size written to MxGate (bytes): │ 5555333400          │
├─────────────────────────────────┼─────────────────────┤
│ lines inserted:                 │ 6000000             │
├─────────────────────────────────┼─────────────────────┤
│ compress ratio:                 │ 25.519937 : 1       │
└─────────────────────────────────┴─────────────────────┘[mxadmin@mdw ~]$ mxbench run \
--db-database "load_test" \
--db-master-port 5432 \
--db-master-host "mdw" \
--db-user "mxadmin" \
--workspace "/tmp/mxbench/workspace" \
--watch \
--simultaneous-loading-and-query \
--table-name "test_table3" \
--tag-num 100000 \
--metrics-type "float8" \
--total-metrics-count 1000 \
--ts-start "2022-04-19 00:00:00" \
--ts-end "2022-04-19 00:01:00" \
--generator "telematics" \
--generator-batch-size 1 \
--generator-disorder-ratio 0 \
--generator-empty-value-ratio 0 \
--generator-randomness "OFF" \
--writer "stdin" Result:
┌───────────────────────────────────────────────────────┐
│             Summary Report for STDIN Writer            │
├─────────────────────────────────┬─────────────────────┤
│ start time:                     │ 2022-07-21 15:22:27 │
├─────────────────────────────────┼─────────────────────┤
│ stop time:                      │ 2022-07-21 15:33:40 │
├─────────────────────────────────┼─────────────────────┤
│ size written to MxGate (bytes): │ 54305333400         │
├─────────────────────────────────┼─────────────────────┤
│ lines inserted:                 │ 6000000             │
├─────────────────────────────────┼─────────────────────┤
│ compress ratio:                 │ 47.488209 : 1       │
└─────────────────────────────────┴─────────────────────┘
Based on the above writer reports, we provide a clear line chart comparison below. It illustrates YMatrix’s powerful data loading performance and how it scales with increasing metric counts—helping you make informed decisions about metric limits in real-world deployments.
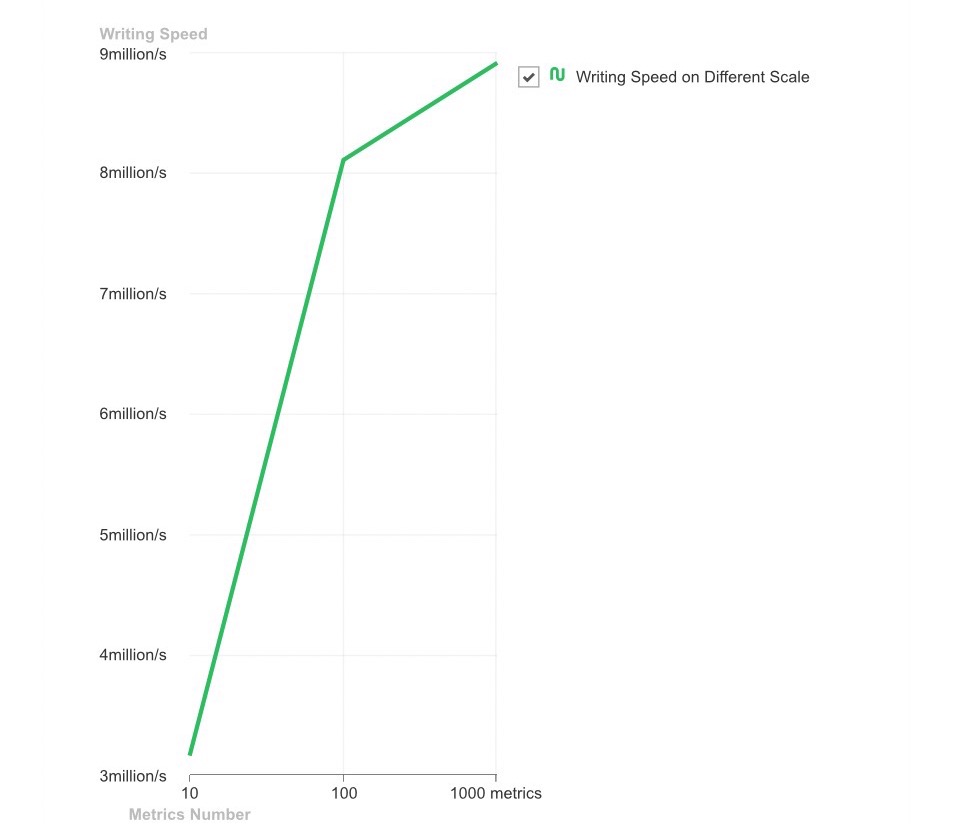
Time-series data consists of timestamped data points—each representing a metric value at a specific moment. Without timestamps, it is not time-series data. Understanding data points helps interpret the chart.
The x-axis shows different metric scales (total-metrics-count). The y-axis shows write throughput—the number of data points written per second. As metric count increases, write throughput grows rapidly but eventually plateaus due to increased data volume.
Regardless, YMatrix achieves million-level write throughput. Instead of painfully inserting rows one by one with INSERT, why not accelerate with YMatrix on the data highway?