In the YMatrix 5 new architecture, etcd is introduced to store cluster configuration and state information. etcd is critical: any abnormality may lead to database instability or even crash.
This document describes how to install and deploy etcd monitoring. It is recommended to enable this monitoring in production environments, as healthy etcd status is a prerequisite for stable database operation.
Visit the Prometheus official website and download the following:
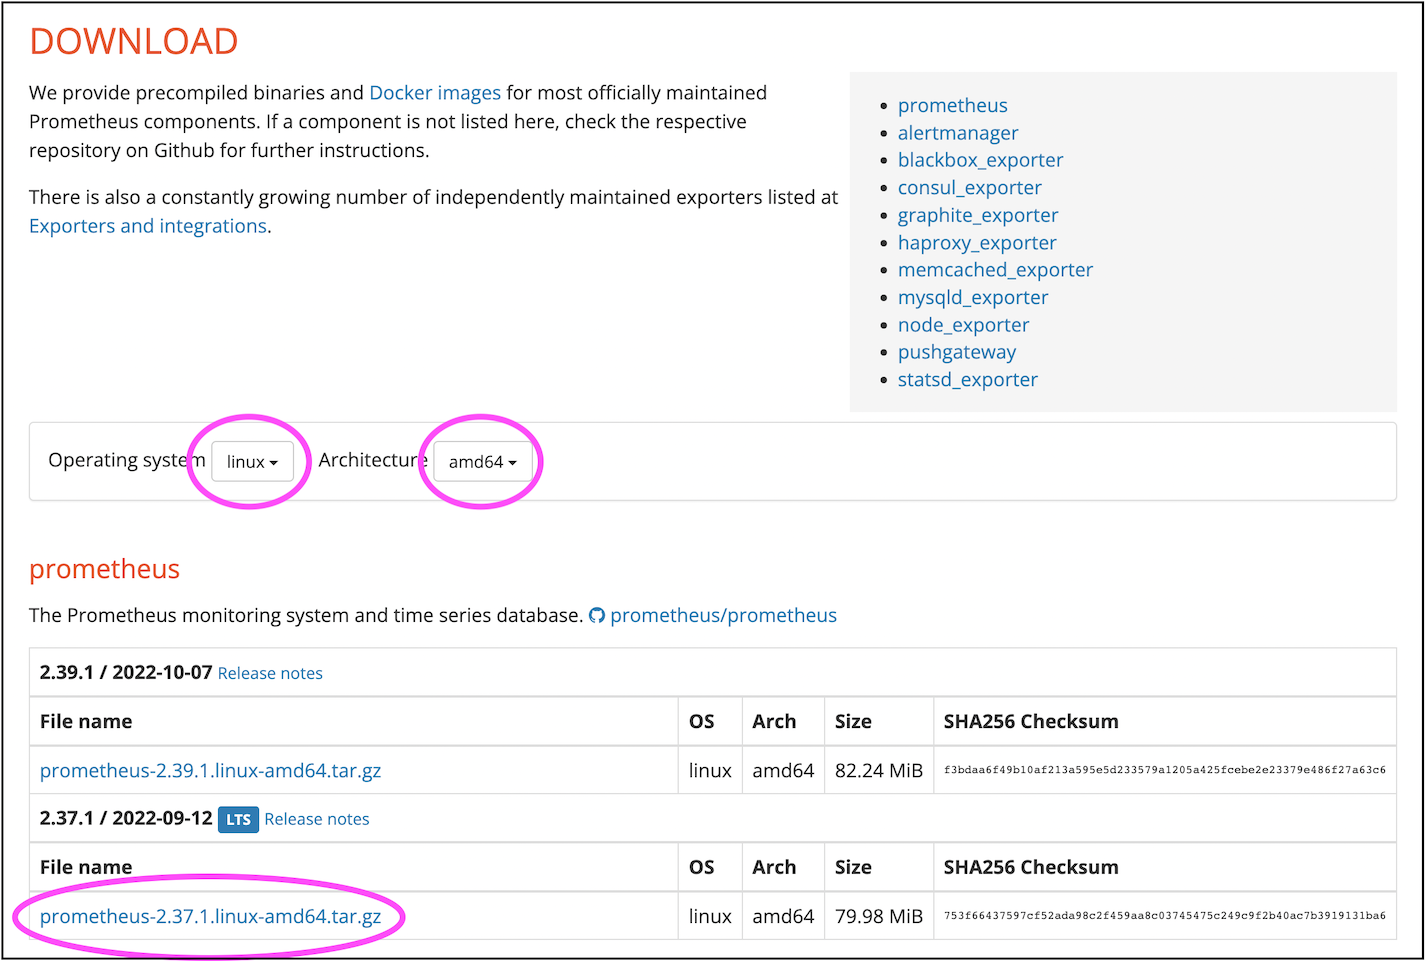
Upload the downloaded tar package to a Linux server. If possible, run Prometheus on a dedicated server. If resources are limited, you may temporarily place it on the standby or master node.
$ tar xvfz prometheus-*.tar.gzYou can move the extracted prometheus-* directory to /usr/local/.
Edit the configuration file:
$ cd prometheus-*
sudo vi prometheus.yml
Append the following content to the end of the file:
  - job_name: "etcd"
    static_configs:
      - targets: ["172.31.33.128:4679", "172.31.45.253:4679", "172.31.35.134:4679"]
The targets array must be replaced with the actual addresses of all etcd nodes in your cluster.
You can find this information in the /etc/matrixdb5/physical_cluster.toml file on the Master host:
$ cat physical_cluster.toml
cluster_id = '79LhQxjuwmXgSWZCjcdigF'
supervisord_grpc_port = 4617
deployer_port = 4627
etcd_endpoints = ['http://10.0.159.1:4679', 'http://10.0.172.185:4679', 'http://10.0.170.90:4679', 'http://10.0.146.2:4679', 'http://10.0.146.195:4679', 'http://10.0.150.110:4679', 'http://10.0.169.149:4679']
Note!
If the/etc/matrixdb5/physical_cluster.tomlfile does not exist and no etcd process is found, your cluster was not deployed using the YMatrix 5.0 architecture and does not require etcd monitoring.
./prometheus --config.file=prometheus.ymlNote!
Typically, you should run Prometheus as a background system service by configuring it as a systemd service.
Refer to the official documentation for installing Grafana.
Note!
Grafana version 8.2.5 or higher is required.
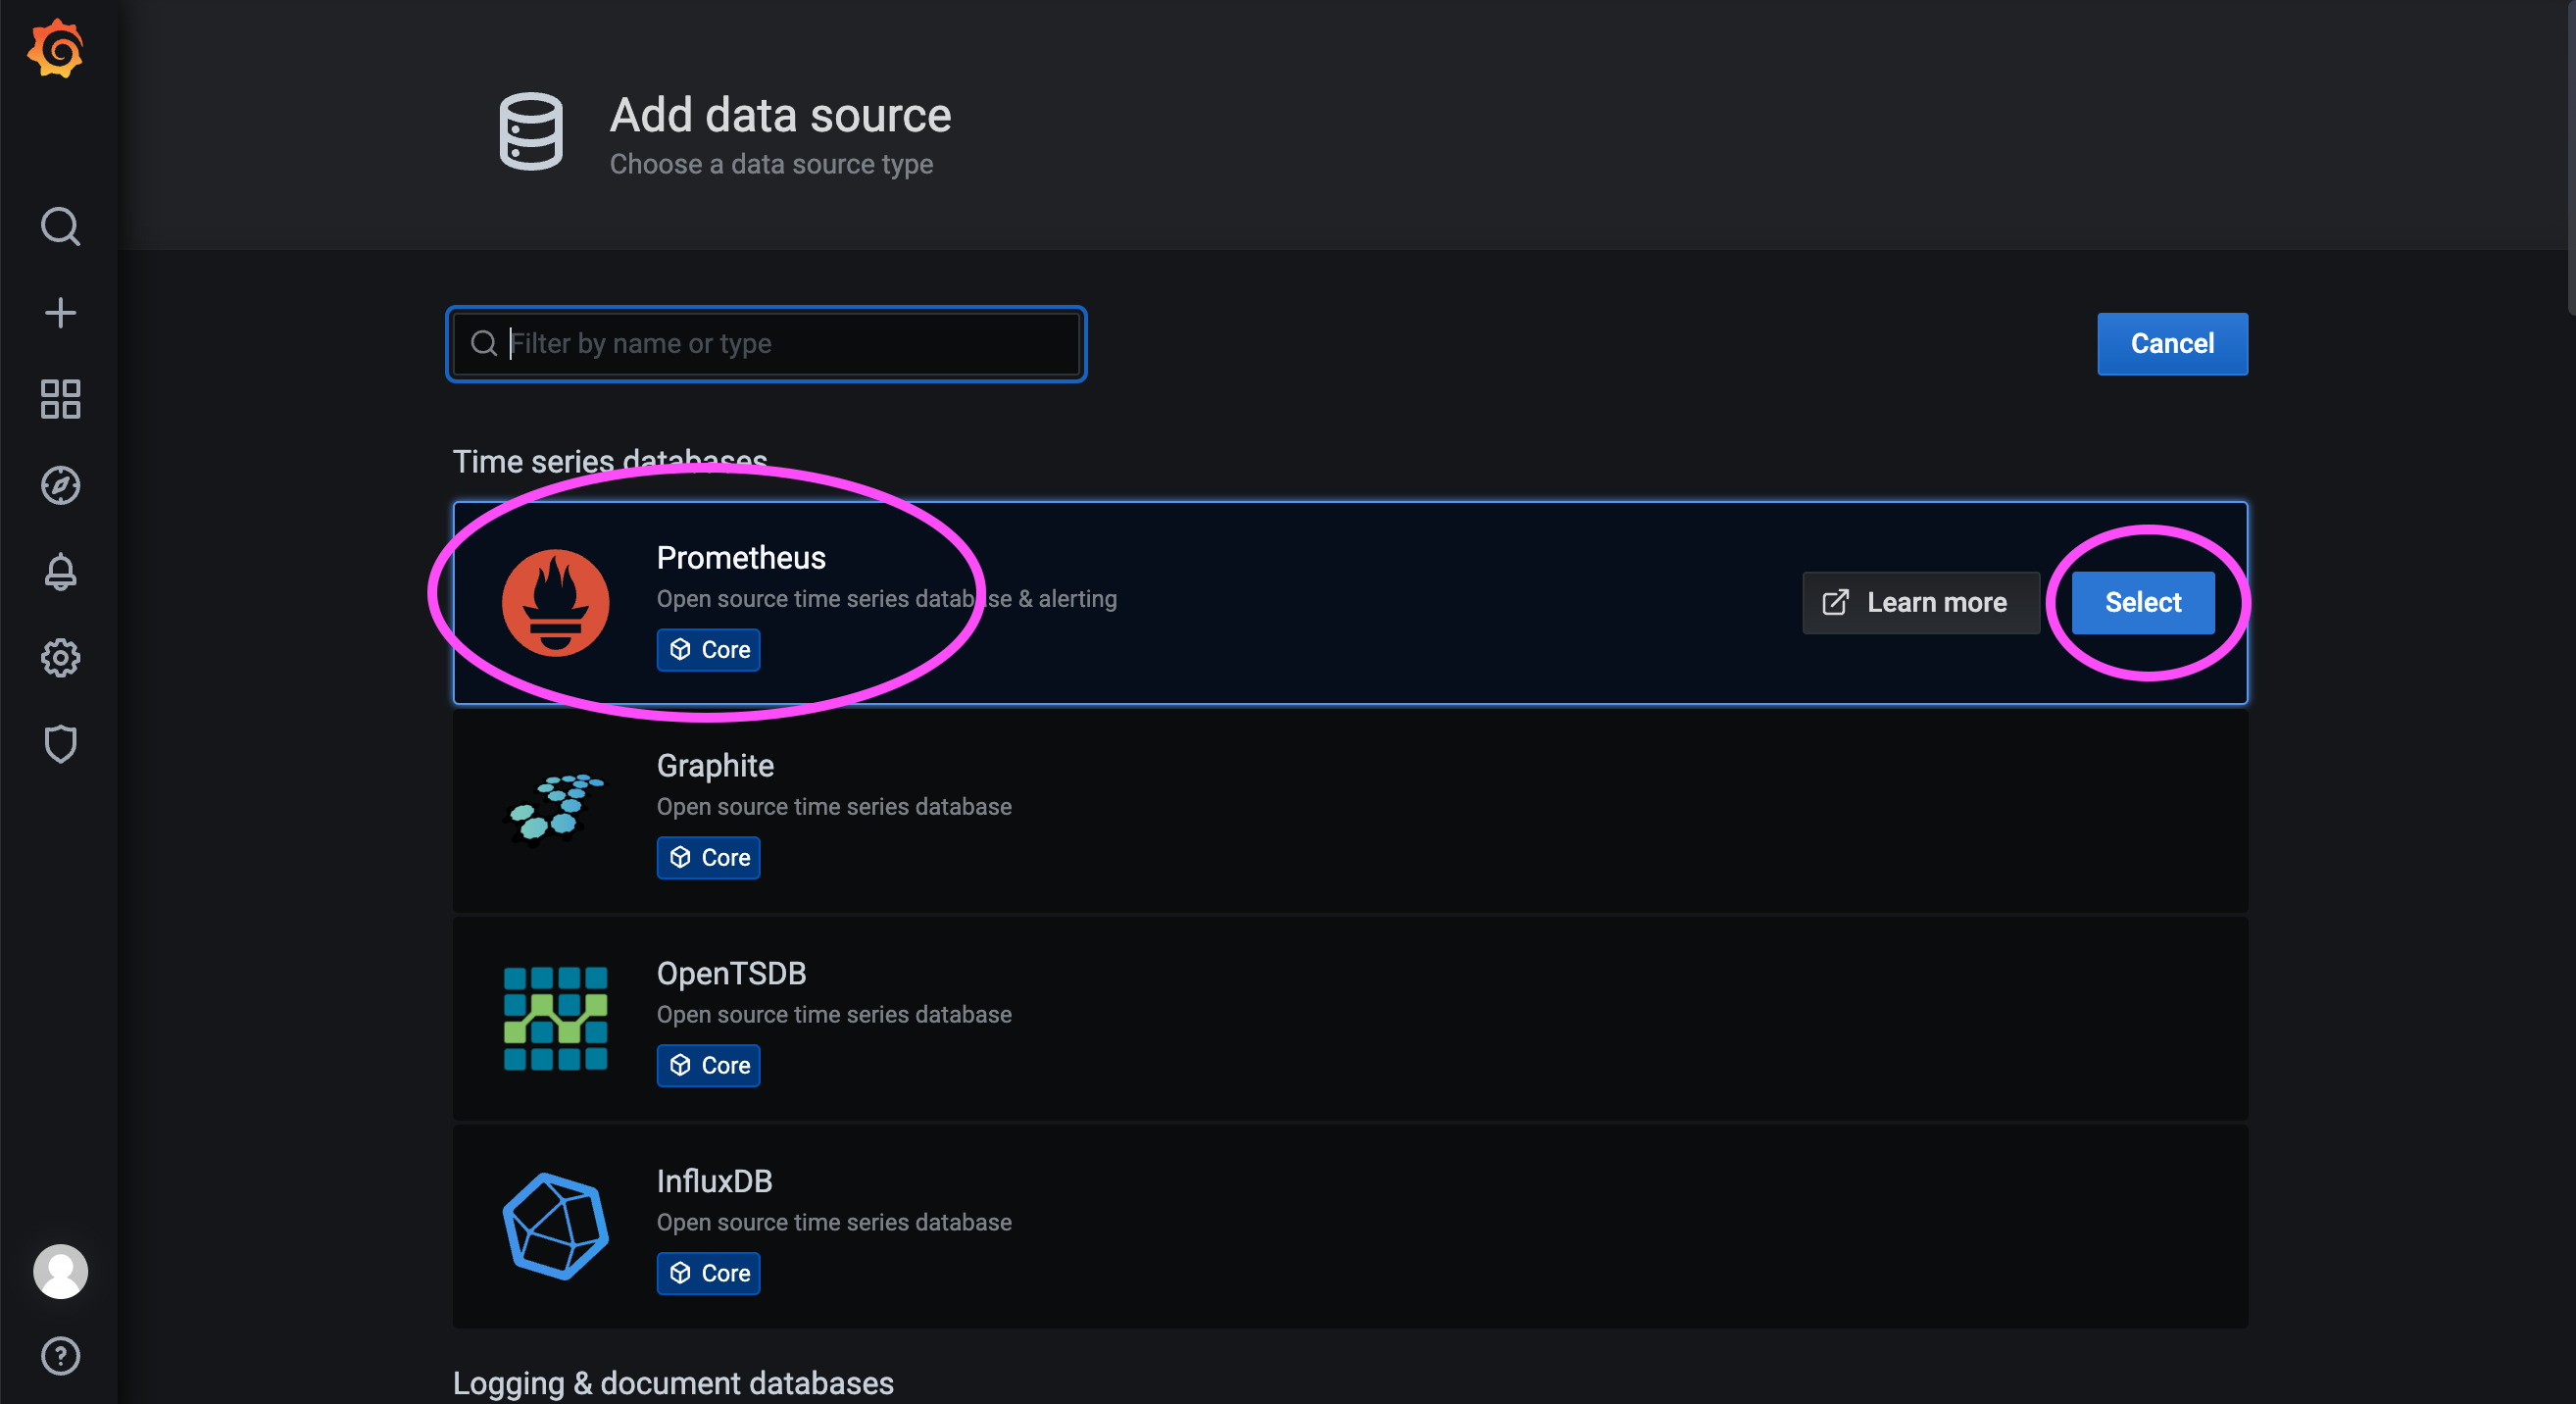
First, log in to the Grafana web interface. The default address is:
http://<IP_or_hostname_of_Grafana_server>:3000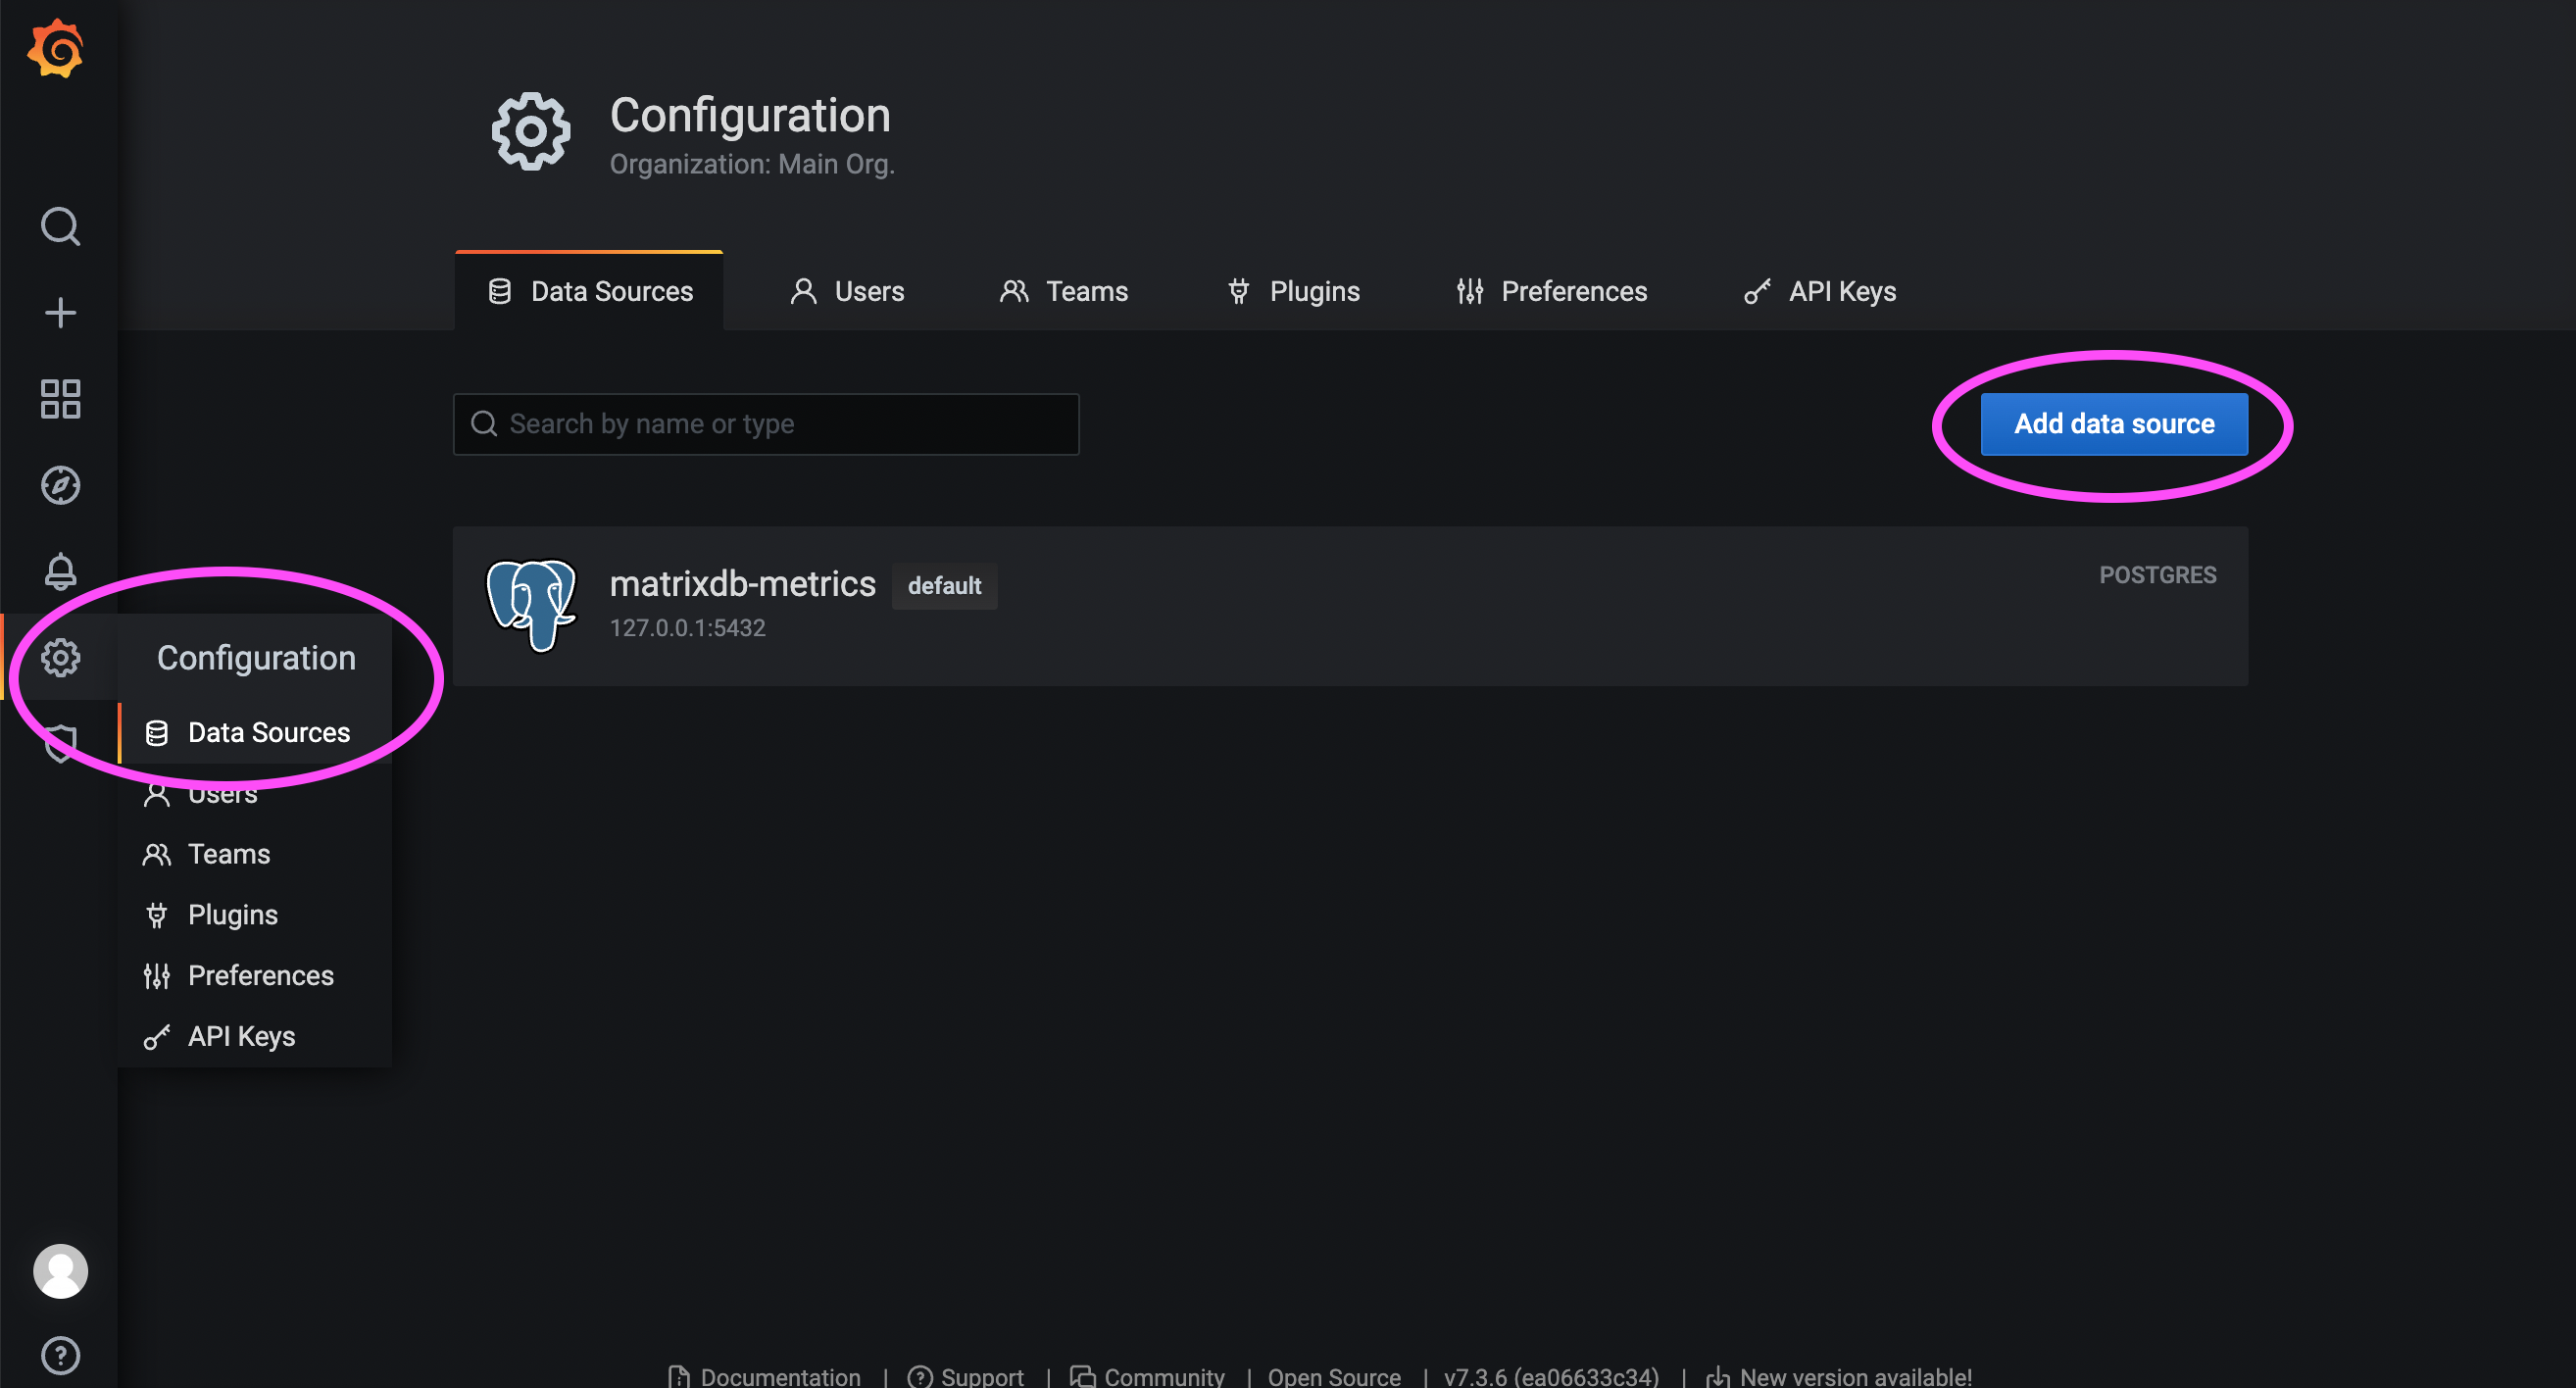

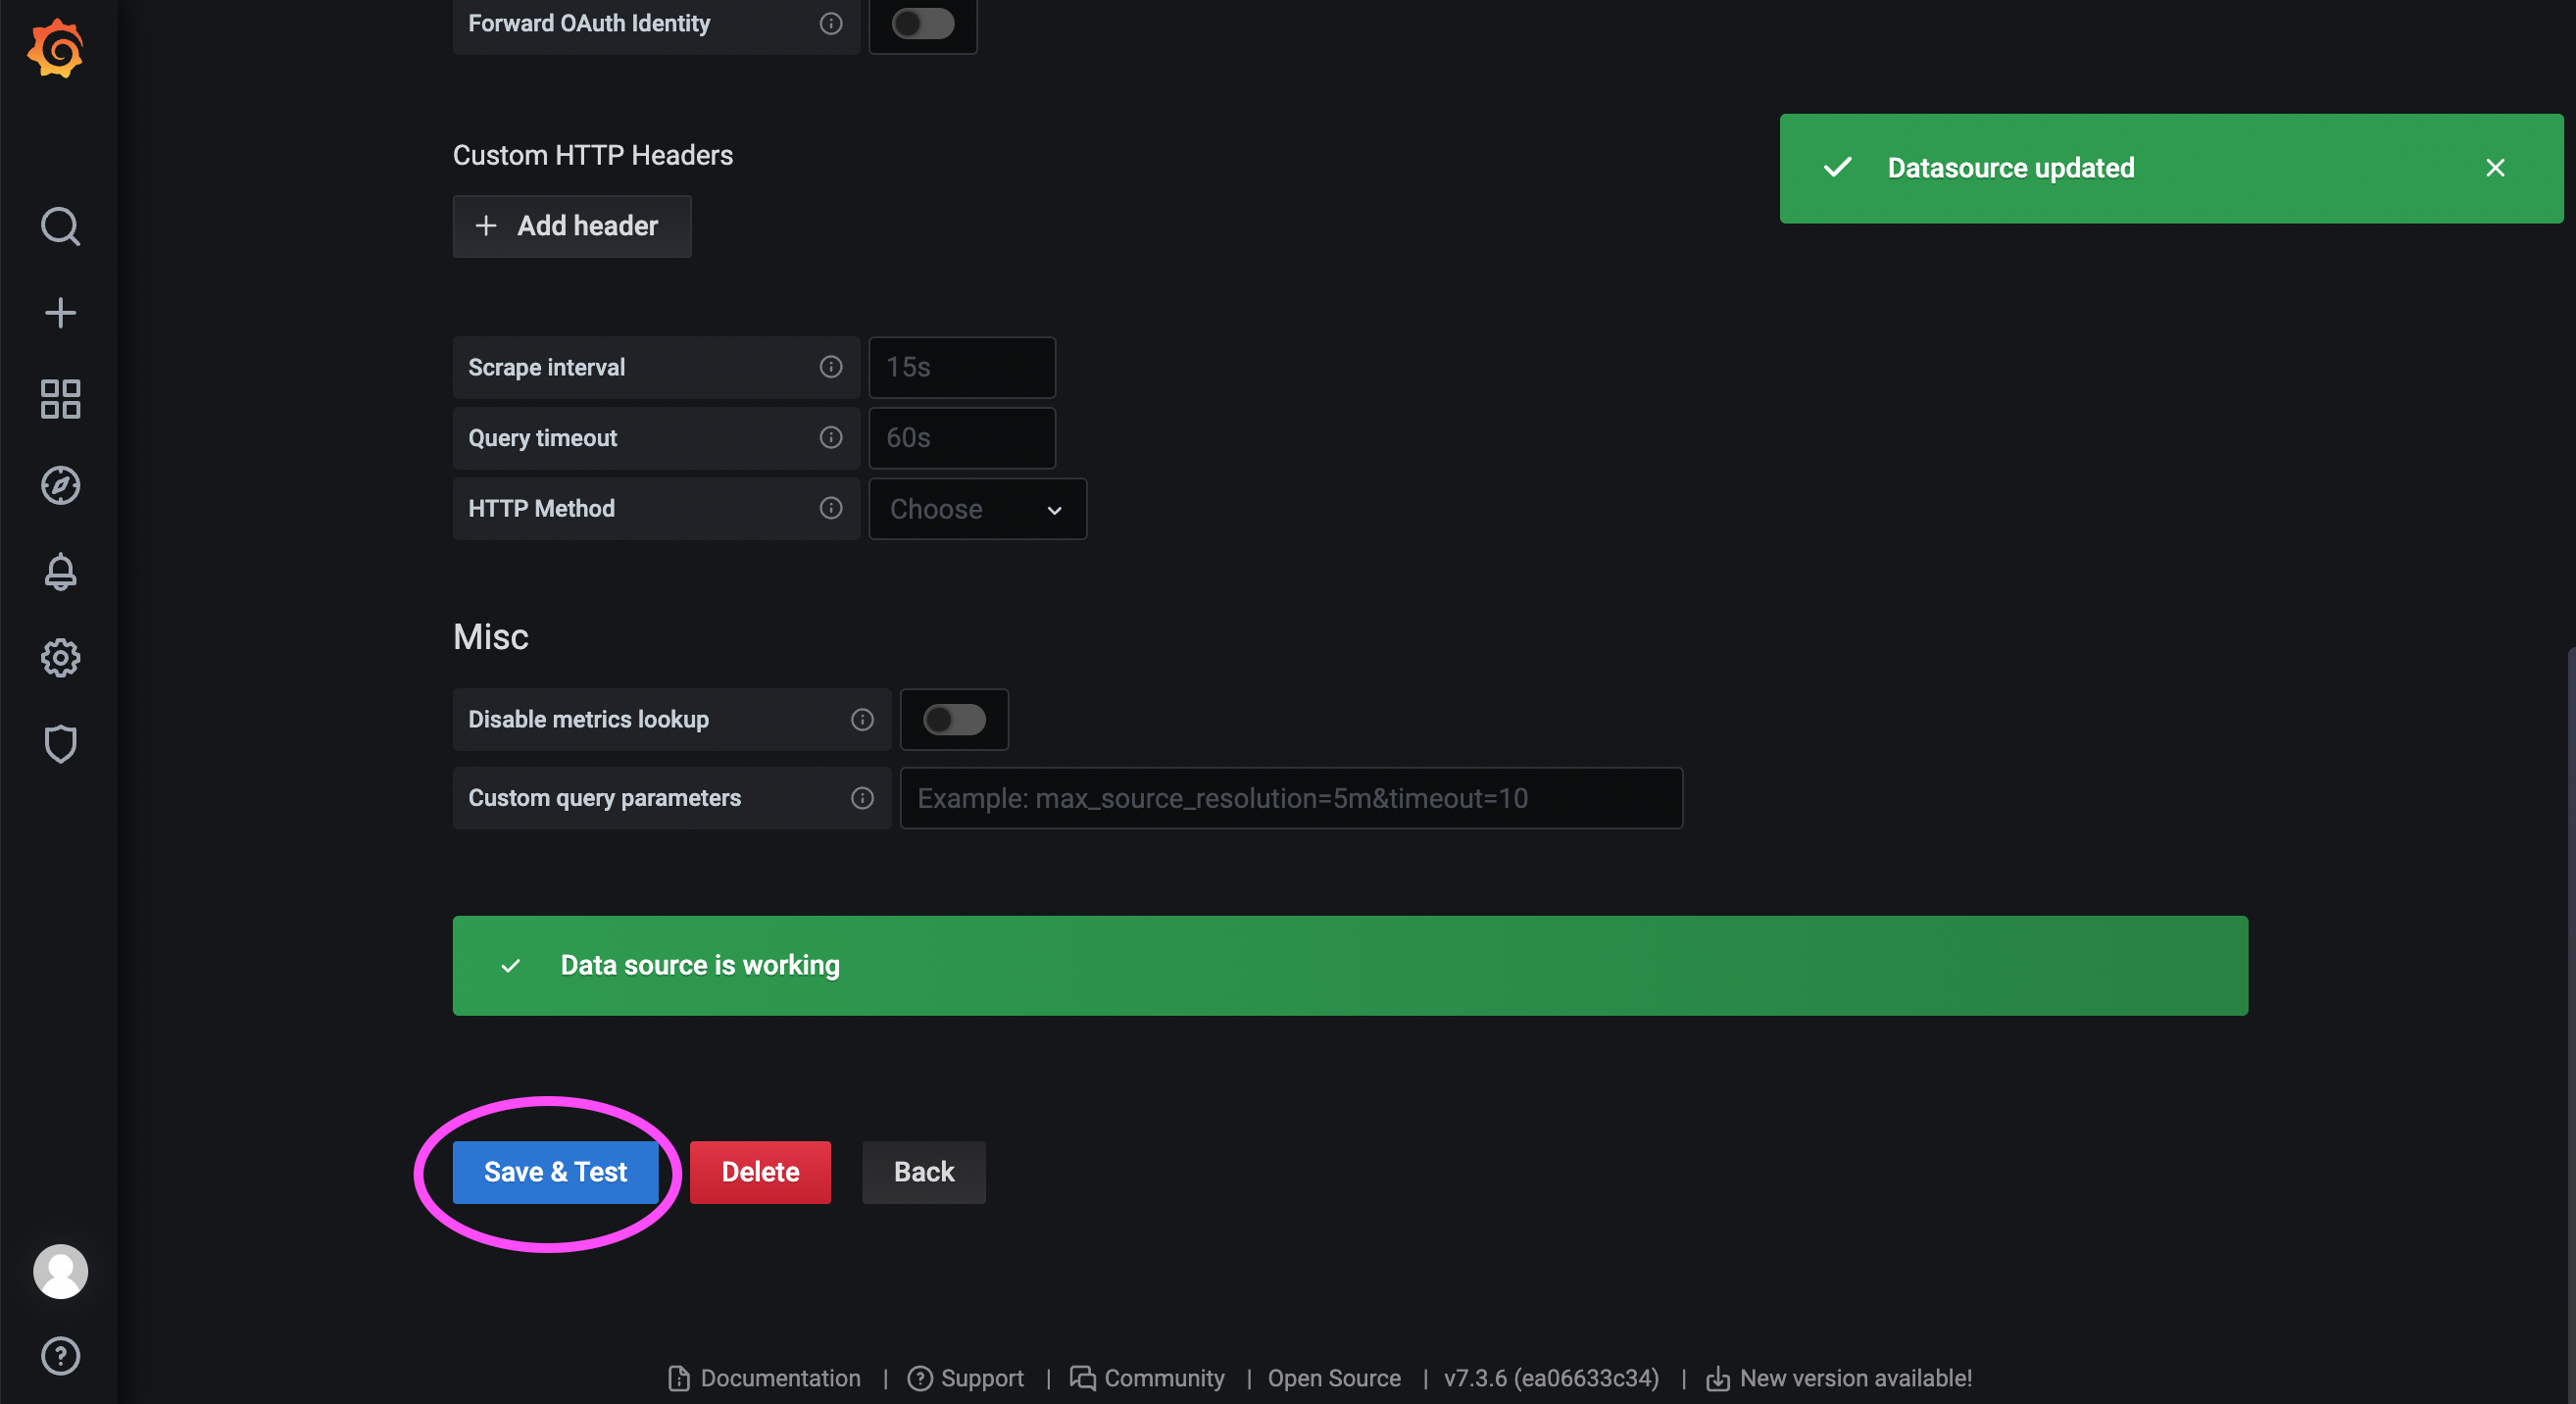
172.31.23.21:9090 is the service port of the Prometheus instance deployed in the previous step.
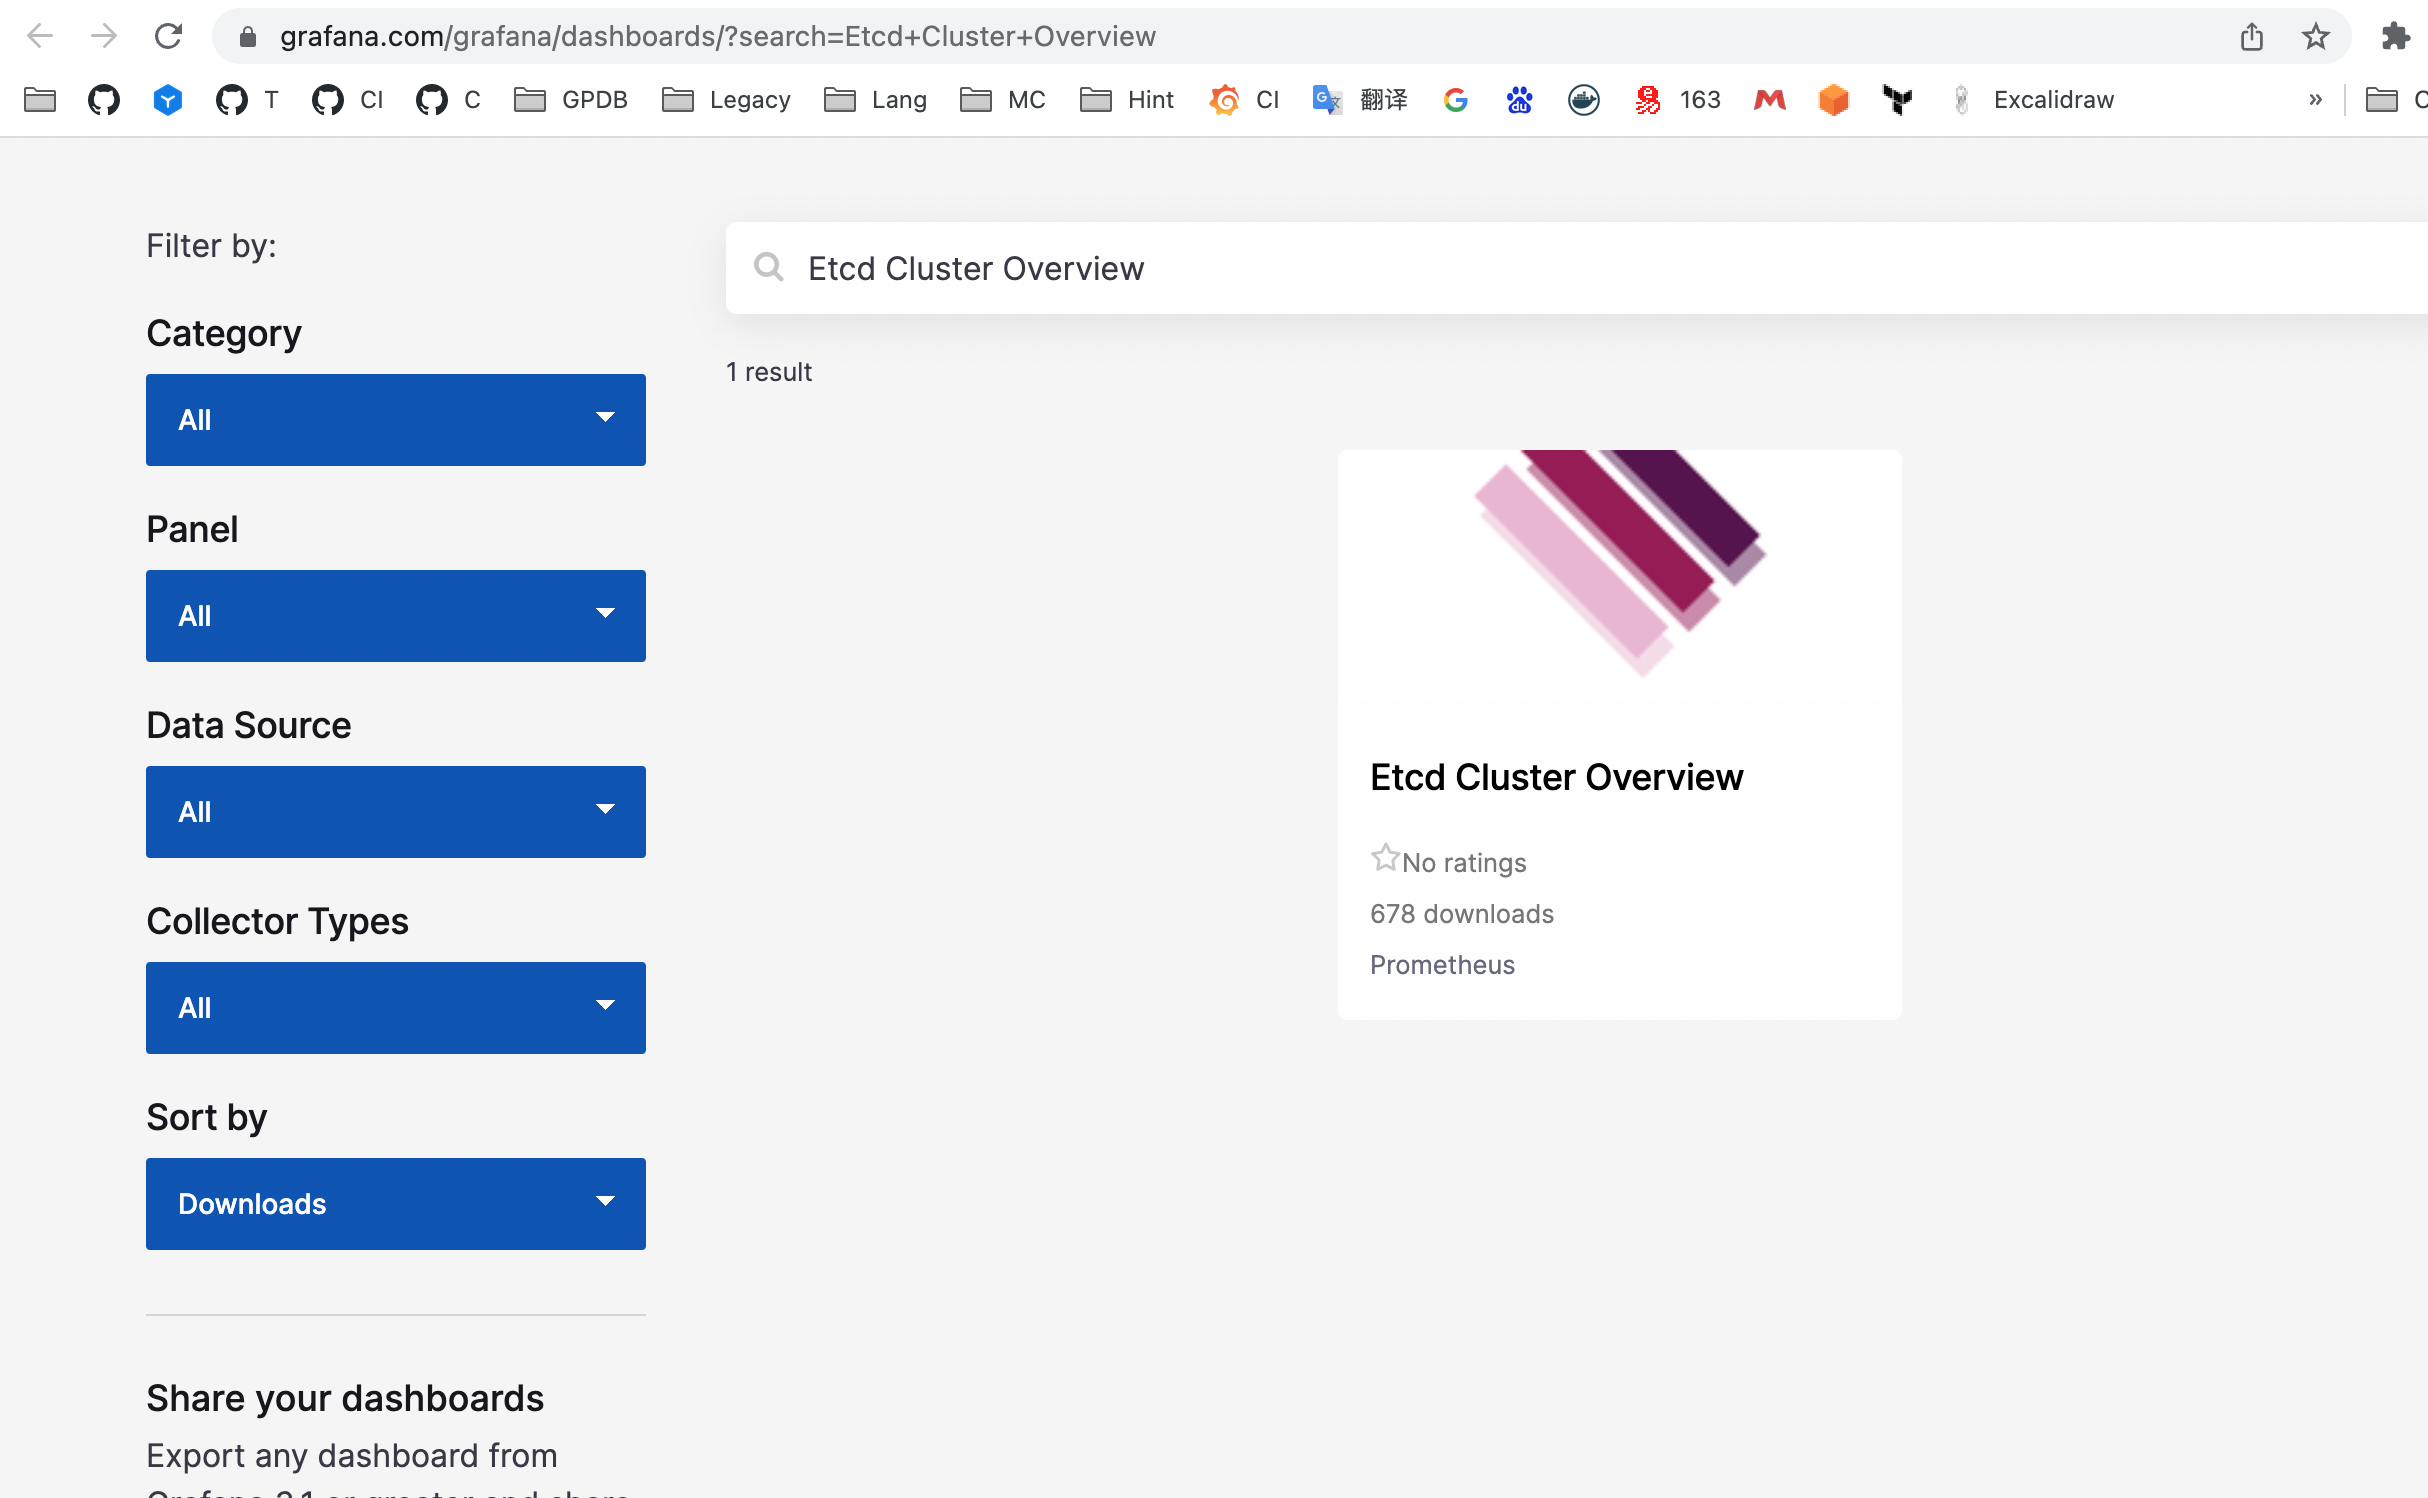
Visit the Grafana community:
https://grafana.com/grafana/dashboards/?search=Etcd+Cluster+Overview
Search results will show available dashboards:
Click into the desired dashboard to get its ID:
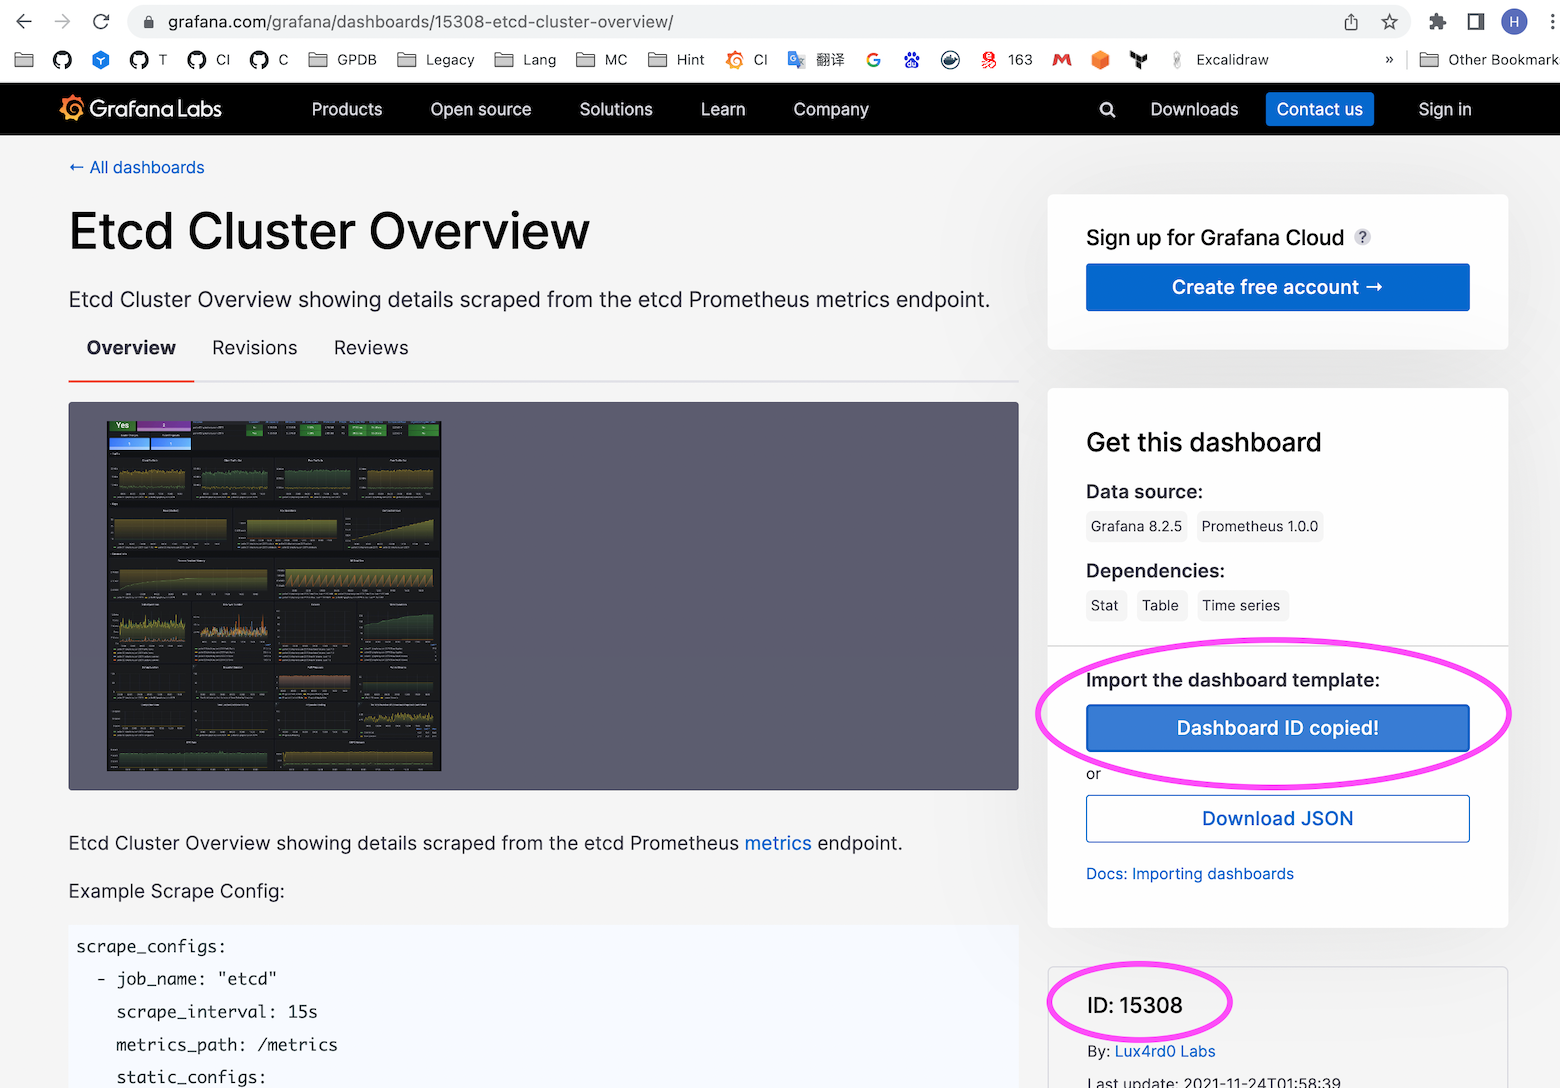
Note!
The dashboard associated with this ID may change over time. Currently it is 15308; users should verify based on their own search results.
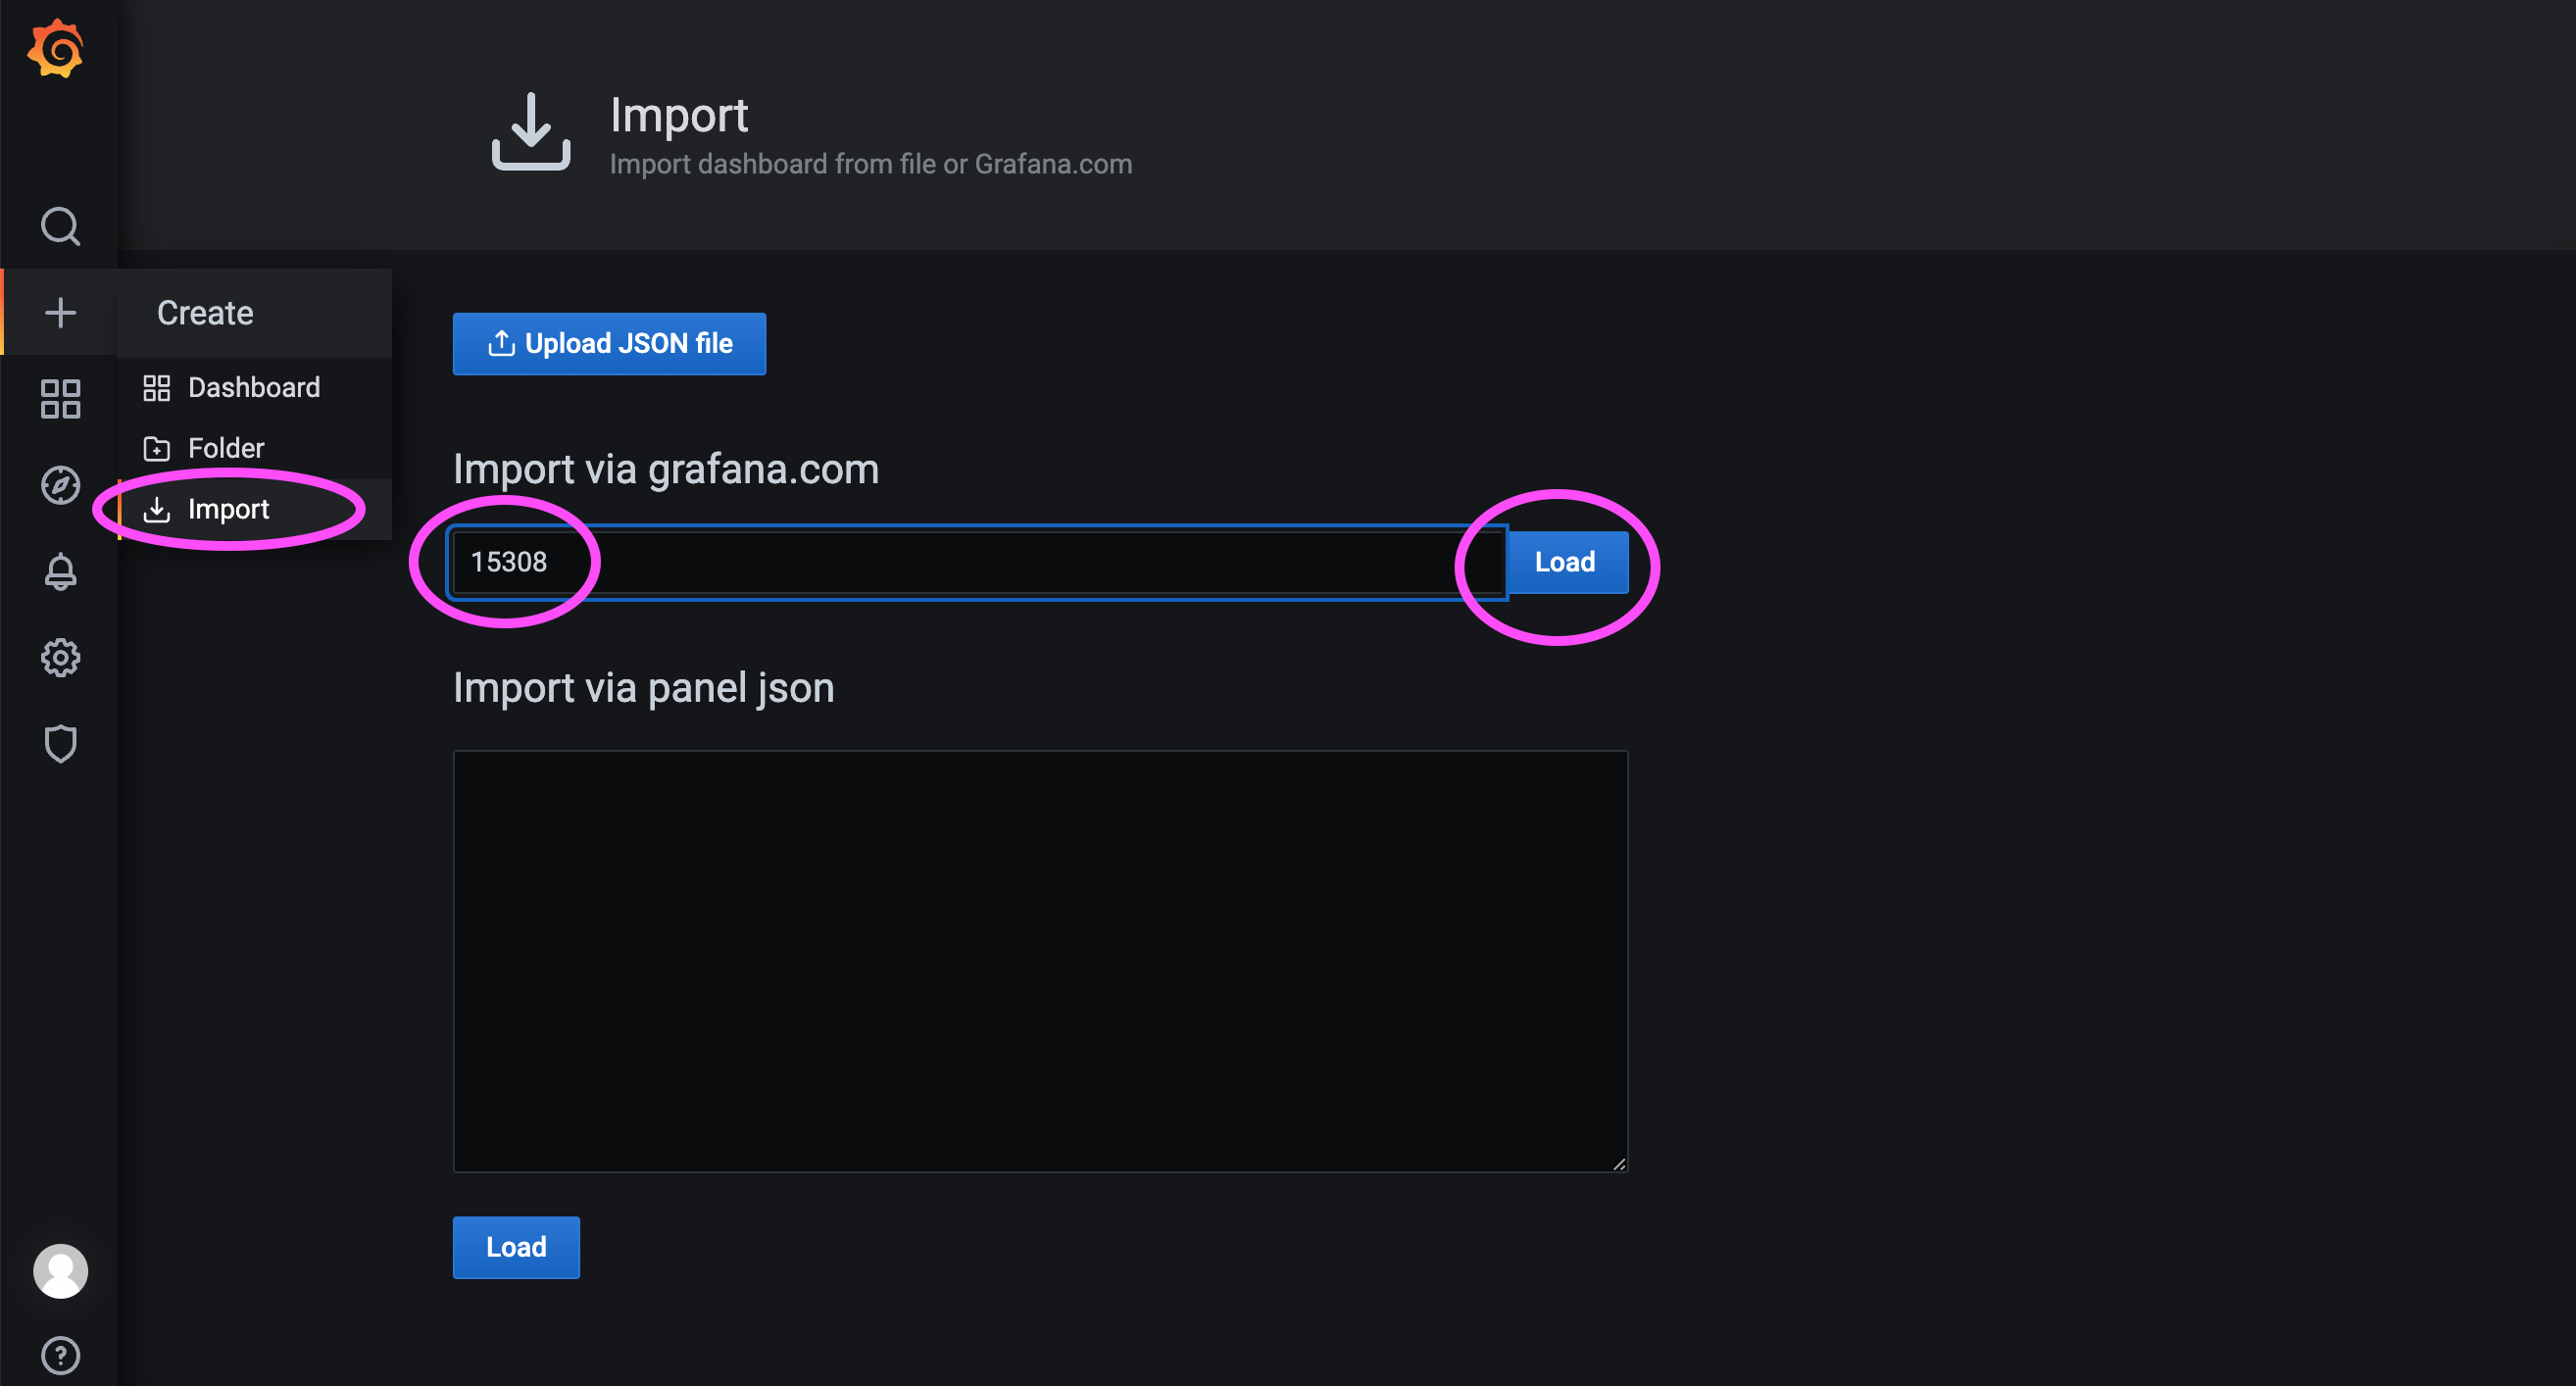
As shown below, import dashboard ID 15308:
Then select the data source configured earlier and load the dashboard:
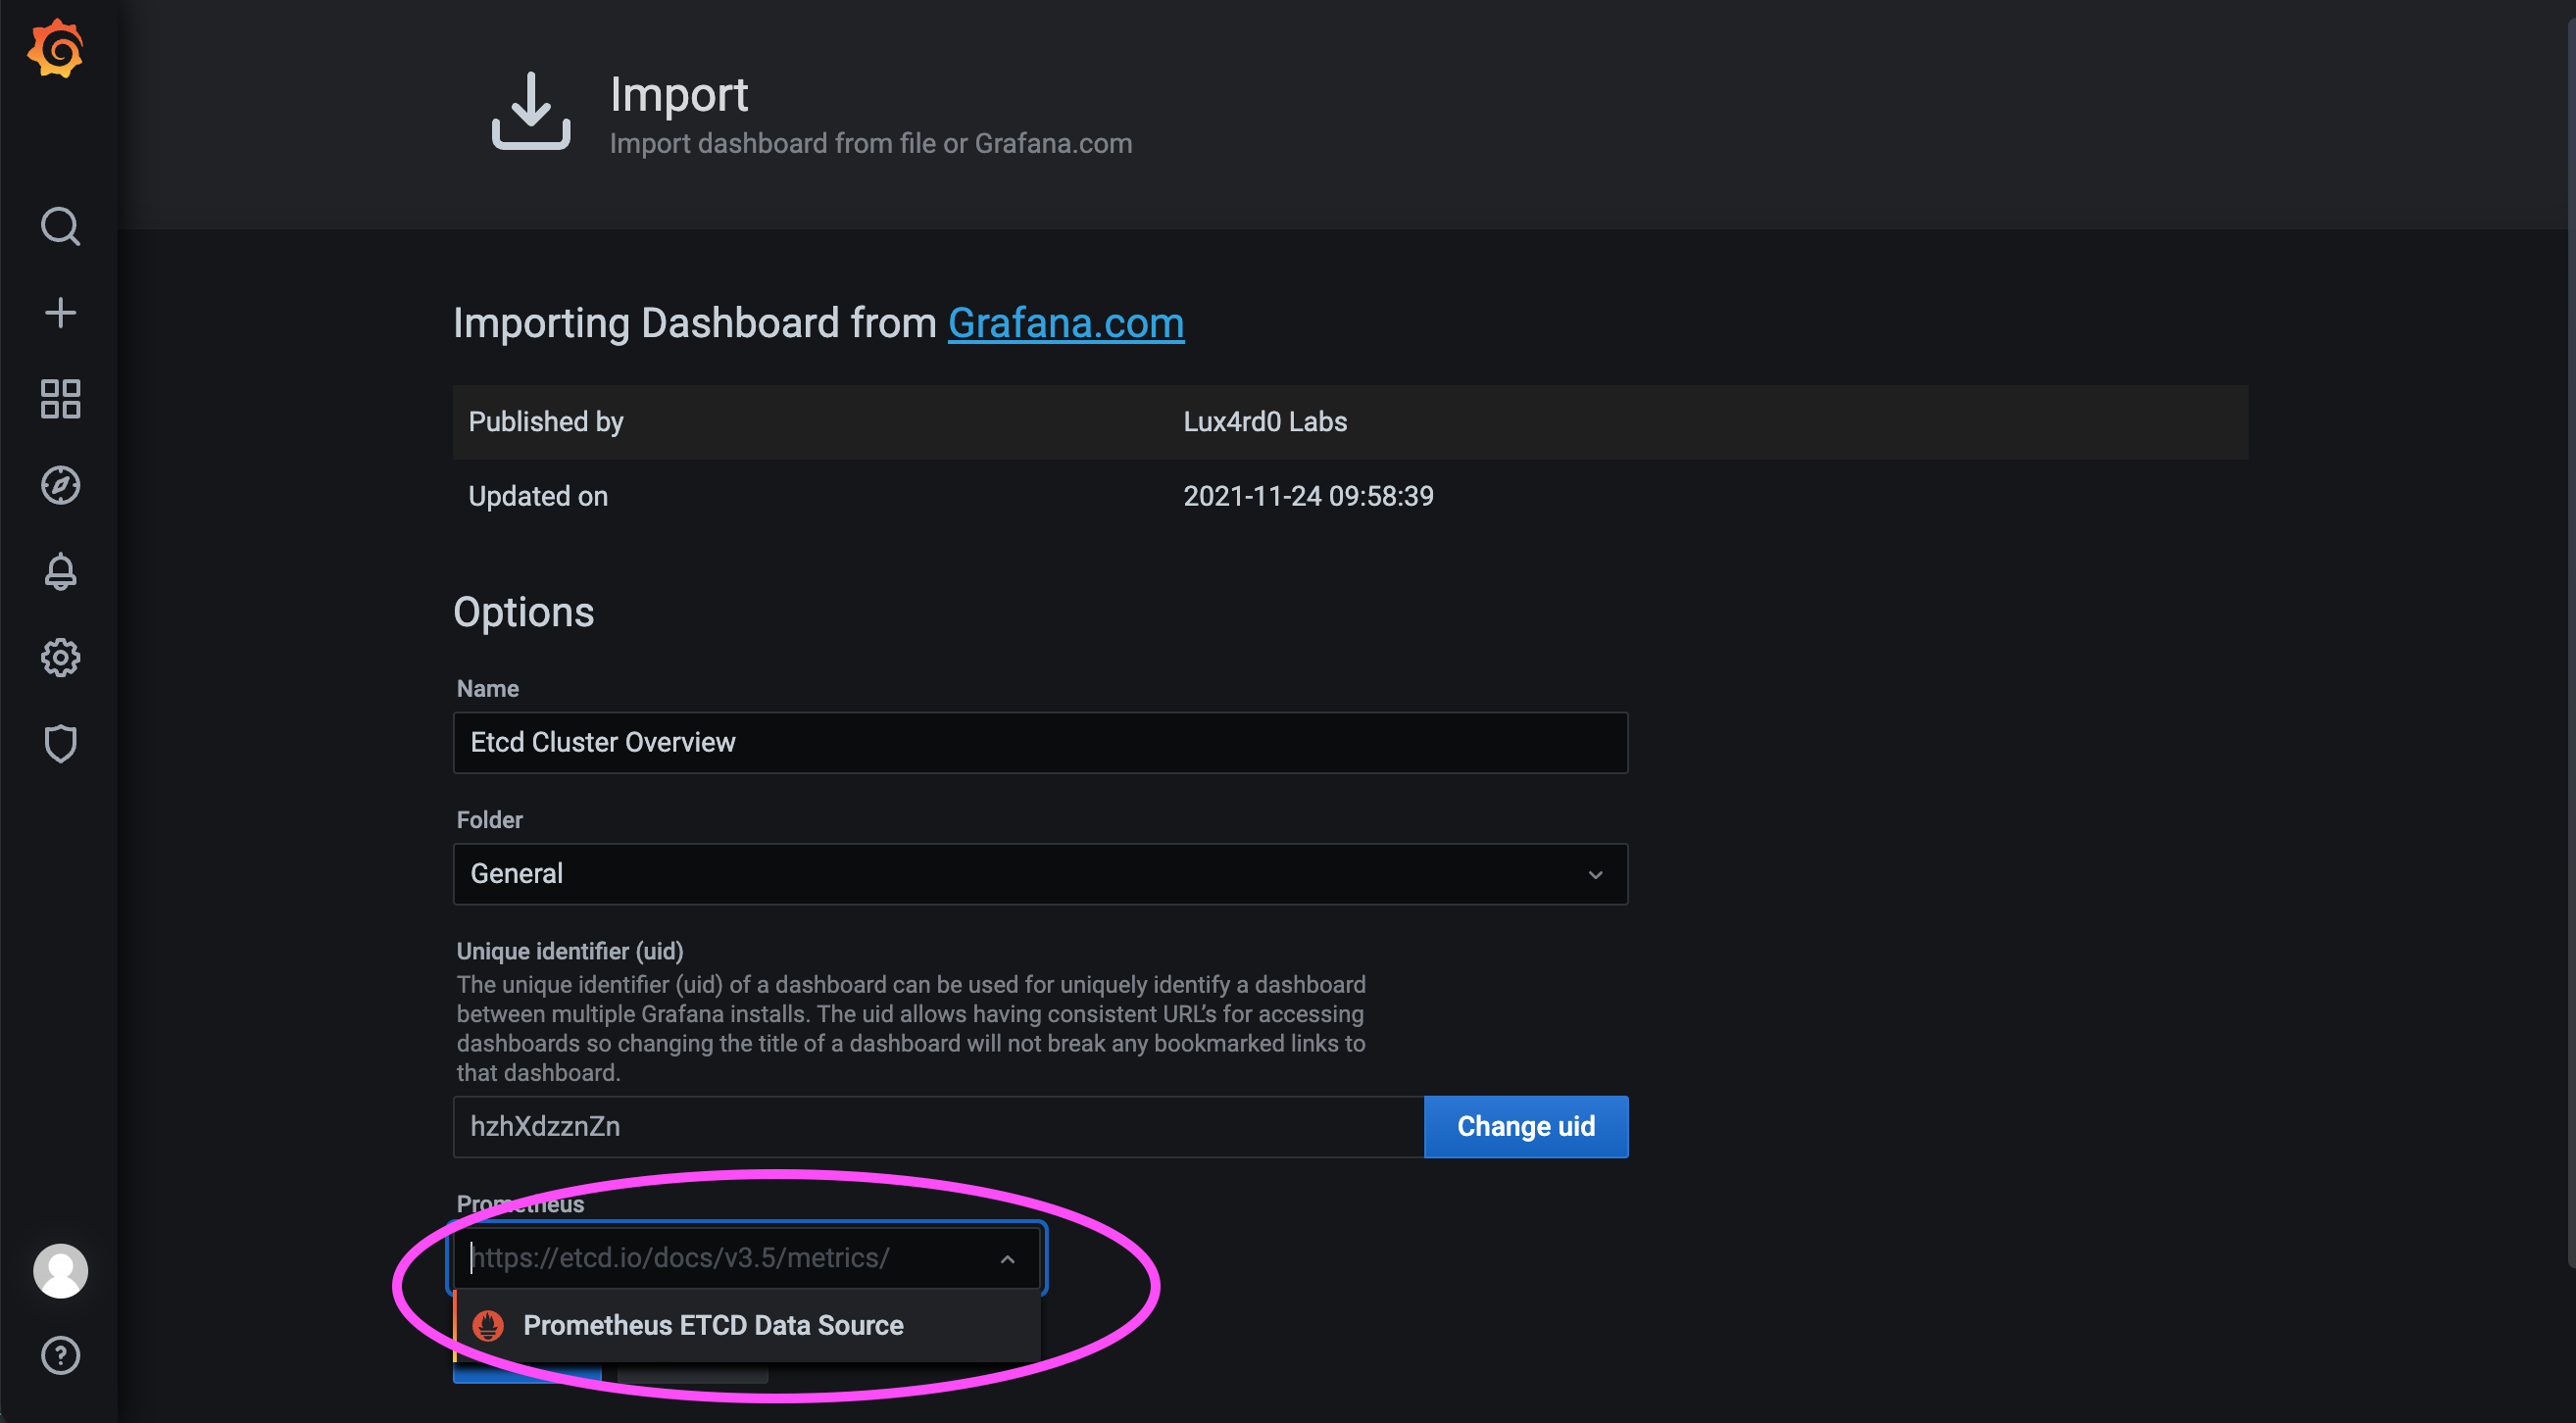
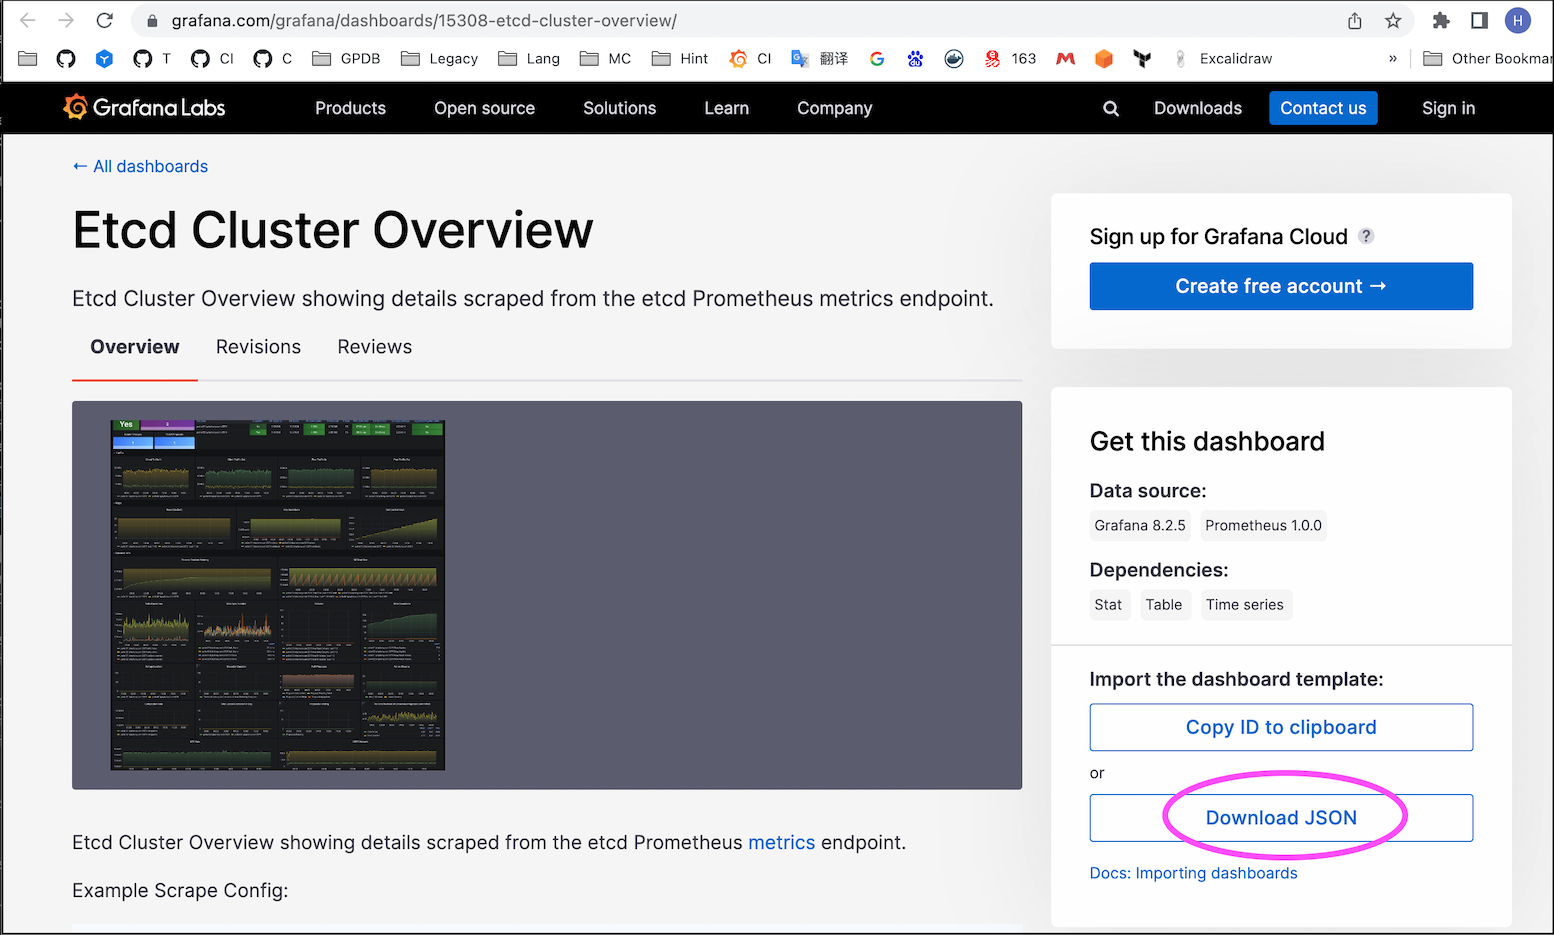
If the server is in an internal network and cannot access the internet, importing by ID 15308 may fail. In that case, download the JSON file of the dashboard from an internet-connected machine and import it manually:
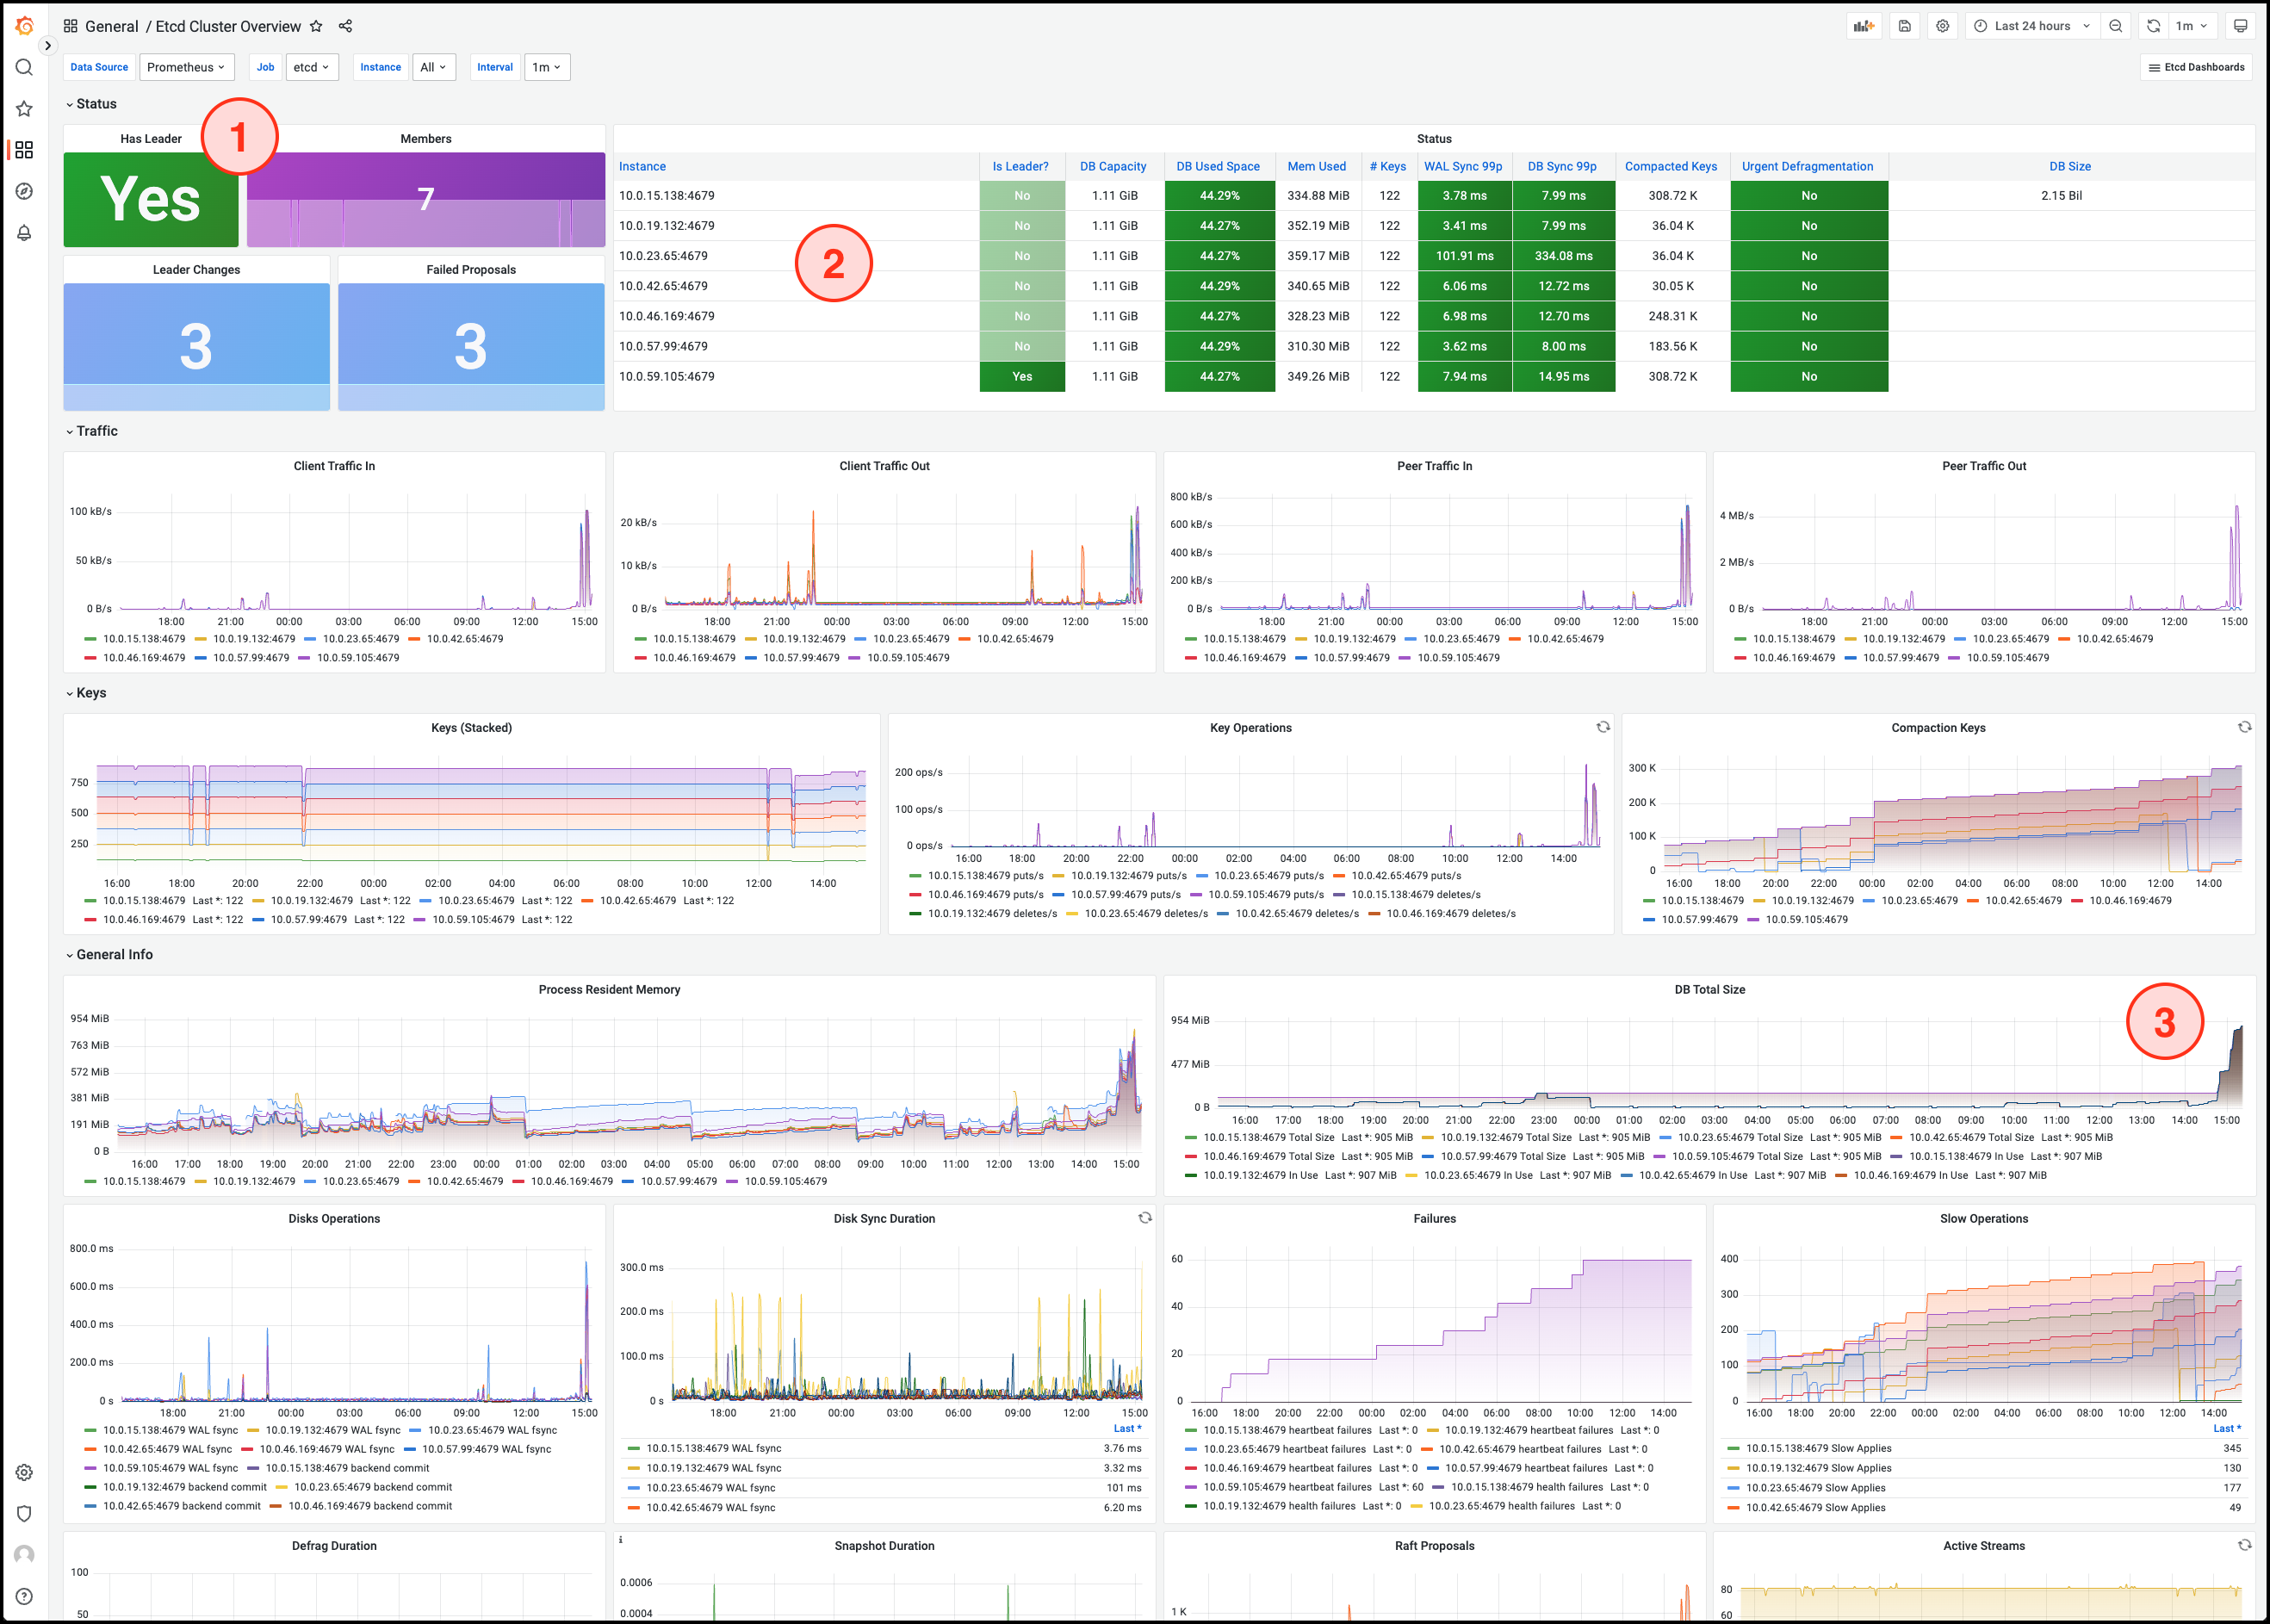
etcd Service Status and Member Count
Quorum Member List and Process Status
DB Total Size
This graph shows the growth of etcd data over time. An abnormal increase may lead to the database reaching its size limit.
Note!
For more metrics and detailed explanations, refer to the etcd official documentation.