Quick onboard
Deployment
Data Modeling
Connection
Migration
Query
Operations and Maintenance
Common Maintenance
Partition
Backup and Restore
Expansion
Monitoring
Performance Tuning
Troubleshooting
Reference Guide
Tool guide
Data Type
Storage Engine
Executor
Stream
DR (Disaster Recovery)
Configuration
Index
Extension
SQL Reference
Note! Disaster recovery capability is only available as an experimental feature in YMatrix 6.0.0.
This section describes how to use a graphical interface or command line tool to monitor the running status of a disaster recovery feature.
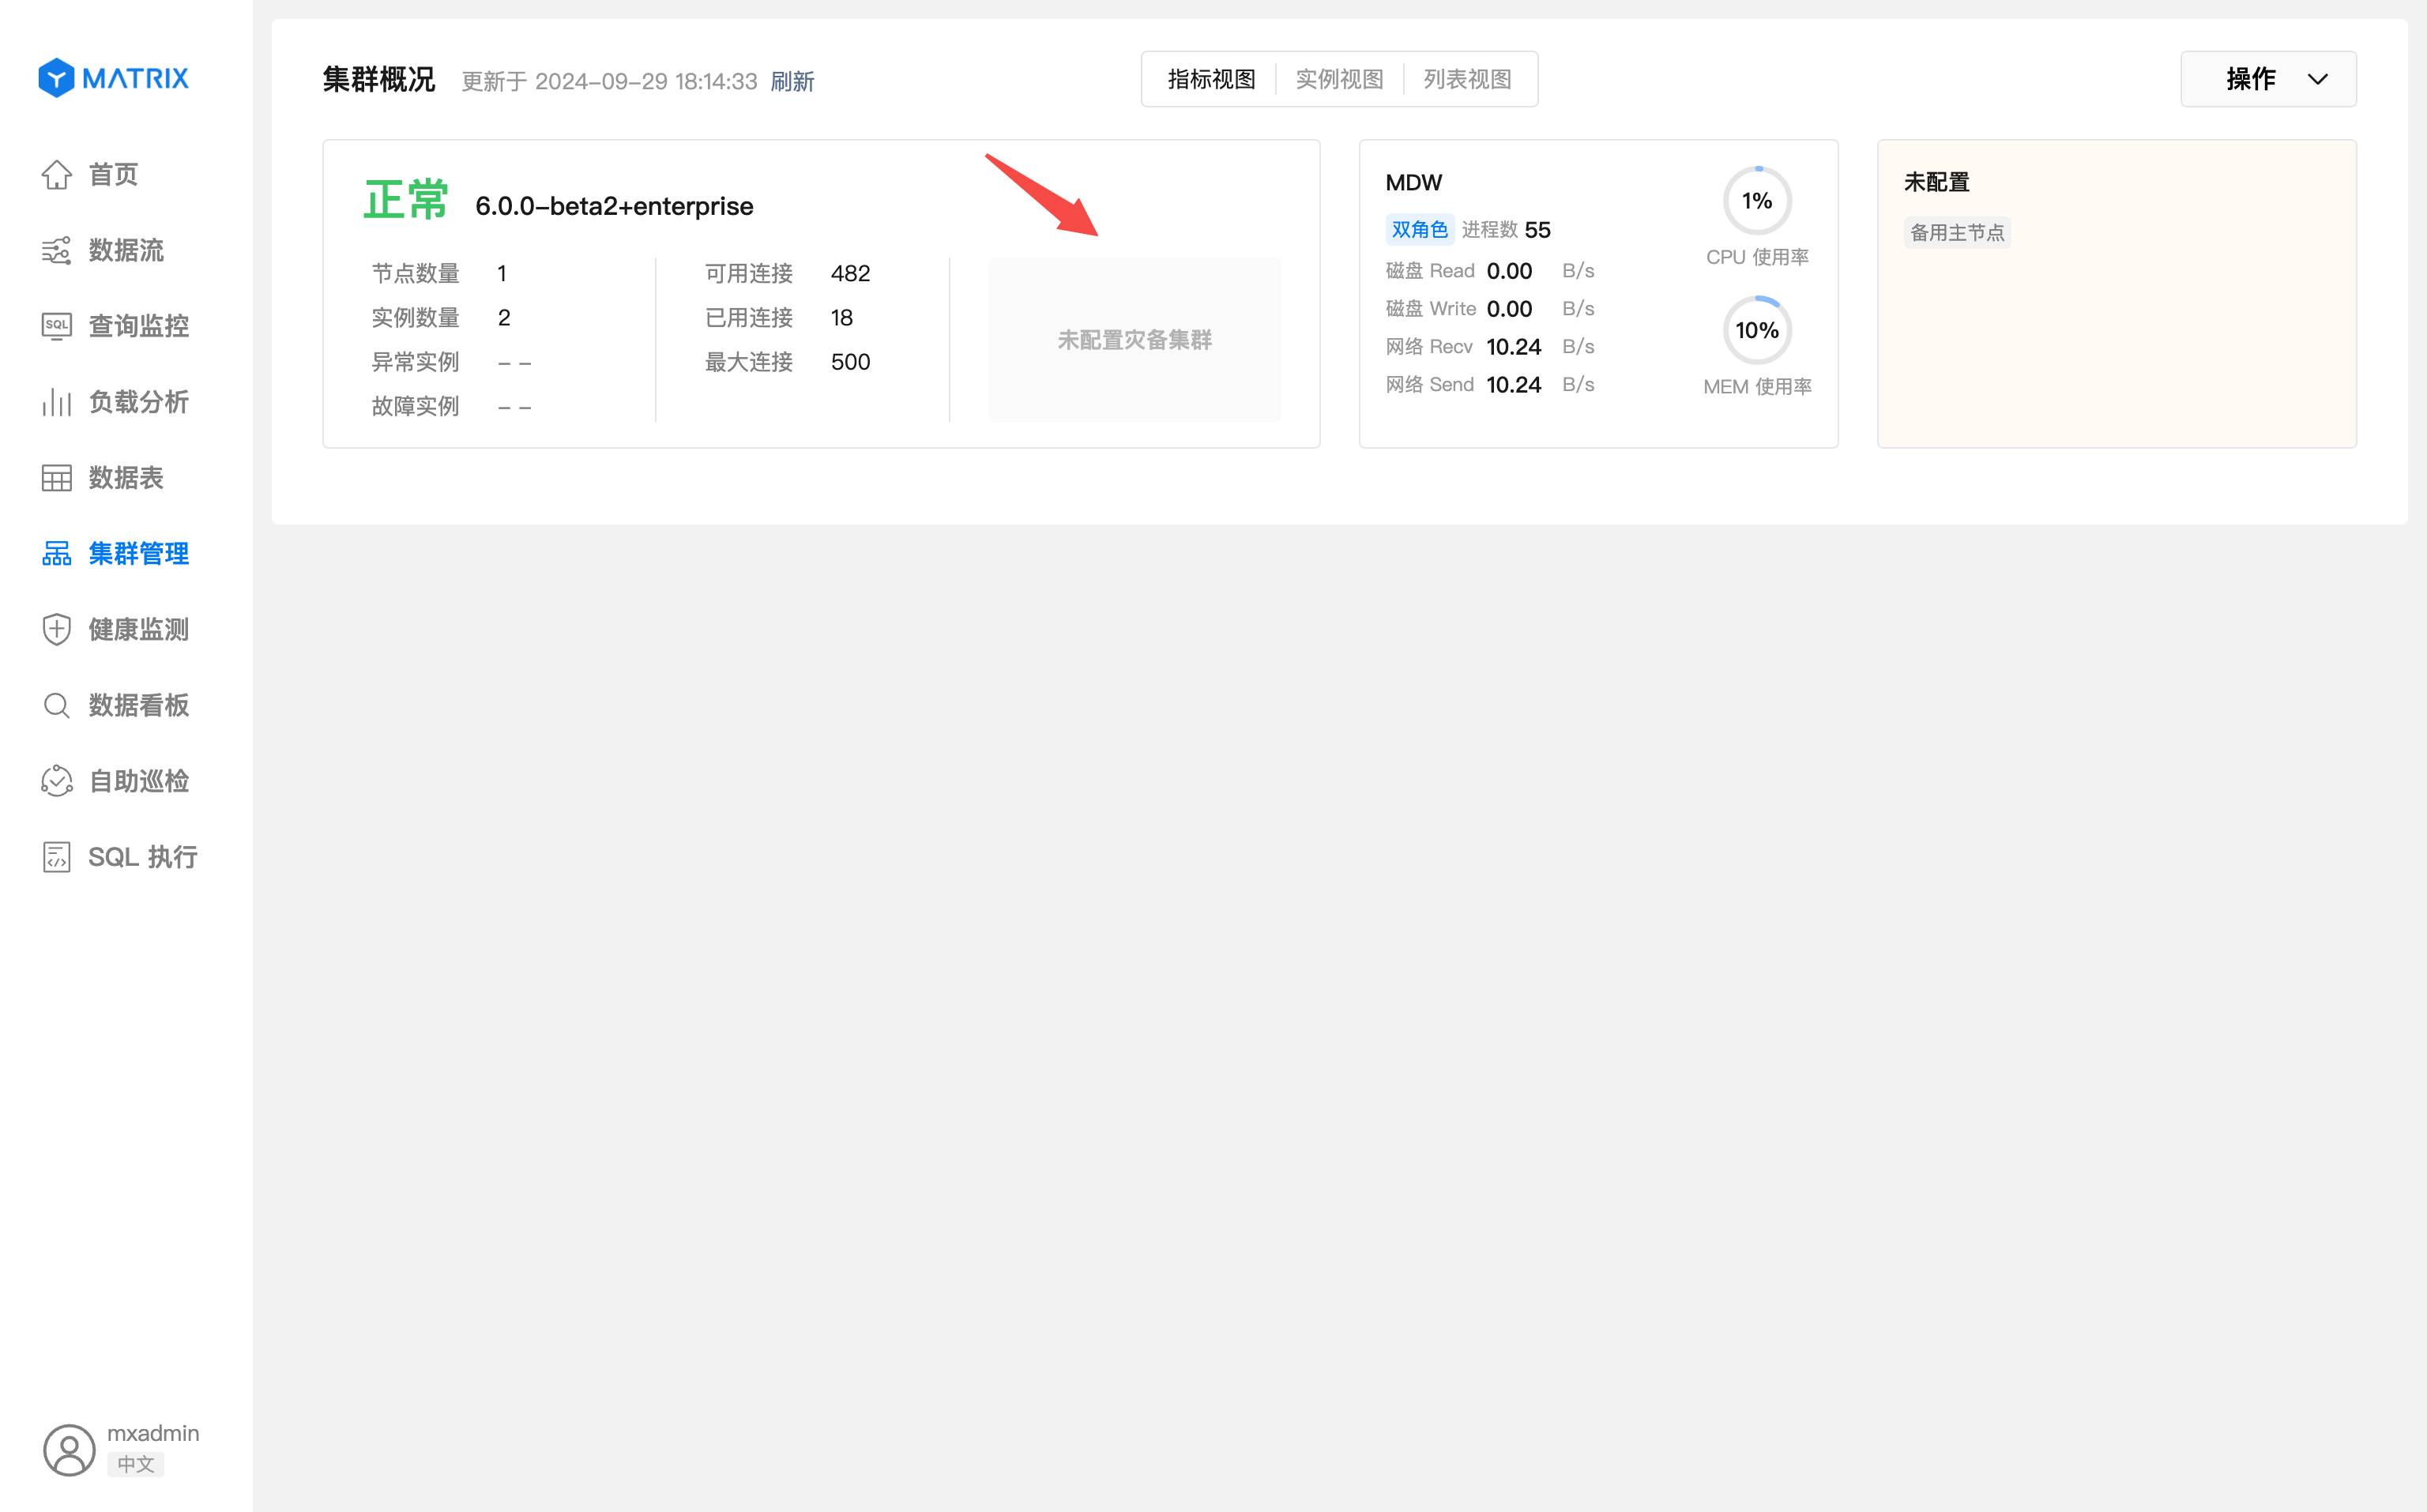
Log in to the UI and open the Cluster Management page. If the current cluster does not configure the backup cluster, the page will display the following content:
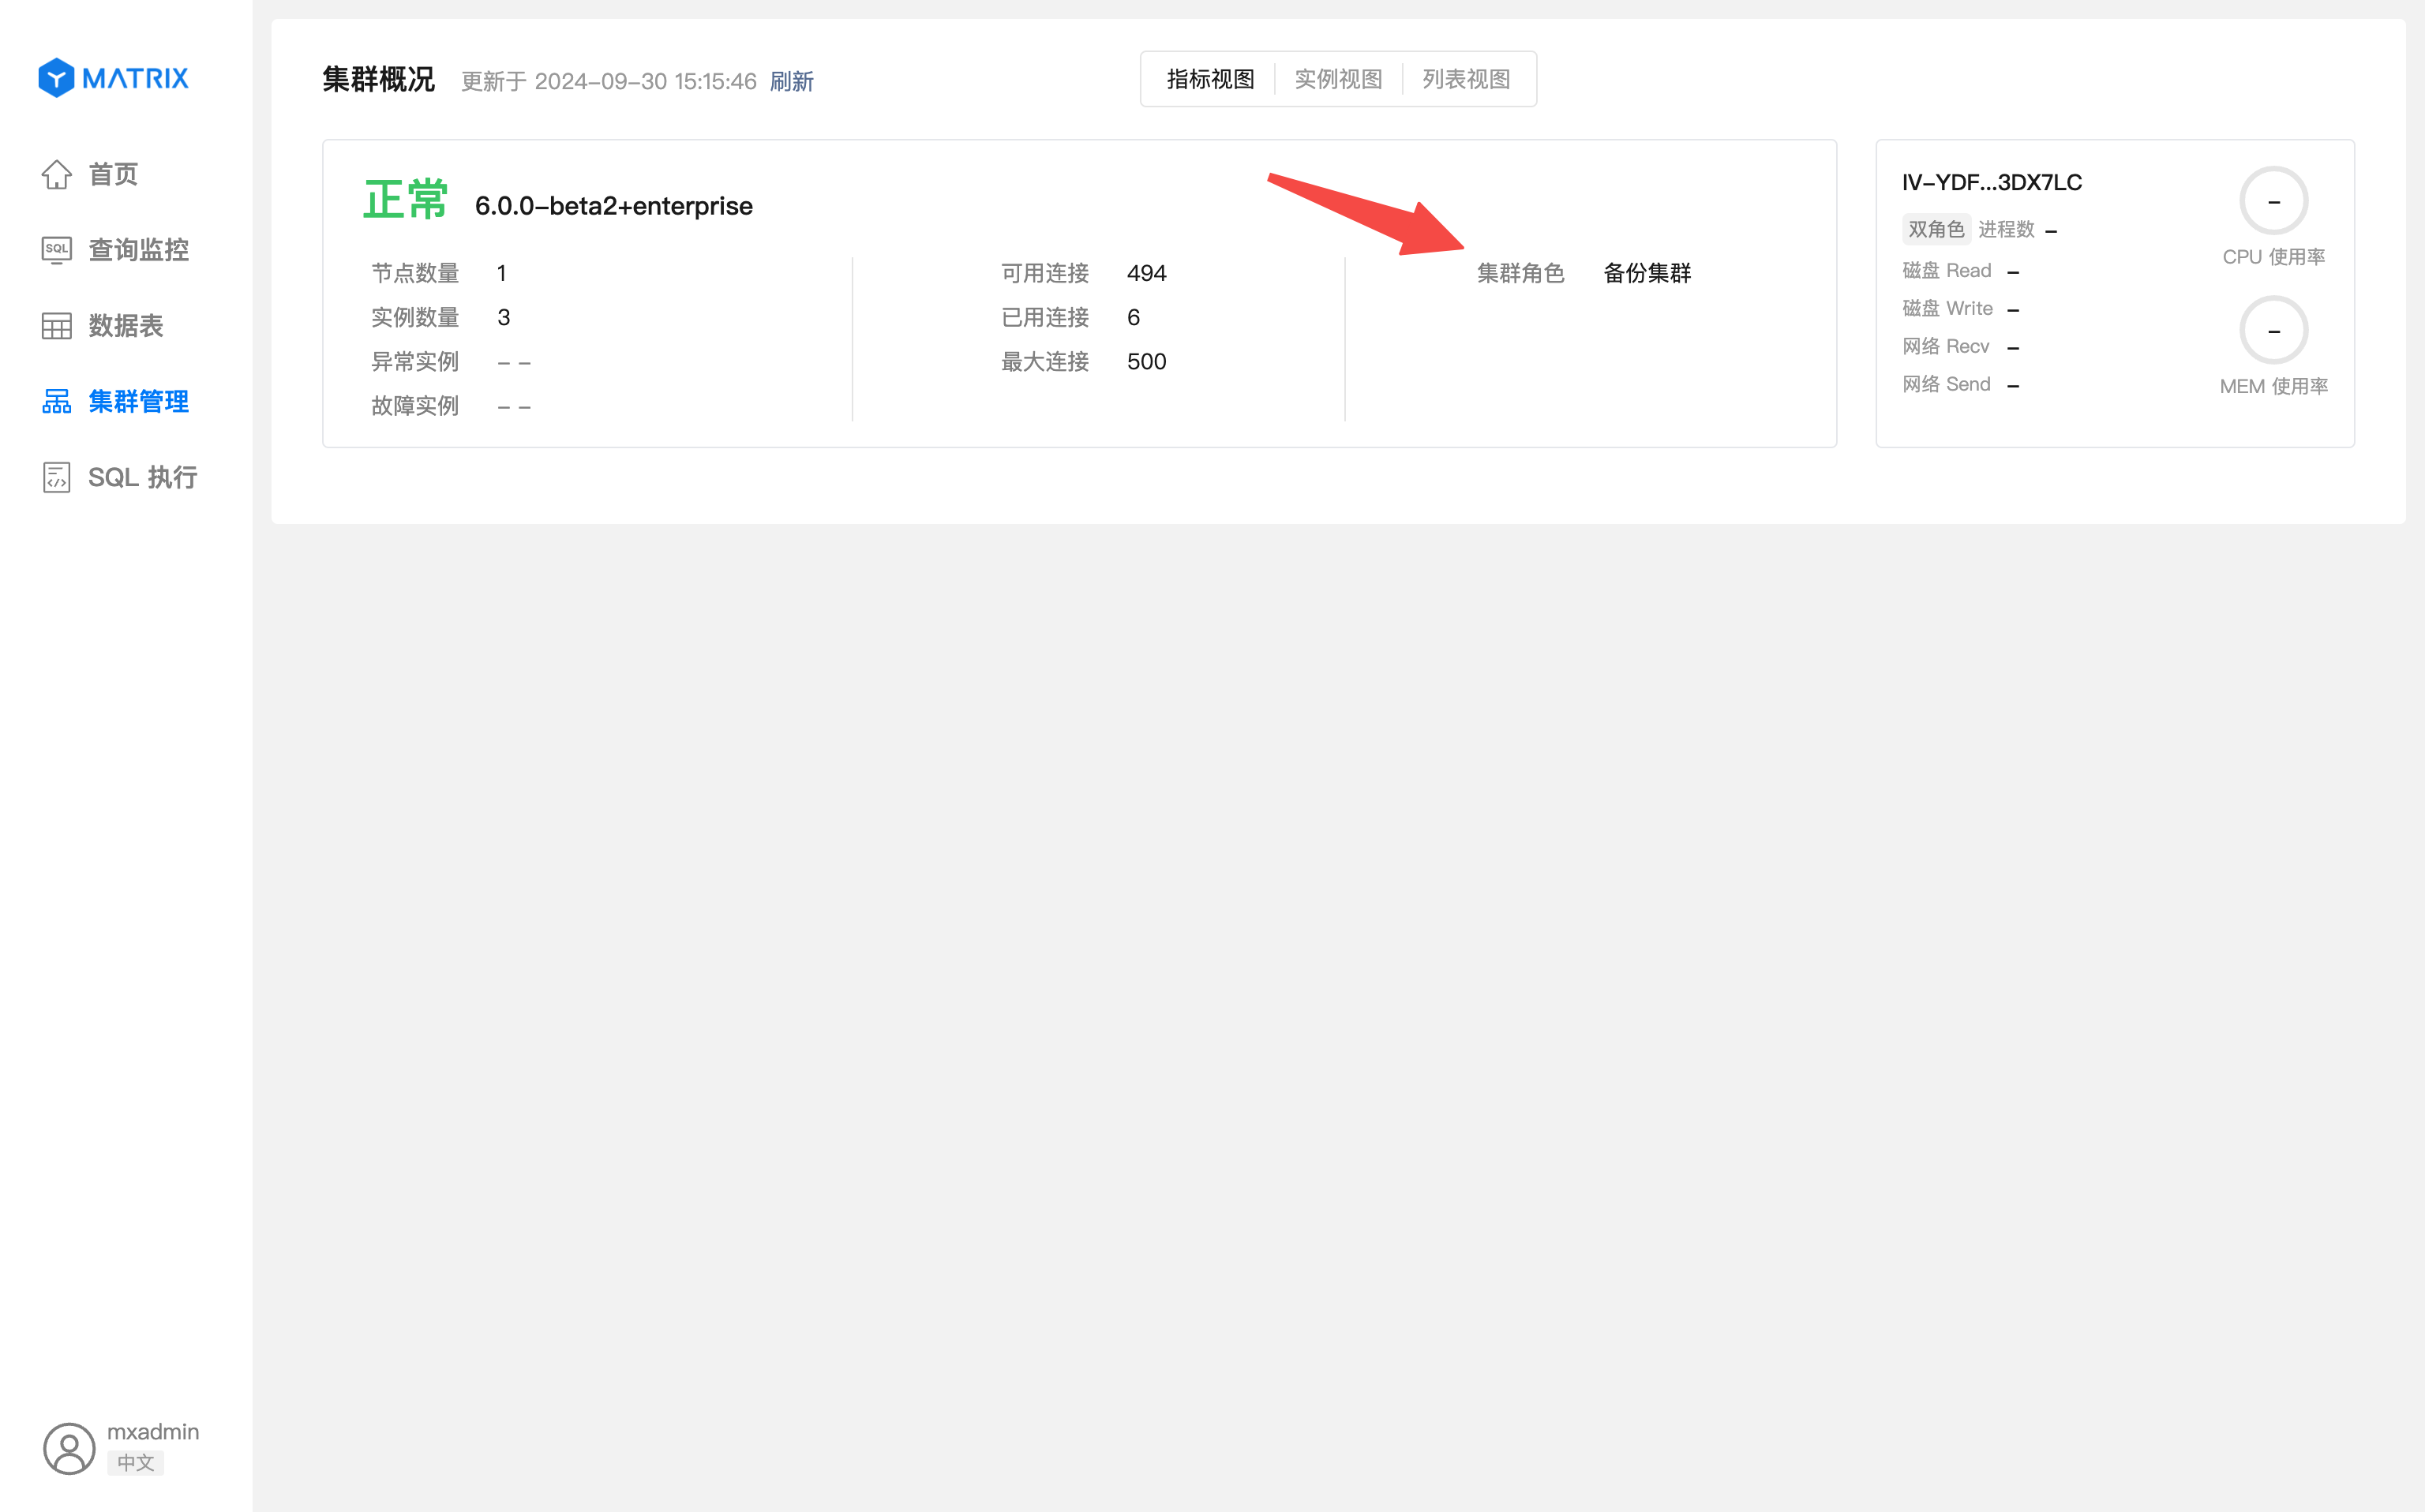
If the current cluster has configured a backup cluster, there are two roles in the disaster recovery architecture:
a. Main cluster On the main cluster page, the system will display three important information: cluster role, synchronization mode and synchronization status.
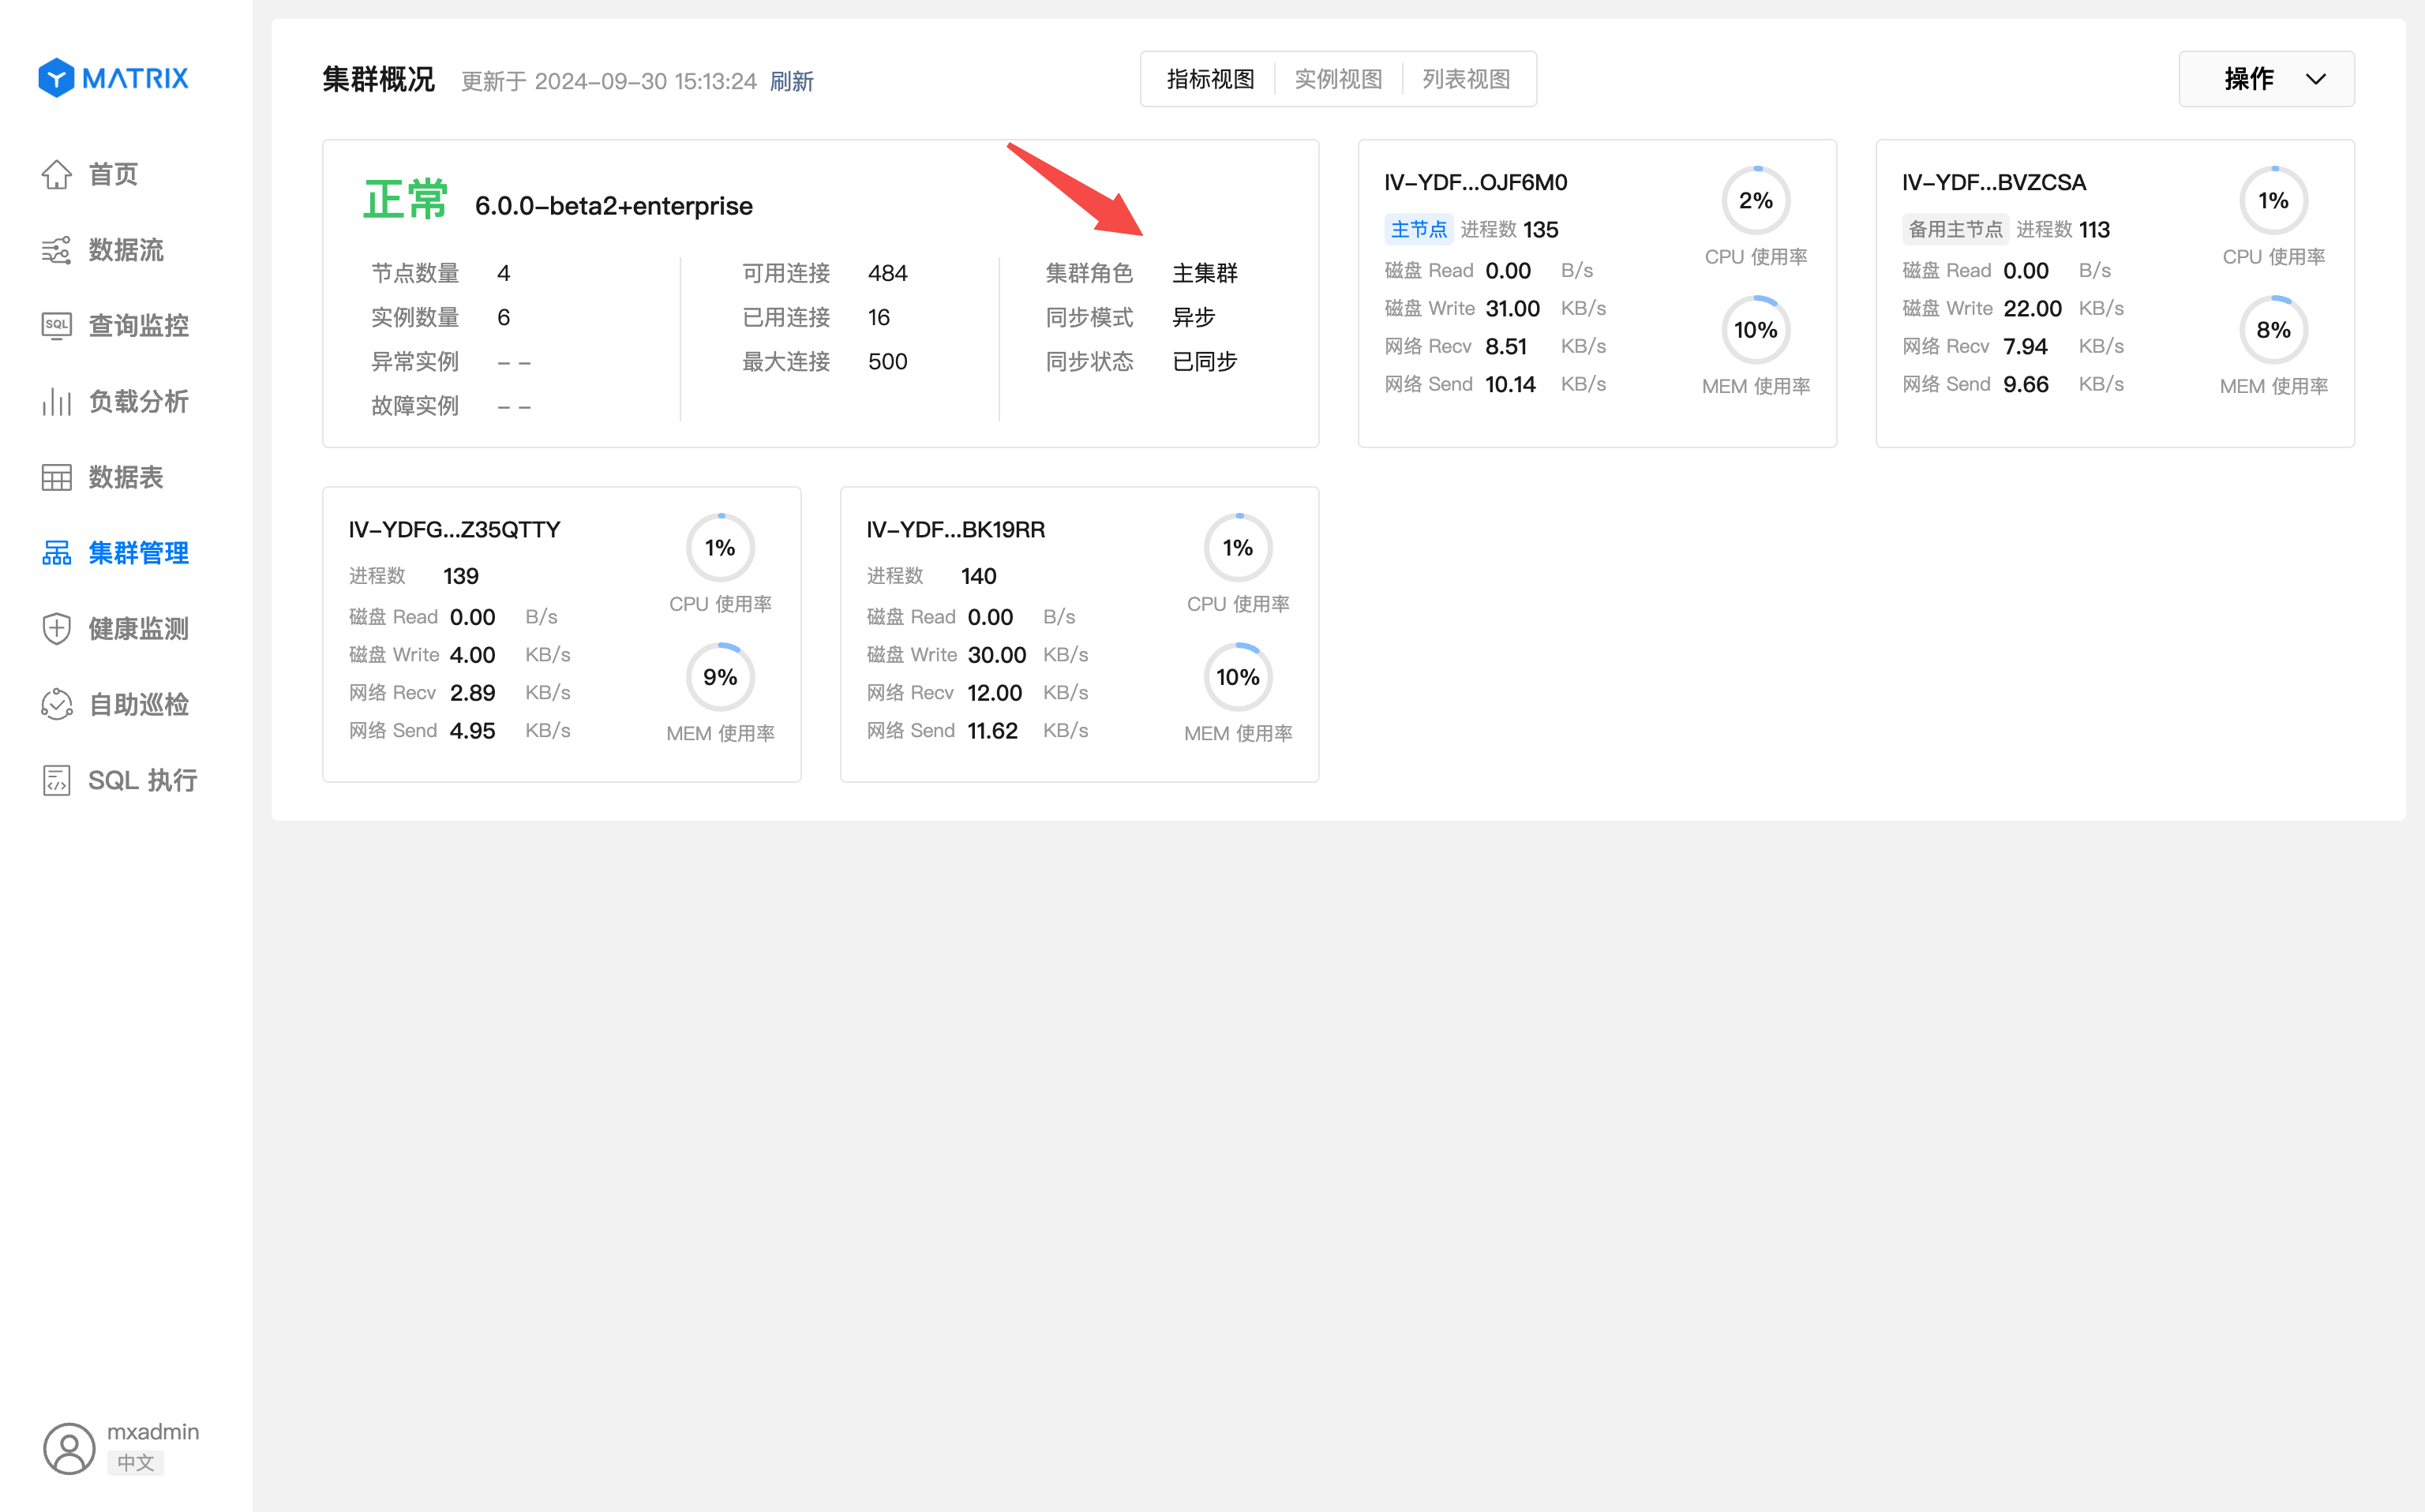
Synchronous mode
sync, asynchronous and unrecognized.synchronous_standby_names parameter in the database configuration, where * represents the synchronous state, the null character represents the asynchronous state, and other values are considered to be unrecognized state.Synchronous status
Synchronized, Synchronized and Fault.Synchronized: The states of all synchronized replication streams have been synchronized;Synchronous: There is an active synchronous replication stream and synchronization is not fully completed;Fault: There is an inactive synchronous replication stream.b. Backup cluster
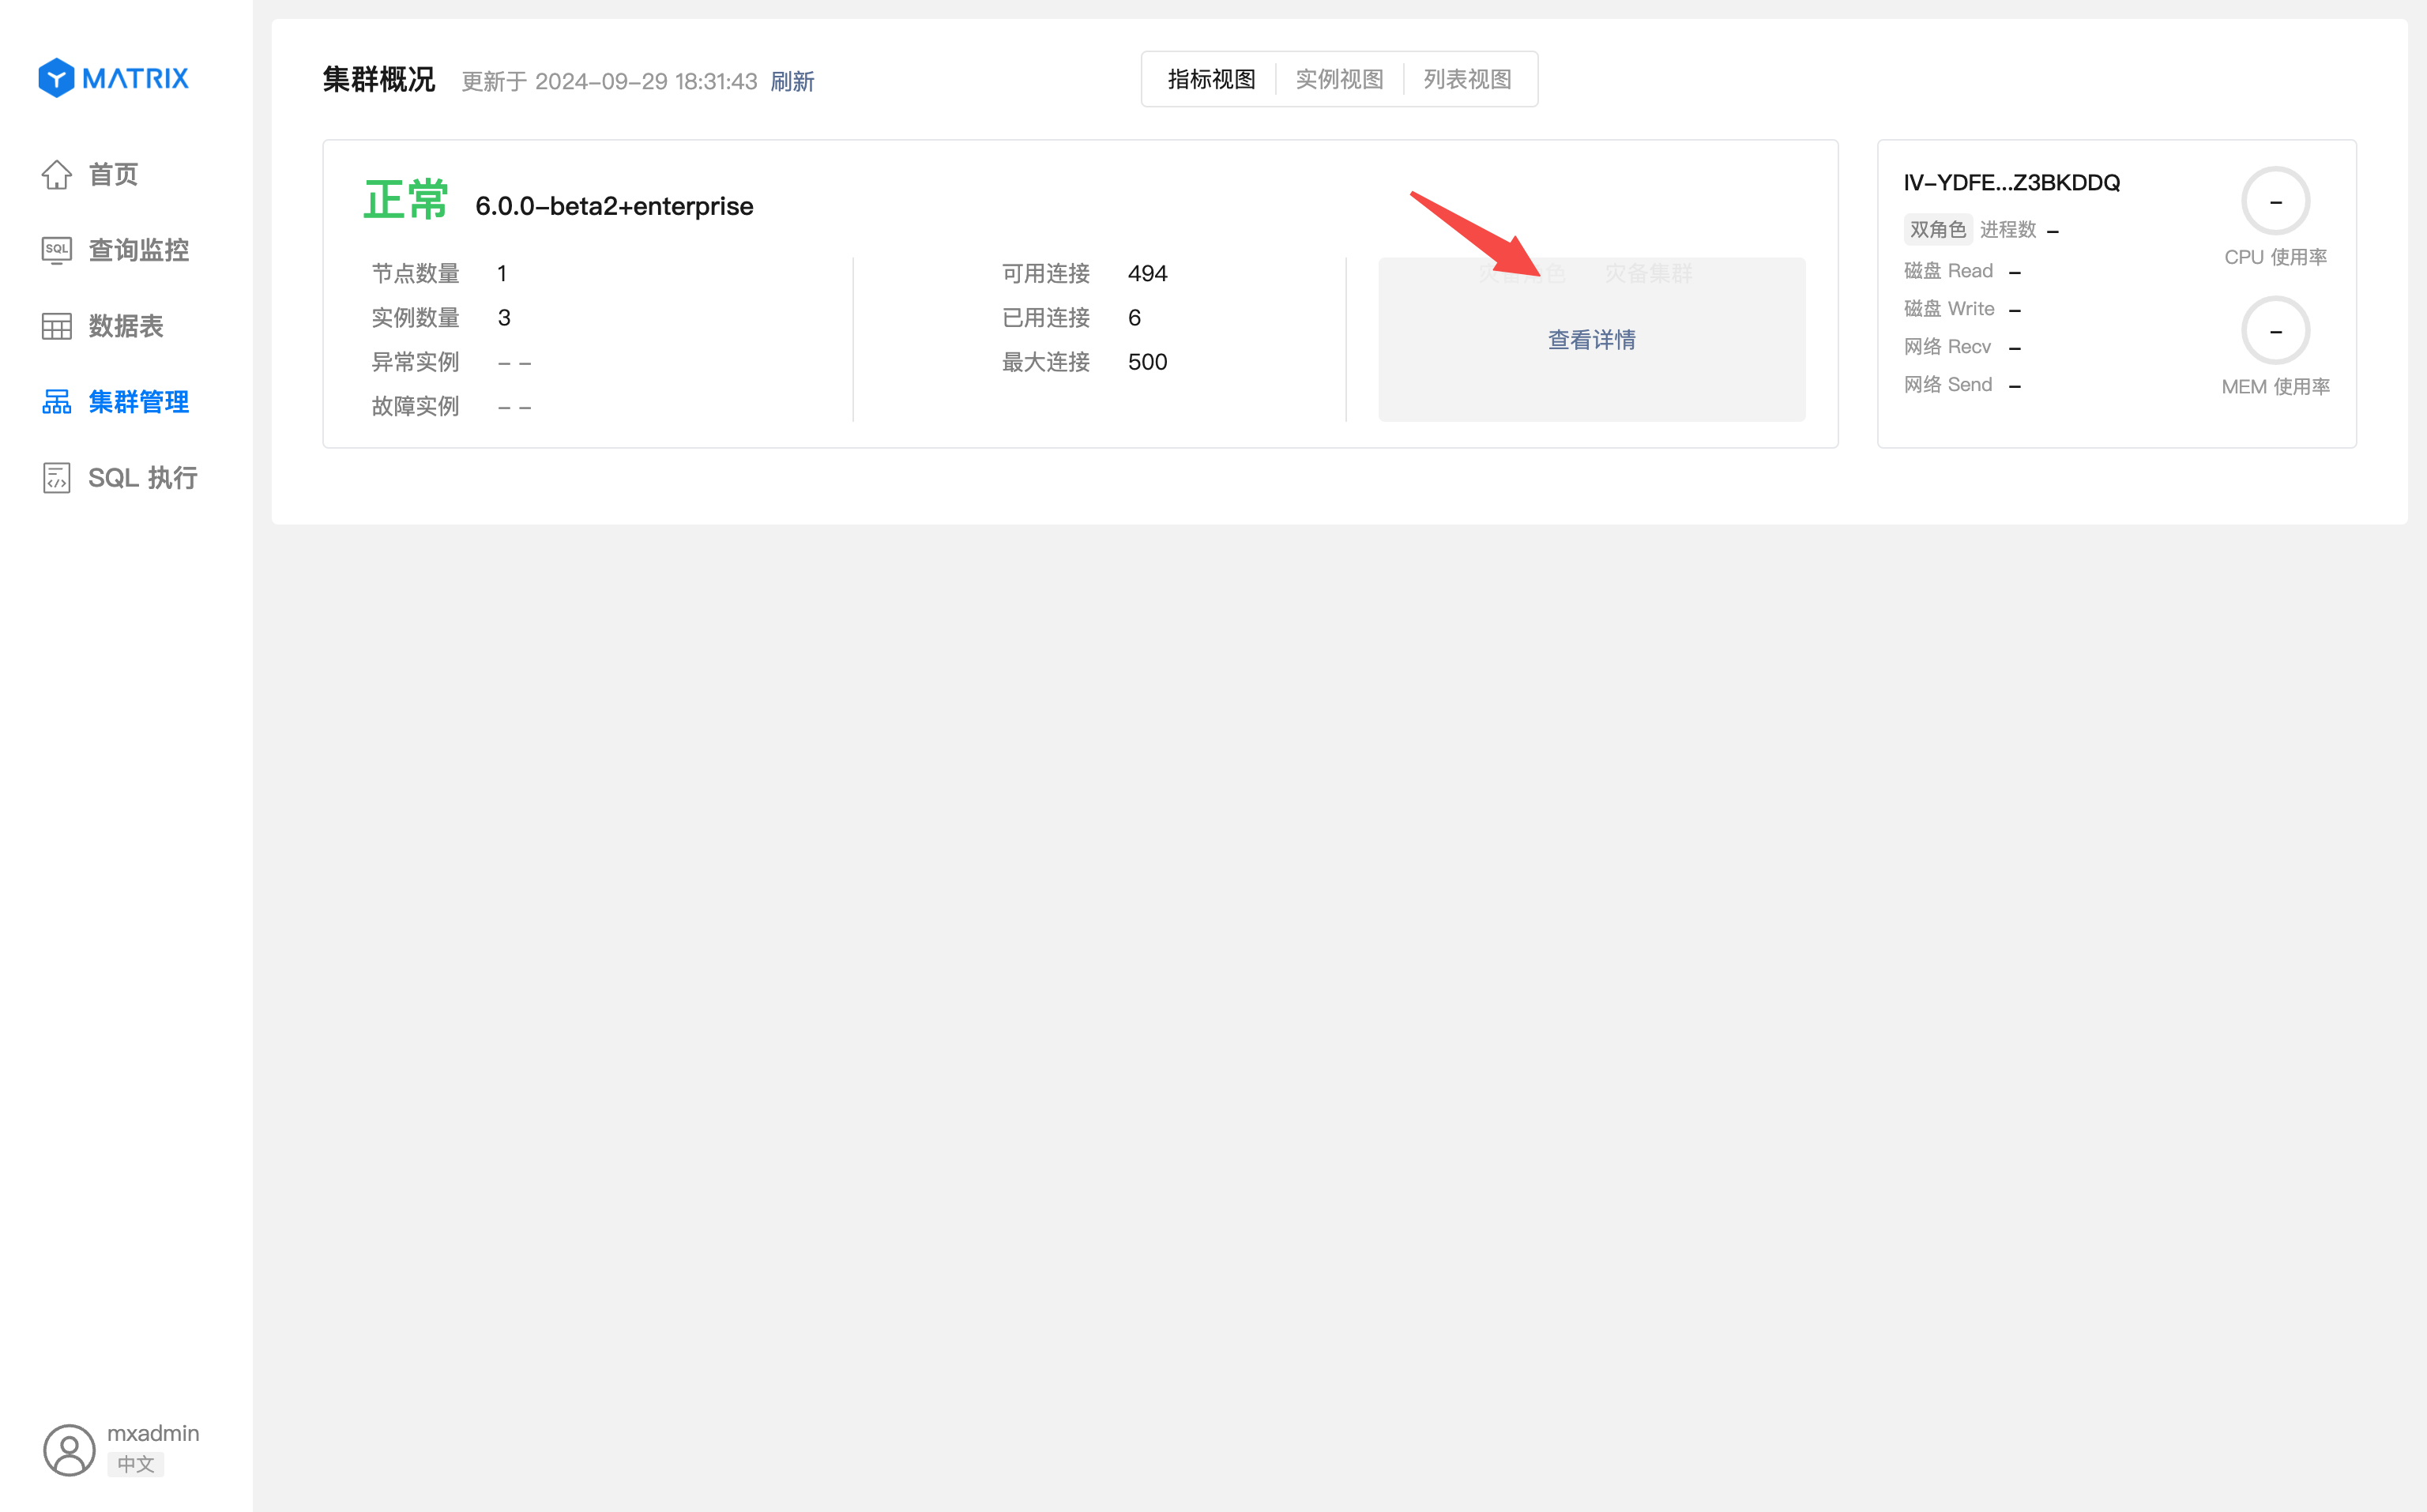
Place the mouse on the disaster recovery information bar and the View Details button will be displayed.
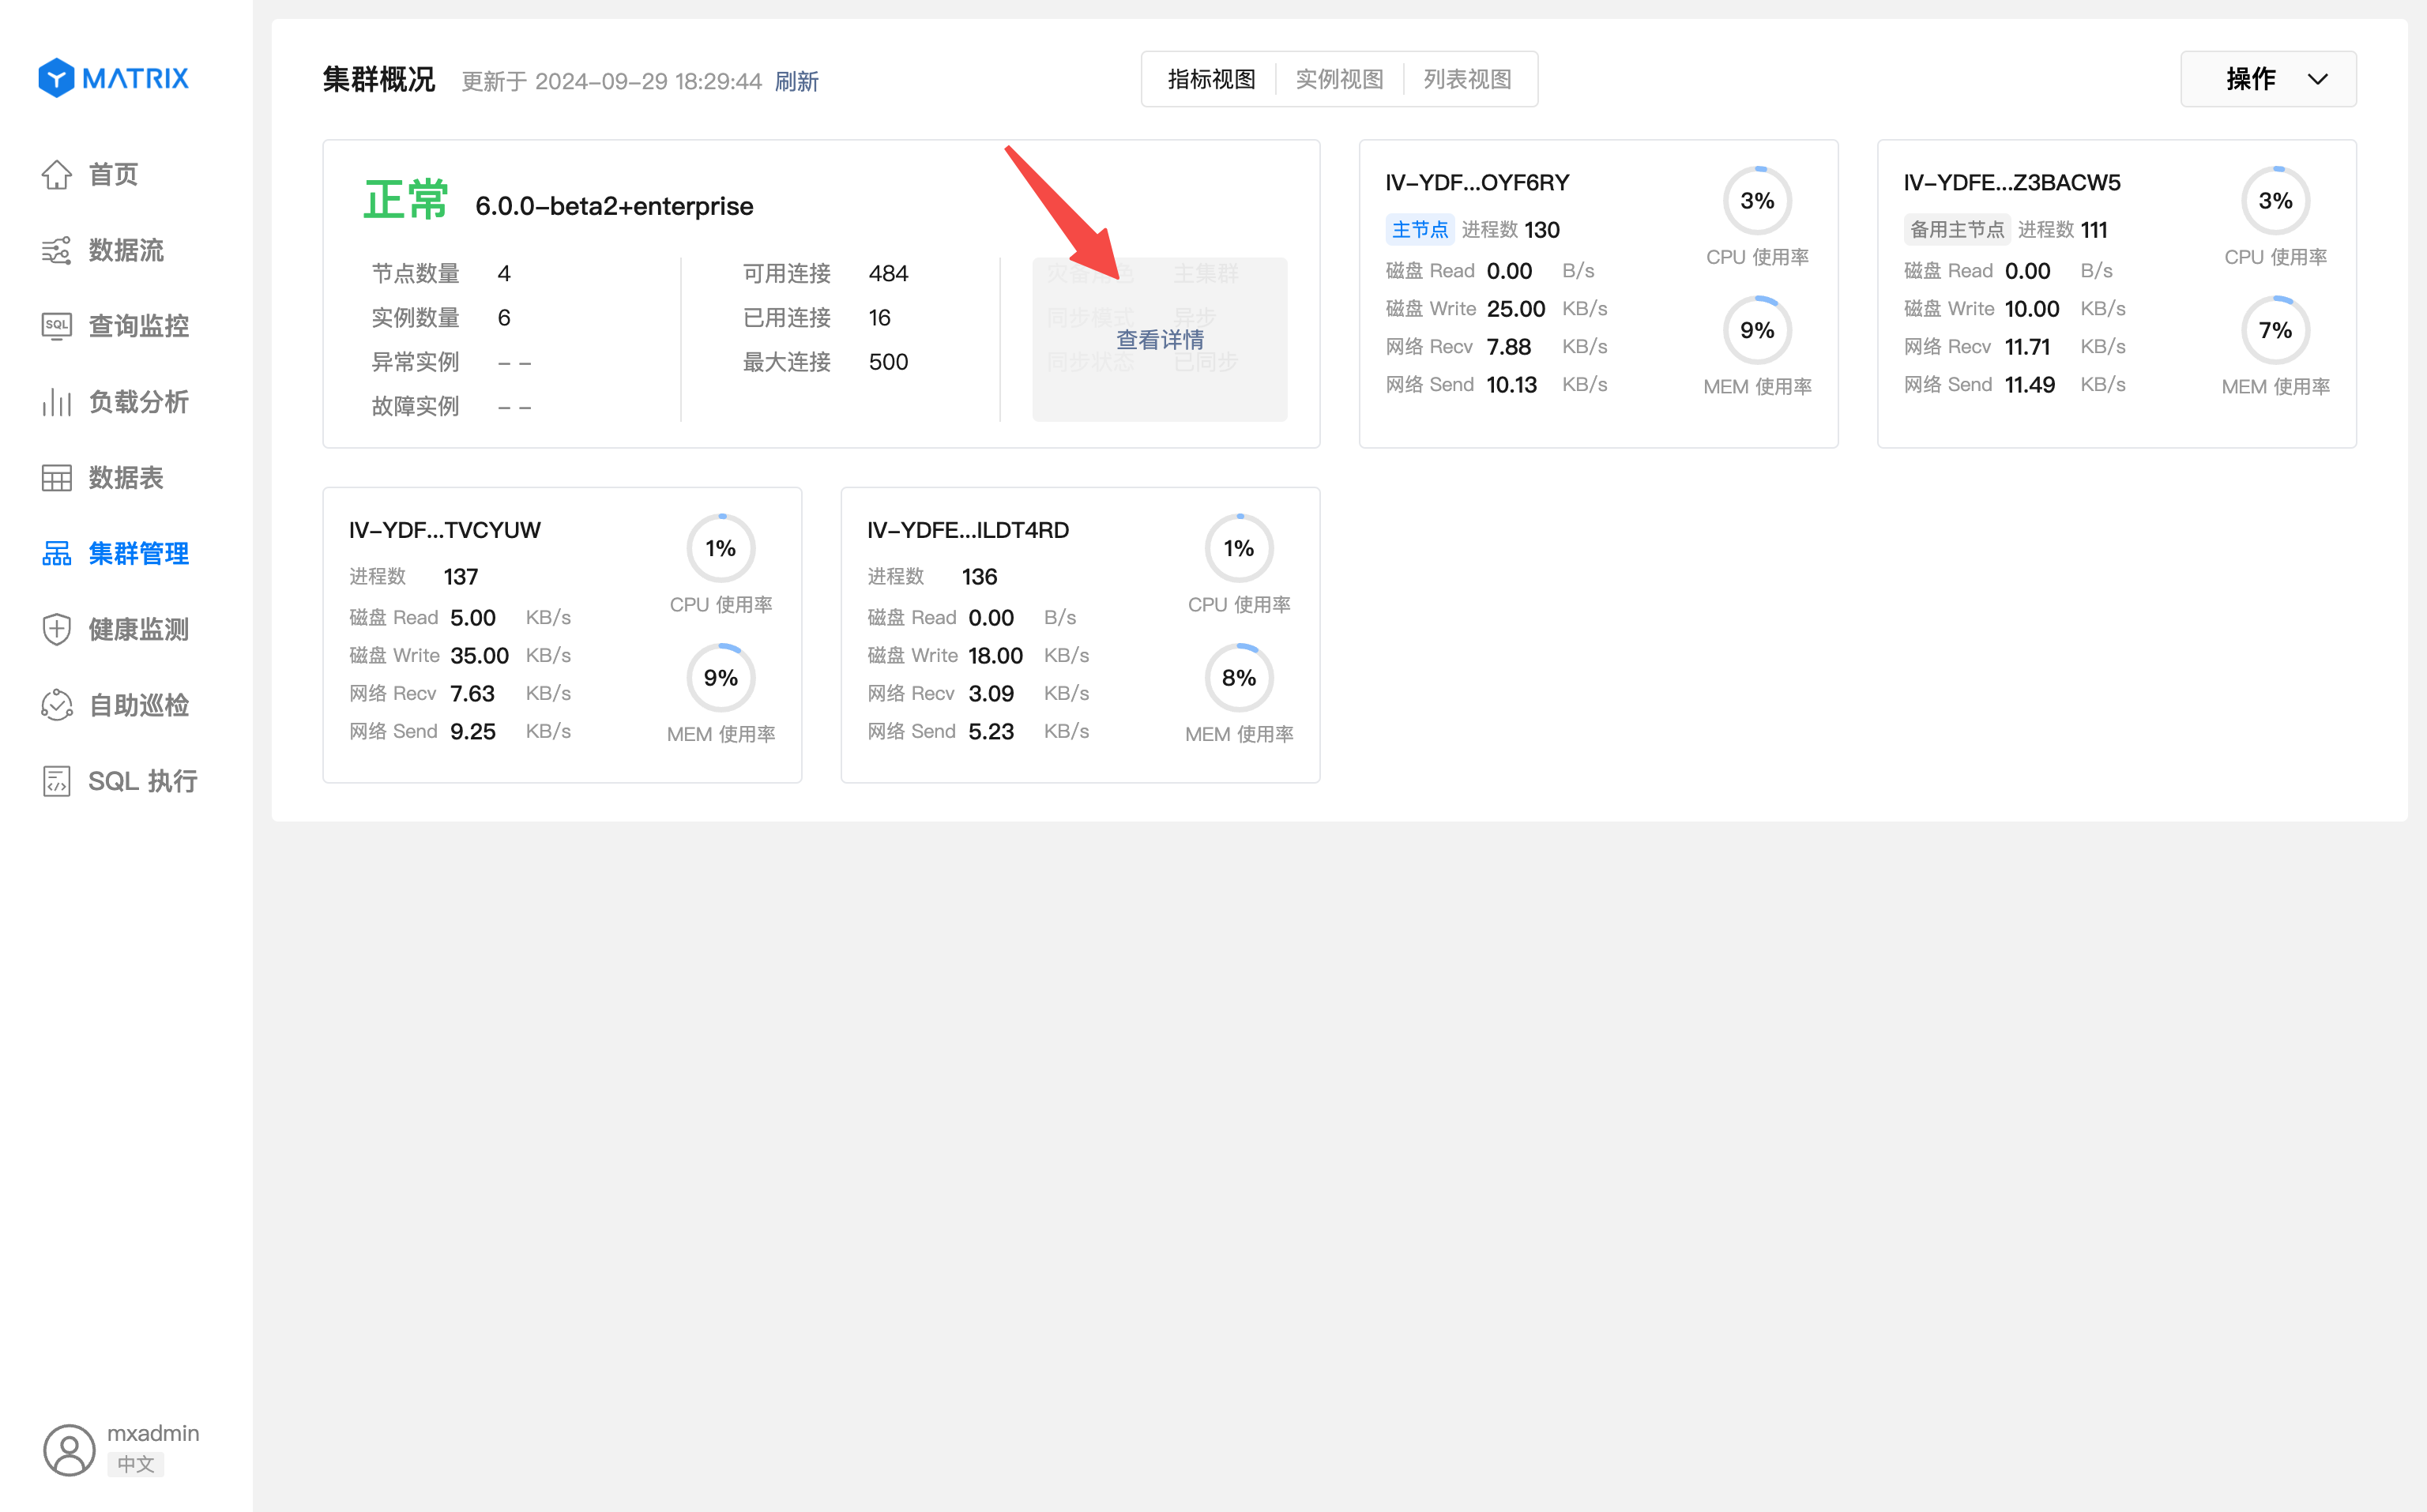
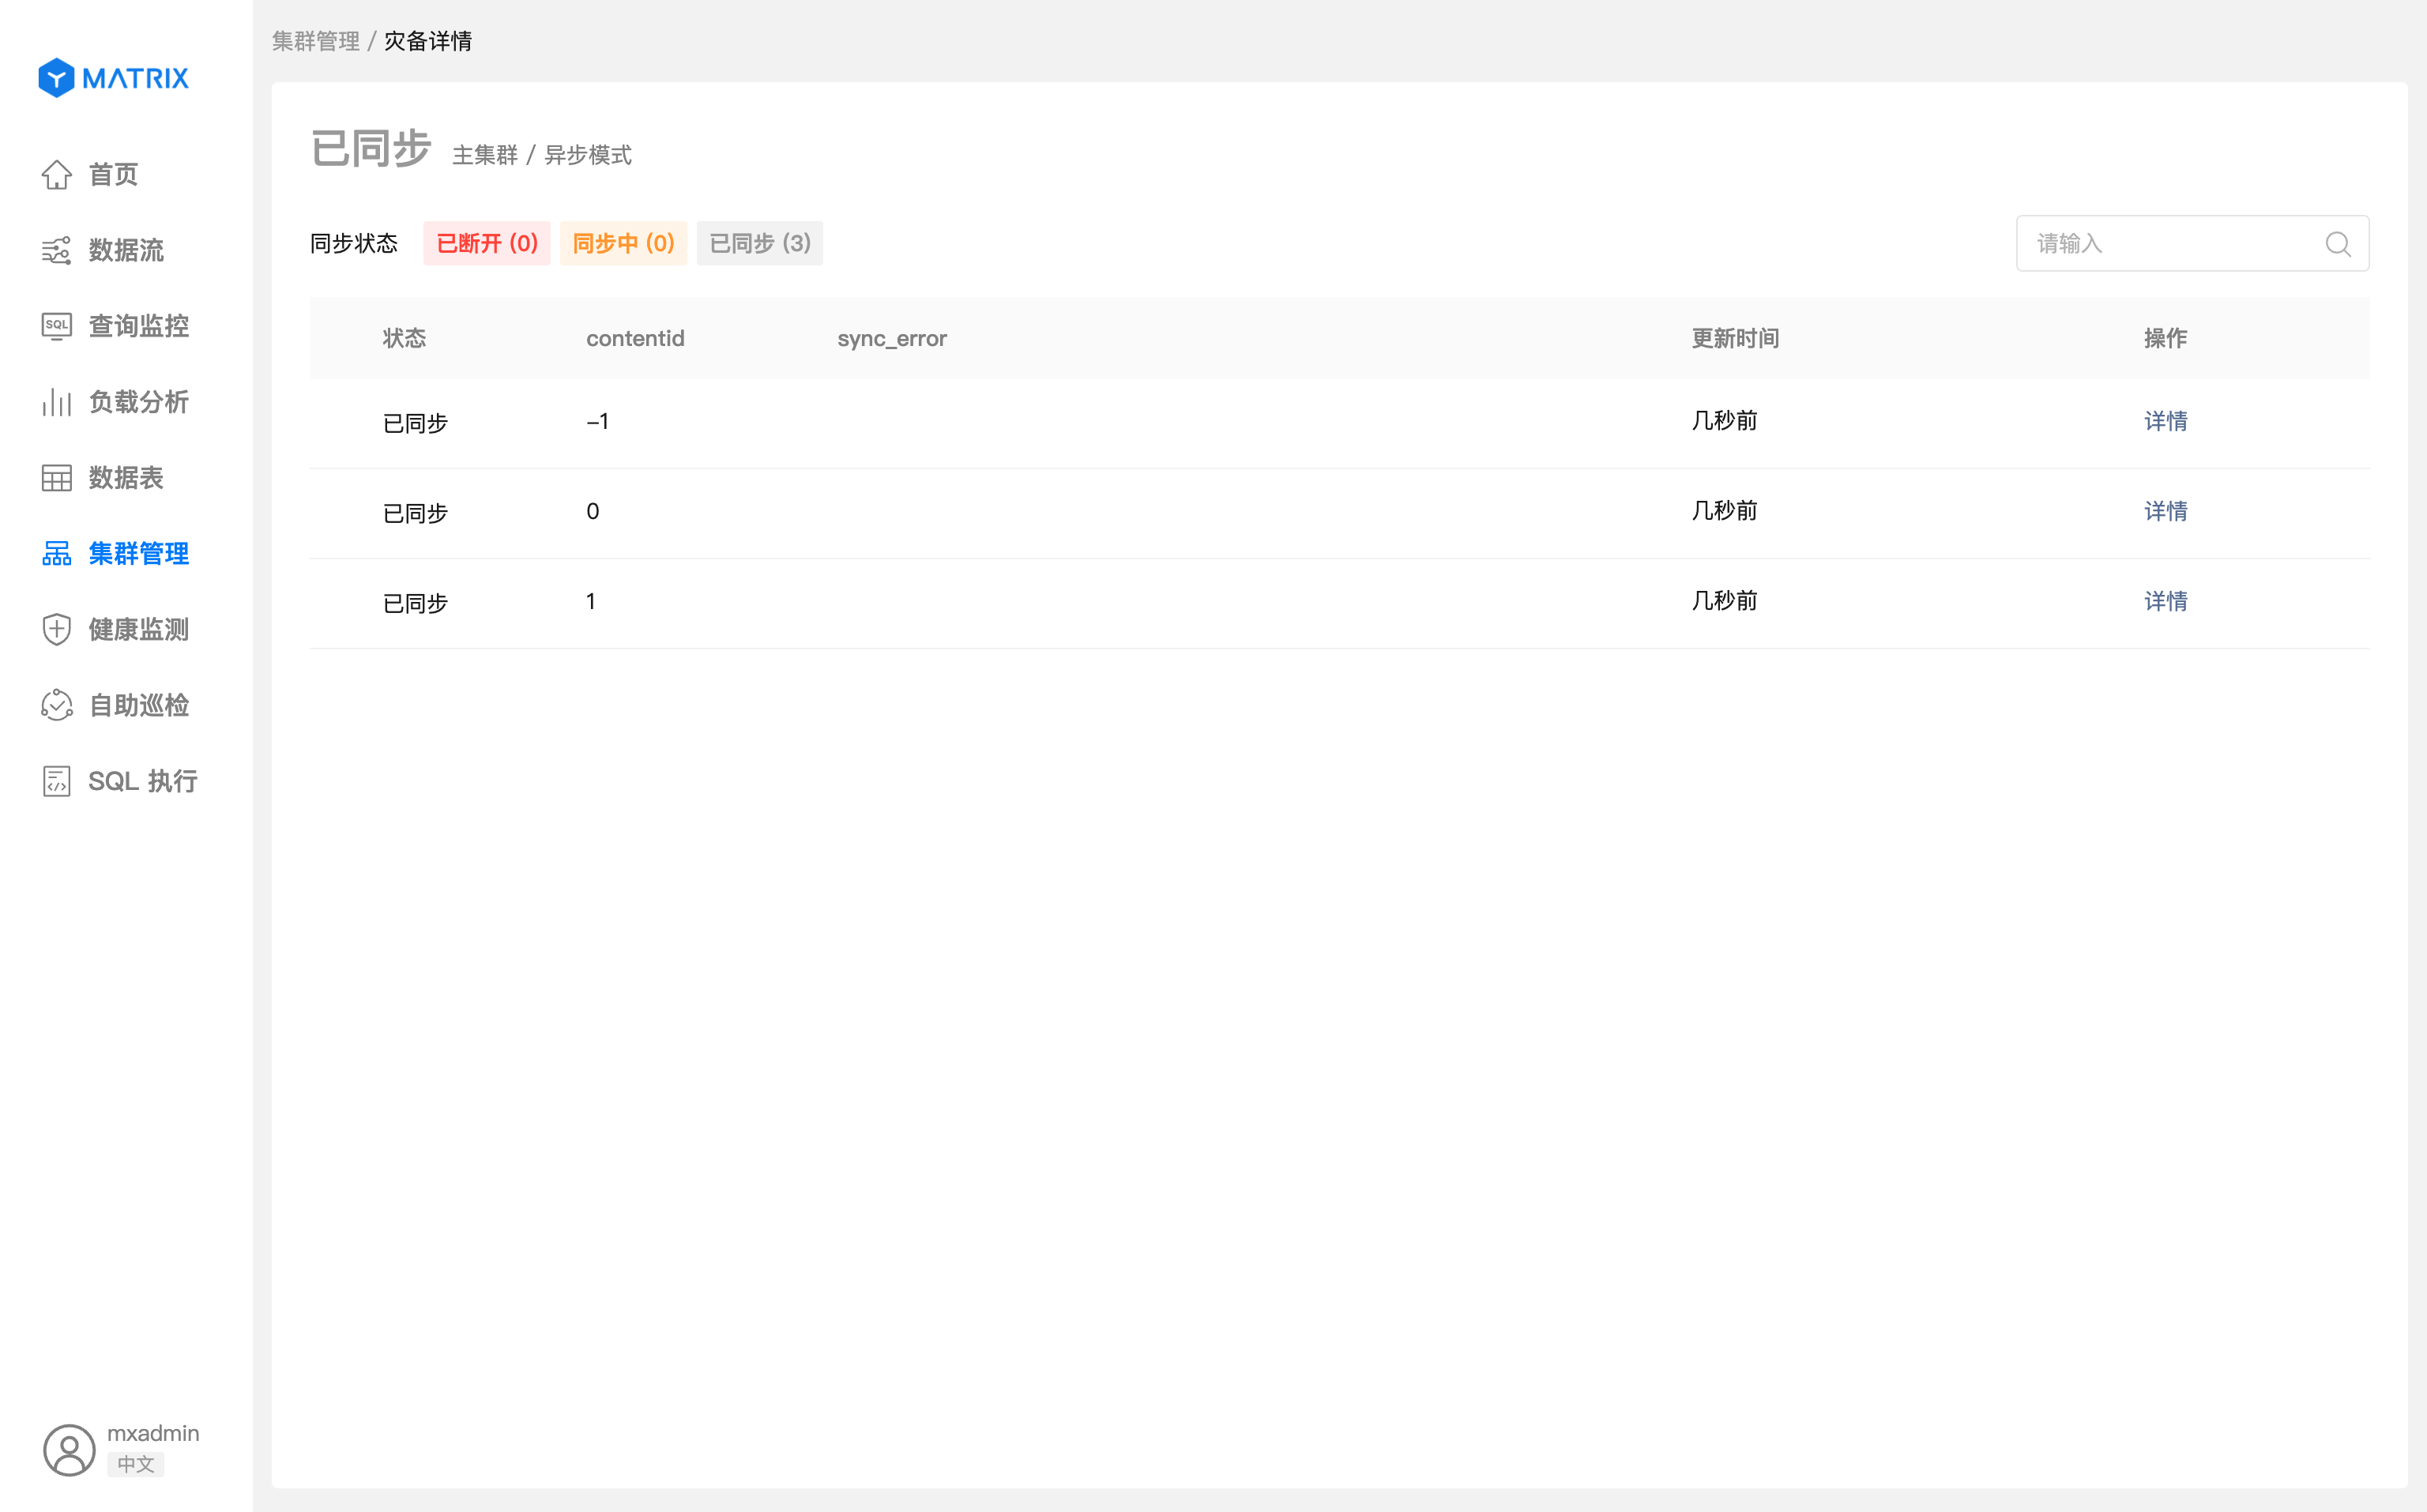
Click the View Details button to enter the synchronous copy stream list page.
Each row of data in the list page represents a synchronous replication stream.
Disconnected, Synchronized, and Synchronized.contentid: shard ID corresponding to the synchronous replication stream.sync_error: Displays error message for synchronous replication streams.Fuzzy searches for contentid and sync_error can be performed through the search box.
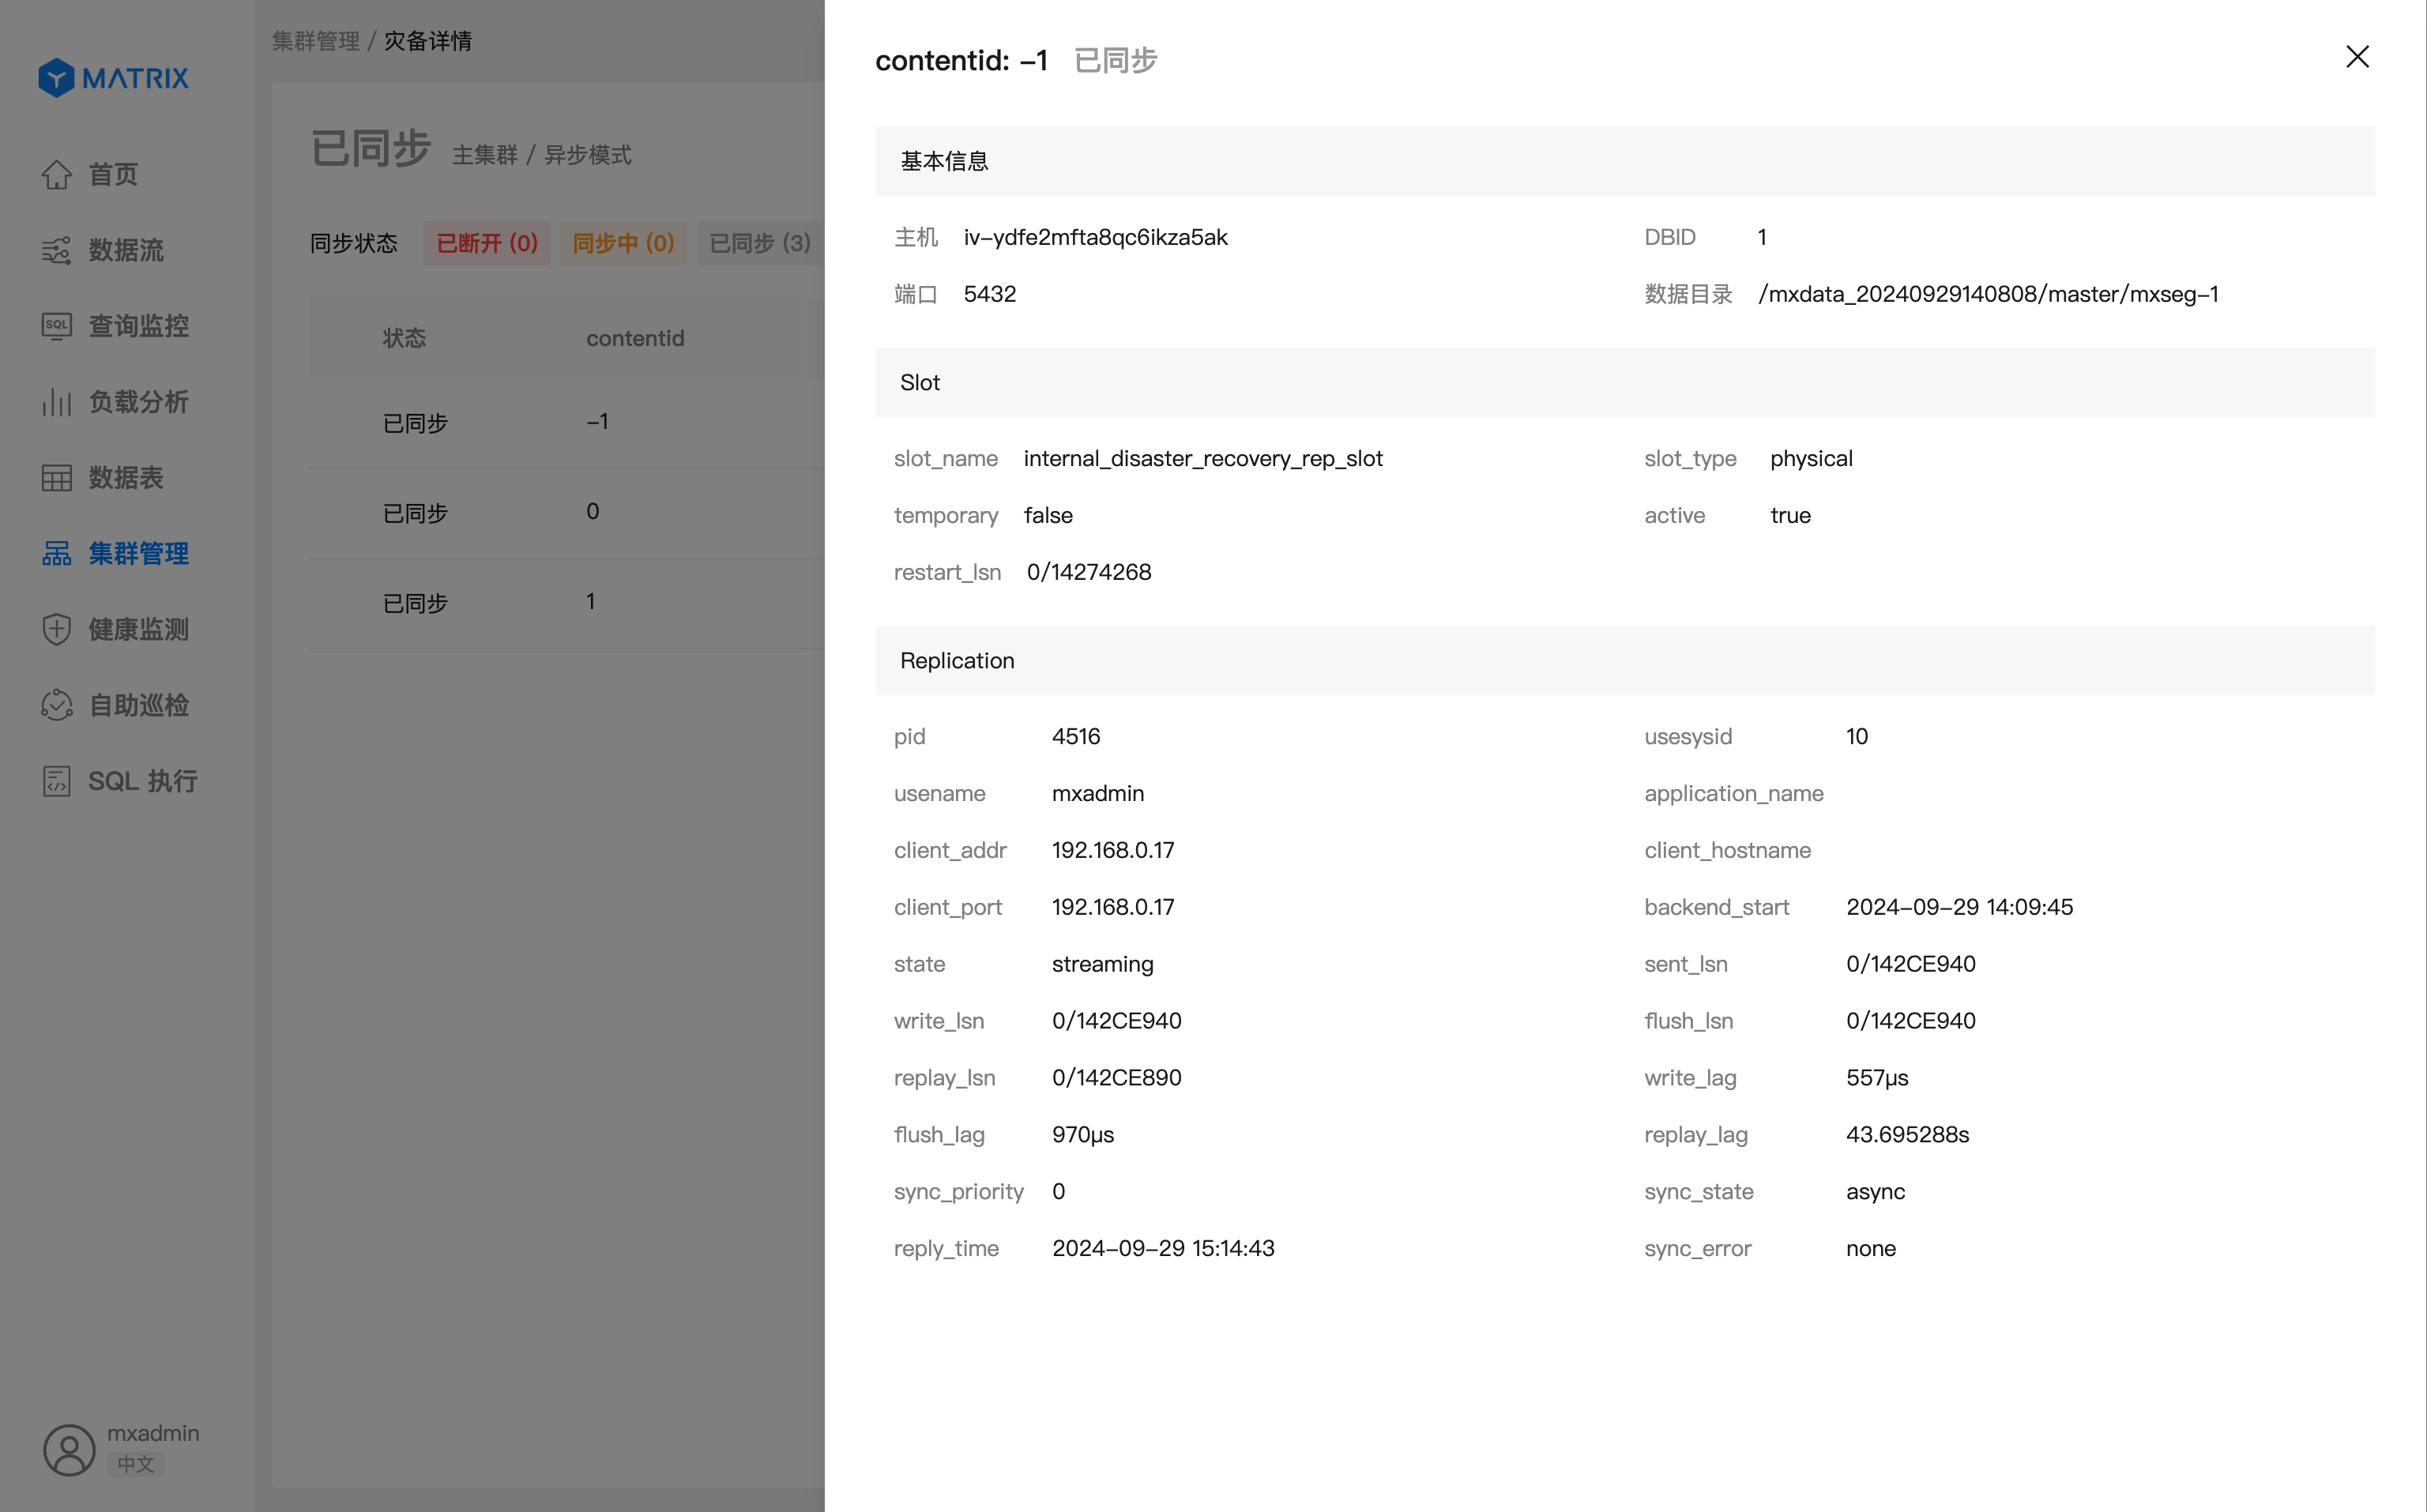
Details button on each row to view the information of the synchronous replication stream, including basic information, Slot information and Replication information.Basic information: The basic information of the segment corresponding to the synchronous replication stream.
Slot information: Corresponding to the fields in the pg_catalog.gp_replication_slots table, displaying field information related to physical replication of Slot.
Replication information: corresponding to the field information in the pg_catalog.gp_stat_replication table.
Place the mouse on the disaster recovery information bar and the View Details button will be displayed.
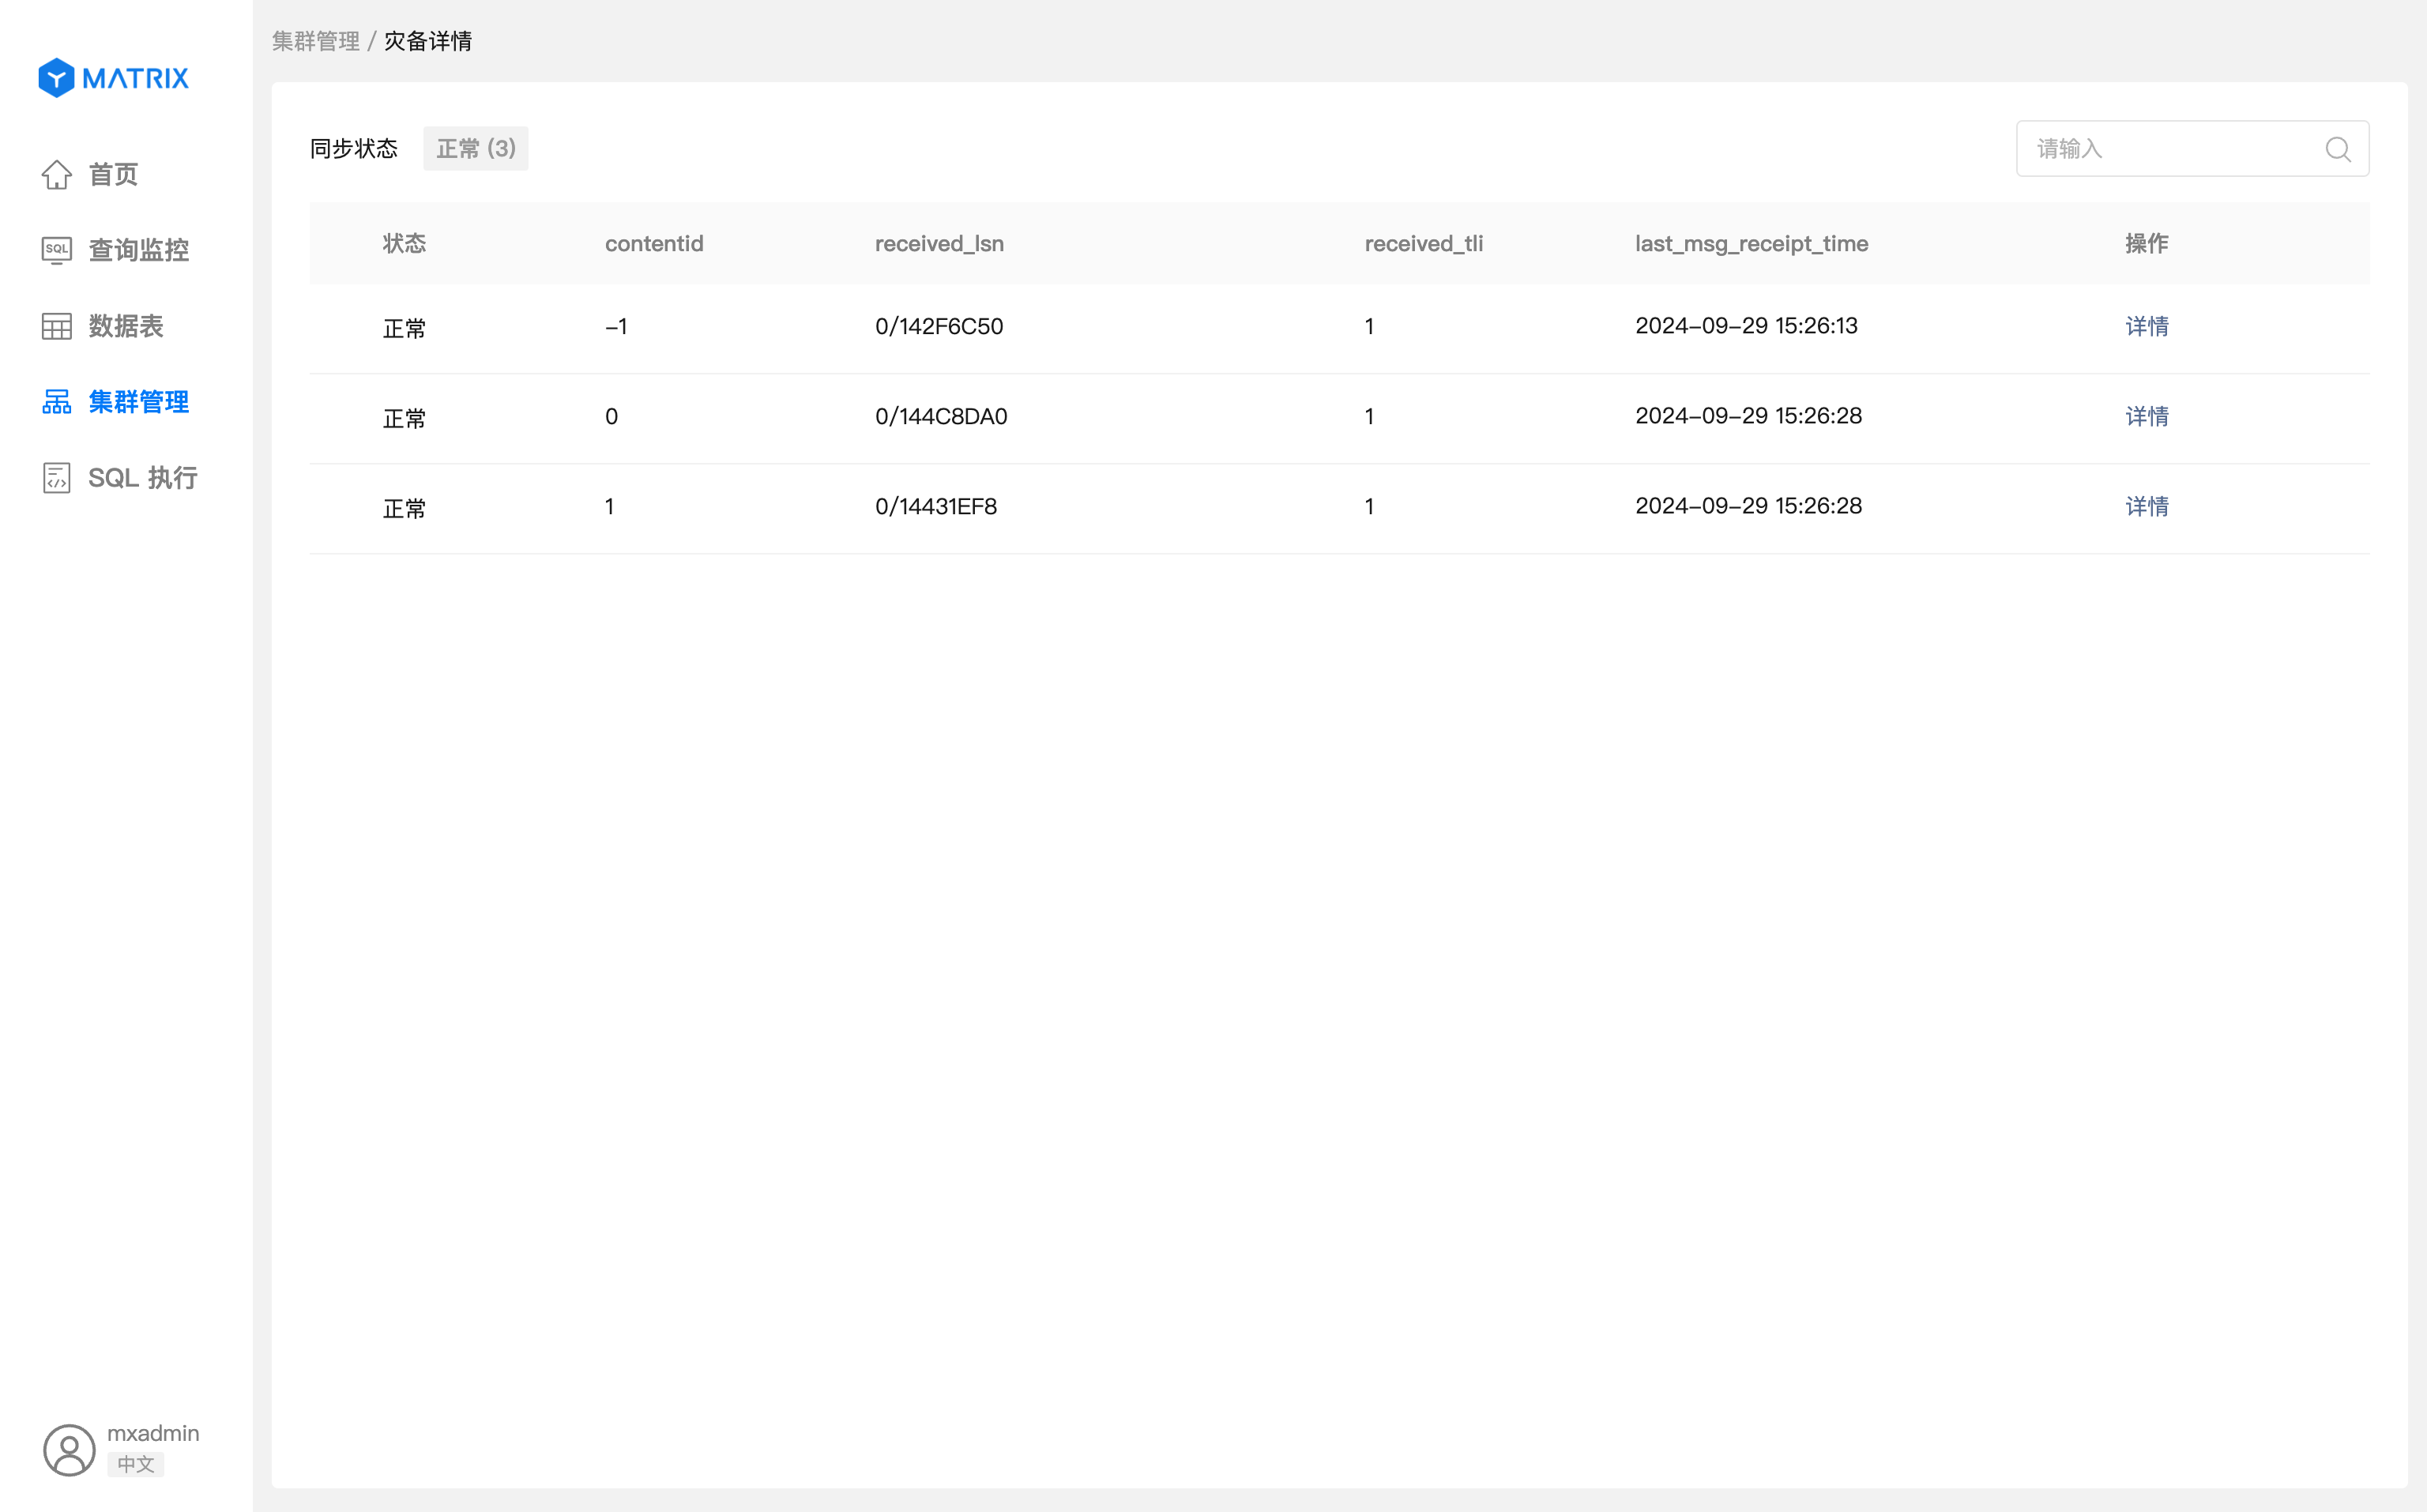
Click View Details to enter the backup cluster WAL Receive Stream List page.
Each row of data in the list page represents a WAL receive stream.
contentid: Indicates the shard ID corresponding to the WAL receive stream.received_lsn: The progress of the currently received WAL log stream, indicating the latest received log location.received_tli: The timeline version number of the last received WAL log belongs to.last_msg_receipt_time: Receive time.Fuzzy searches can be performed on contentid, received_lsn, received_tli and last_msg_receipt_time through the search box.
Details action button of each row to view the detailed information of the WAL receiving stream.Basic information: Display the basic information of the segment corresponding to the WAL receive stream;
gp_stat_wal_receiver information: corresponding to field information in the pg_catalog.gp_stat_wal_receiver table.

The following briefly describes how to use SQL queries to check the status of the disaster recovery feature.
The name of the replication slot used by the disaster recovery function: internal_disaster_recovery_rep_slot.
Query the information of the replication slot used by the disaster recovery function
Note: Users with corresponding permissions in the main cluster must conduct query.
SELECT *
FROM pg_catalog.gp_replication_slots
WHERE slot_name = 'internal_disaster_recovery_rep_slot'
ORDER BY gp_segment_id
Query the replication status of the disaster recovery function
Note: Users with corresponding permissions in the main cluster must conduct query.
SELECT *
FROM
pg_catalog.gp_replication_slots s
LEFT JOIN
pg_catalog.gp_stat_replication r
ON
s.gp_segment_id = r.gp_segment_id AND s.active_pid = r.pid
WHERE s.slot_name = 'internal_disaster_recovery_rep_slot'
ORDER BY s.gp_segment_id
Backup cluster
system catalog
The name of the replication slot used by the disaster recovery function: internal_disaster_recovery_rep_slot.
Query the status of the disaster recovery function walreceiver
Note: Users with corresponding permissions in the main cluster must conduct query.
SELECT *
FROM pg_catalog.gp_stat_wal_receiver
WHERE slot_name = 'internal_disaster_recovery_rep_slot'
ORDER BY gp_segment_id