Quick Start
Simulate Time Series Scenarios
Standard Cluster Deployment
Data Modeling
Connecting to The database
Data Writing
Data Migration
Data Query
Scene Application Examples
Federal Query
Maintenance and Monitoring
Global Maintenance
Partition Maintenance
Backup and Restore
Cluster Expansion
Monitoring
Performance Tuning
Troubleshooting
Reference Guide
Tool Guide
Data Type
Storage Engine
Execution Engine
Configuration Parameters
SQL Reference
FAQ
This document introduces the load analysis function of YMatrix graphical interface.
In the daily work of database operation and maintenance, querying execution history information is a crucial resource. Therefore, we can deeply understand the operation status of the database system and obtain valuable information from it, helping us better solve problems such as performance optimization, troubleshooting, resource management, capacity planning and query optimization, so that the database system can run stably and efficiently.

Click Overview, select a database, and you can drill down to the type of SQL executed by the corresponding database. The more times a certain type of SQL is executed, the larger the area. The same applies to the Execution Time tree diagram.
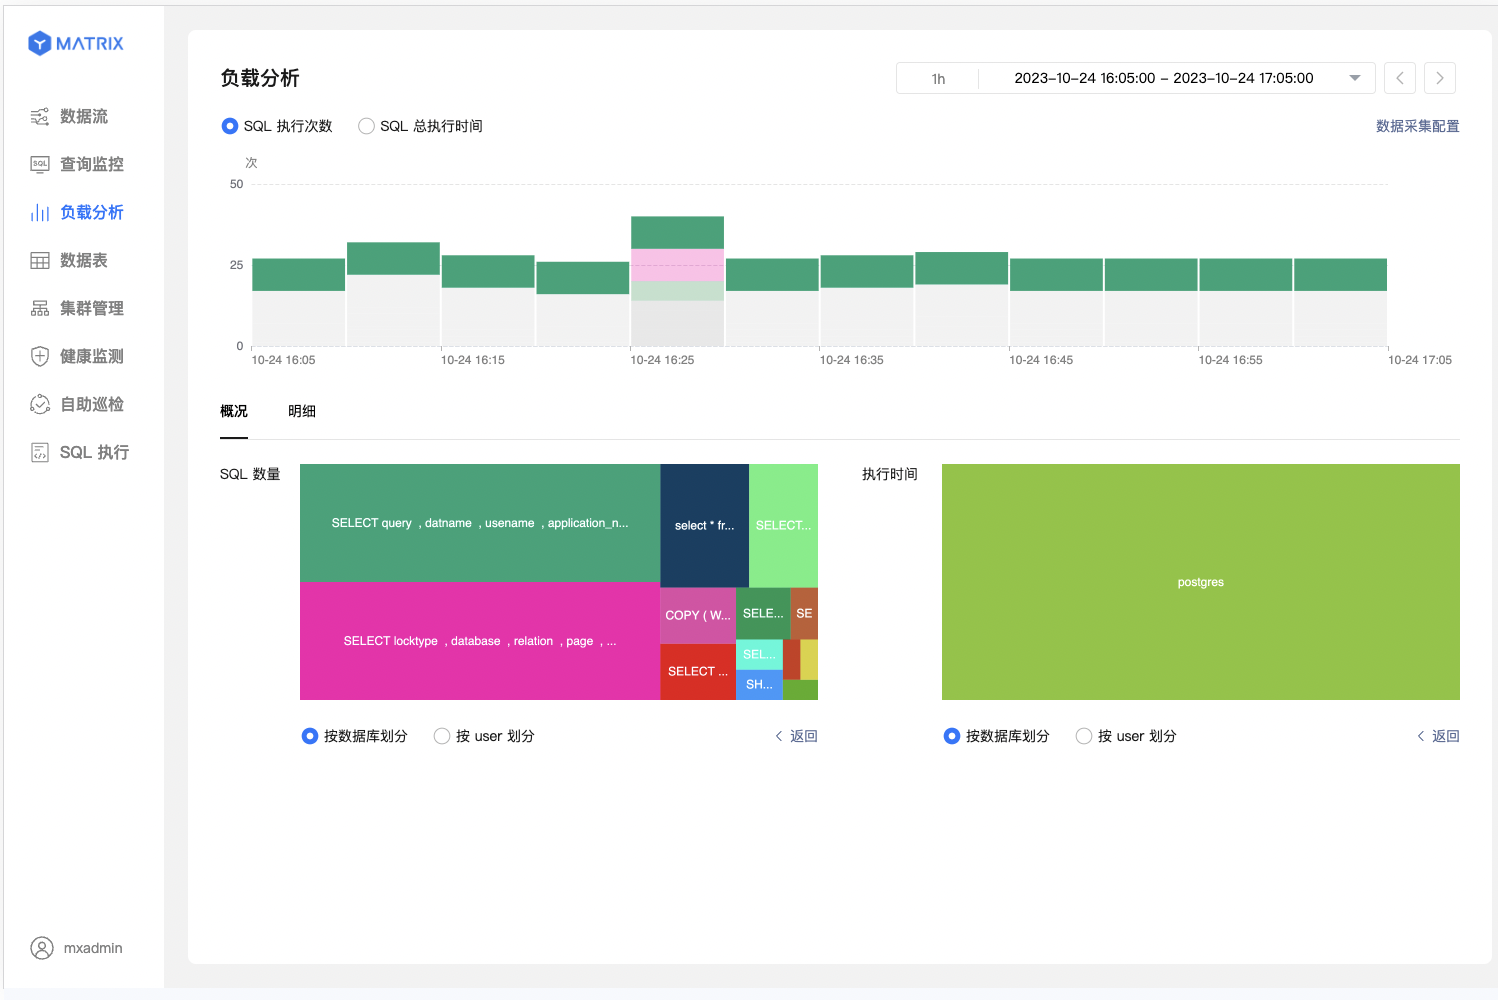
You can view the query history from the two angles of SQL execution times and SQL total execution time. Select a column to see how many times SQL has been executed in the corresponding time period. Each color in the column represents a type of SQL. Each type of SQL is arranged from large to small according to the number of executions, and the three types with the largest number of executions are displayed by default.

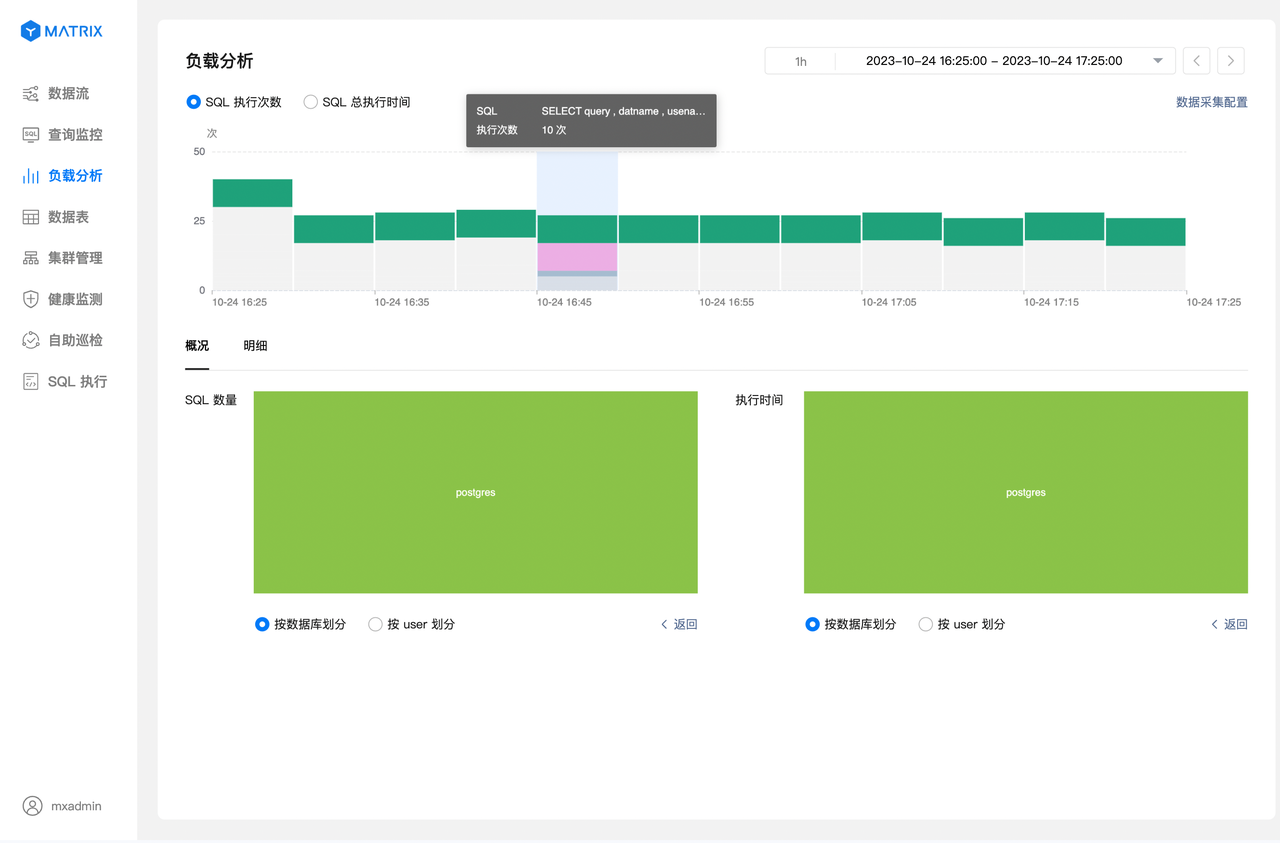
The cursor floats on a certain type of SQL, which can display the number of executions of this type of SQL. At the same time, similar SQLs in other periods will also be highlighted to help position optimization or problem SQL.
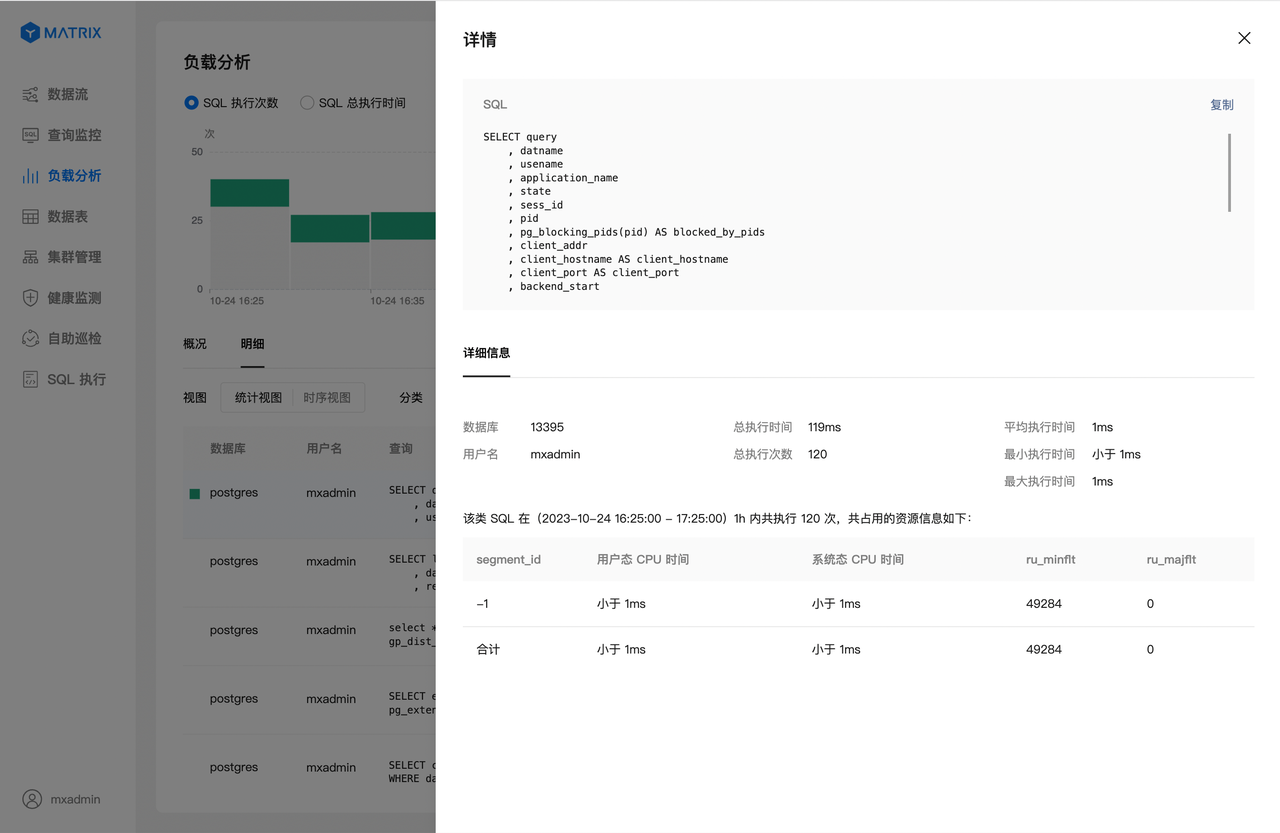
Select a certain type of SQL and click Detail. The corresponding SQL will be located in the table. The details table supports sorting by total execution times, total execution time, etc.
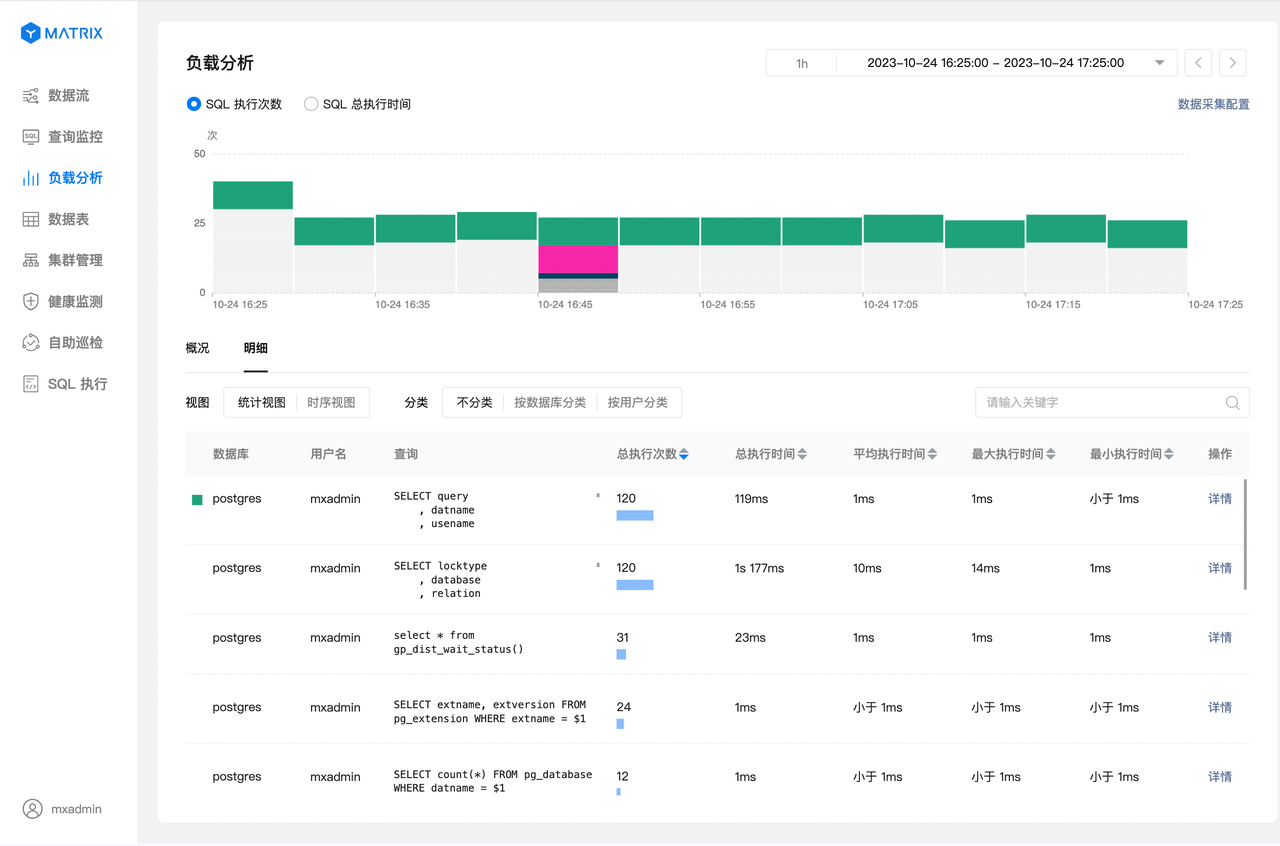
Click the corresponding SQL details to view more relevant information to help further analysis.
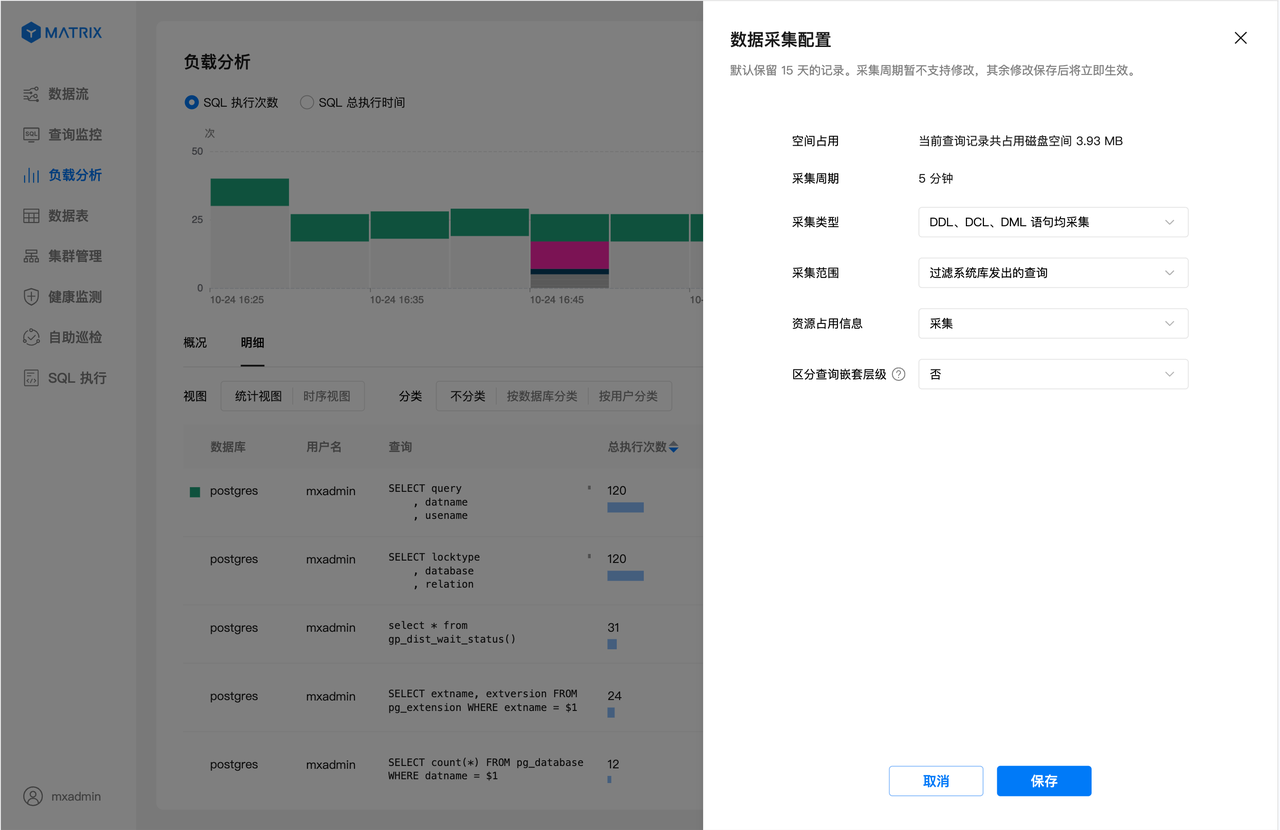
Supports modifying the relevant parameter settings for data collection.