Under the new YMatrix 5 architecture, etcd is introduced to store the configuration and status information of the cluster. etcd is very critical. If an exception occurs, it will cause the database to be instable or even crash. This article introduces the methods of installing and deploying etcd monitoring. It is recommended that clusters in production environments install this monitoring because the normal etcd status is the prerequisite for the healthy operation of the database.
Please go to Prometheus official website to download the following content:
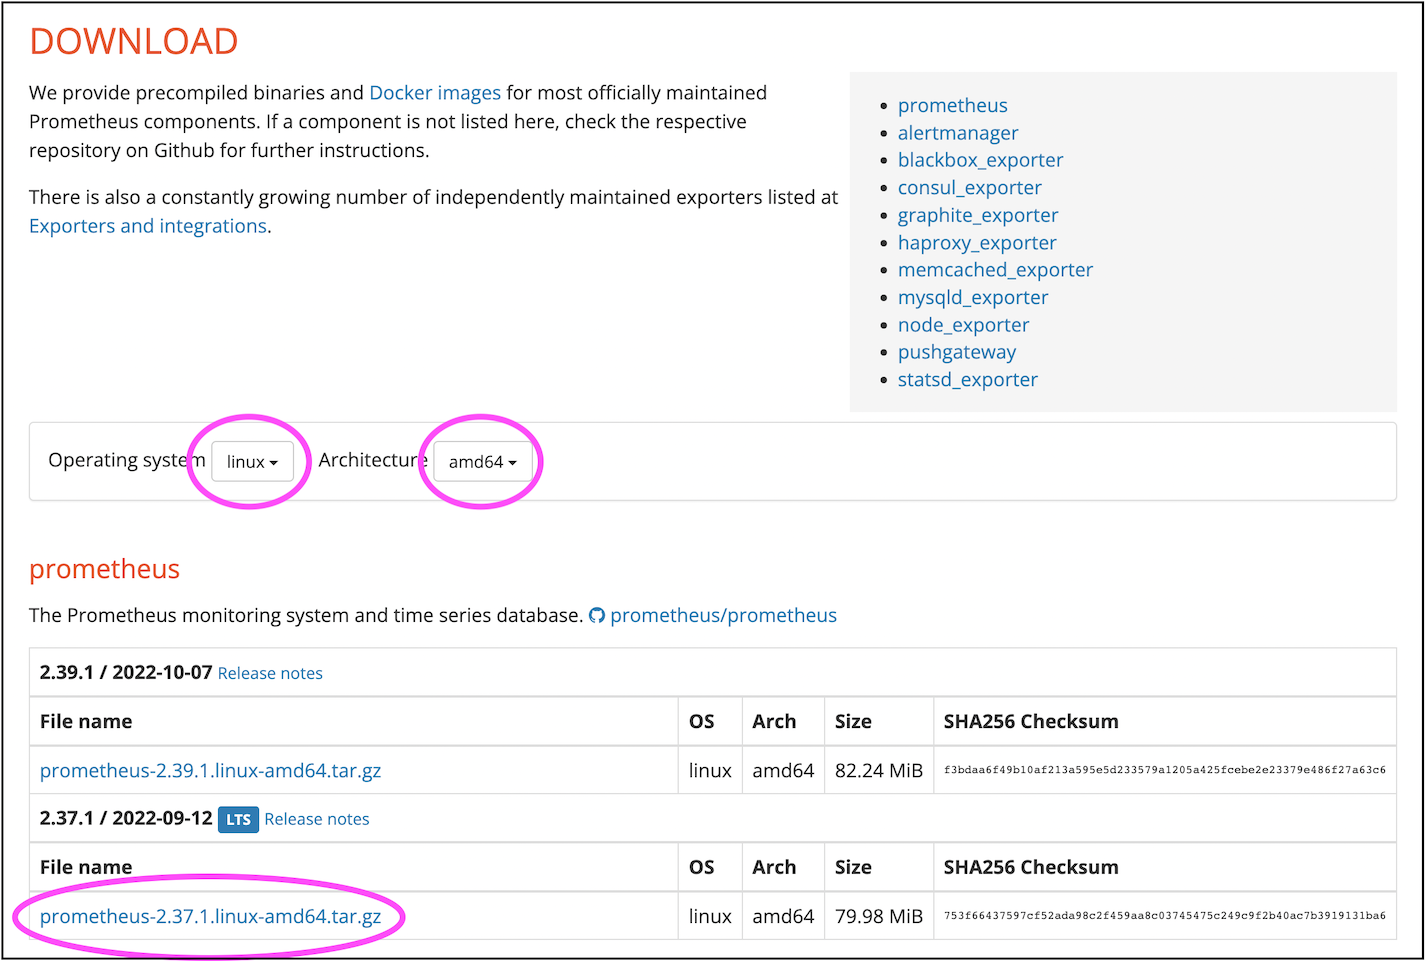
Upload the downloaded tar package to the Linux server. If conditions permit, it is recommended to use a separate server to run Prometheus. If the server is limited, it can also be temporarily placed on the master standby node or the master node host.
$ tar xvfz prometheus-*.tar.gzYou can move the unzipped prometheus-* directory to /usr/local/.
Edit the configuration file.
$ cd prometheus-*
sudo vi prometheus.yml
At the end of the file, add the following content:
  - job_name: "etcd"
    static_configs:
      - targets: ["172.31.33.128:4679", "172.31.45.253:4679", "172.31.35.134:4679"]
Among them, targets is an array that needs to be replaced with the address of each etcd node in the cluster.
This information can be found in the /etc/matrixdb5/physical_cluster.toml file on the Master host.
$ cat physical_cluster.toml
cluster_id = '79LhQxjuwmXgSWZCjcdigF'
supervisord_grpc_port = 4617
deployer_port = 4627
etcd_endpoints = ['http://10.0.159.1:4679', 'http://10.0.172.185:4679', 'http://10.0.170.90:4679', 'http://10.0.146.2:4679', 'http://10.0.146.195:4679', 'http://10.0.150.110:4679', 'http://10.0.169.149:4679']
Notes!
If you do not have the/etc/matrixdb5/physical_cluster.tomlfile on your host and the etcd process cannot be found, it means that your cluster is not deployed with the new 5.0 architecture and does not involve monitoring etcd.
./prometheus --config.file=prometheus.ymlNotes!
Usually we want Prometheus to run in the background as a system service, which requires it configured as a systemd service.
Please refer to the official document Installing Grafana Software.
Notes!
Grafana 8.2.5 or higher is required.
First log in to the Grafana page, the default address is as follows:
http://<安装节点的IP或者域名>:3000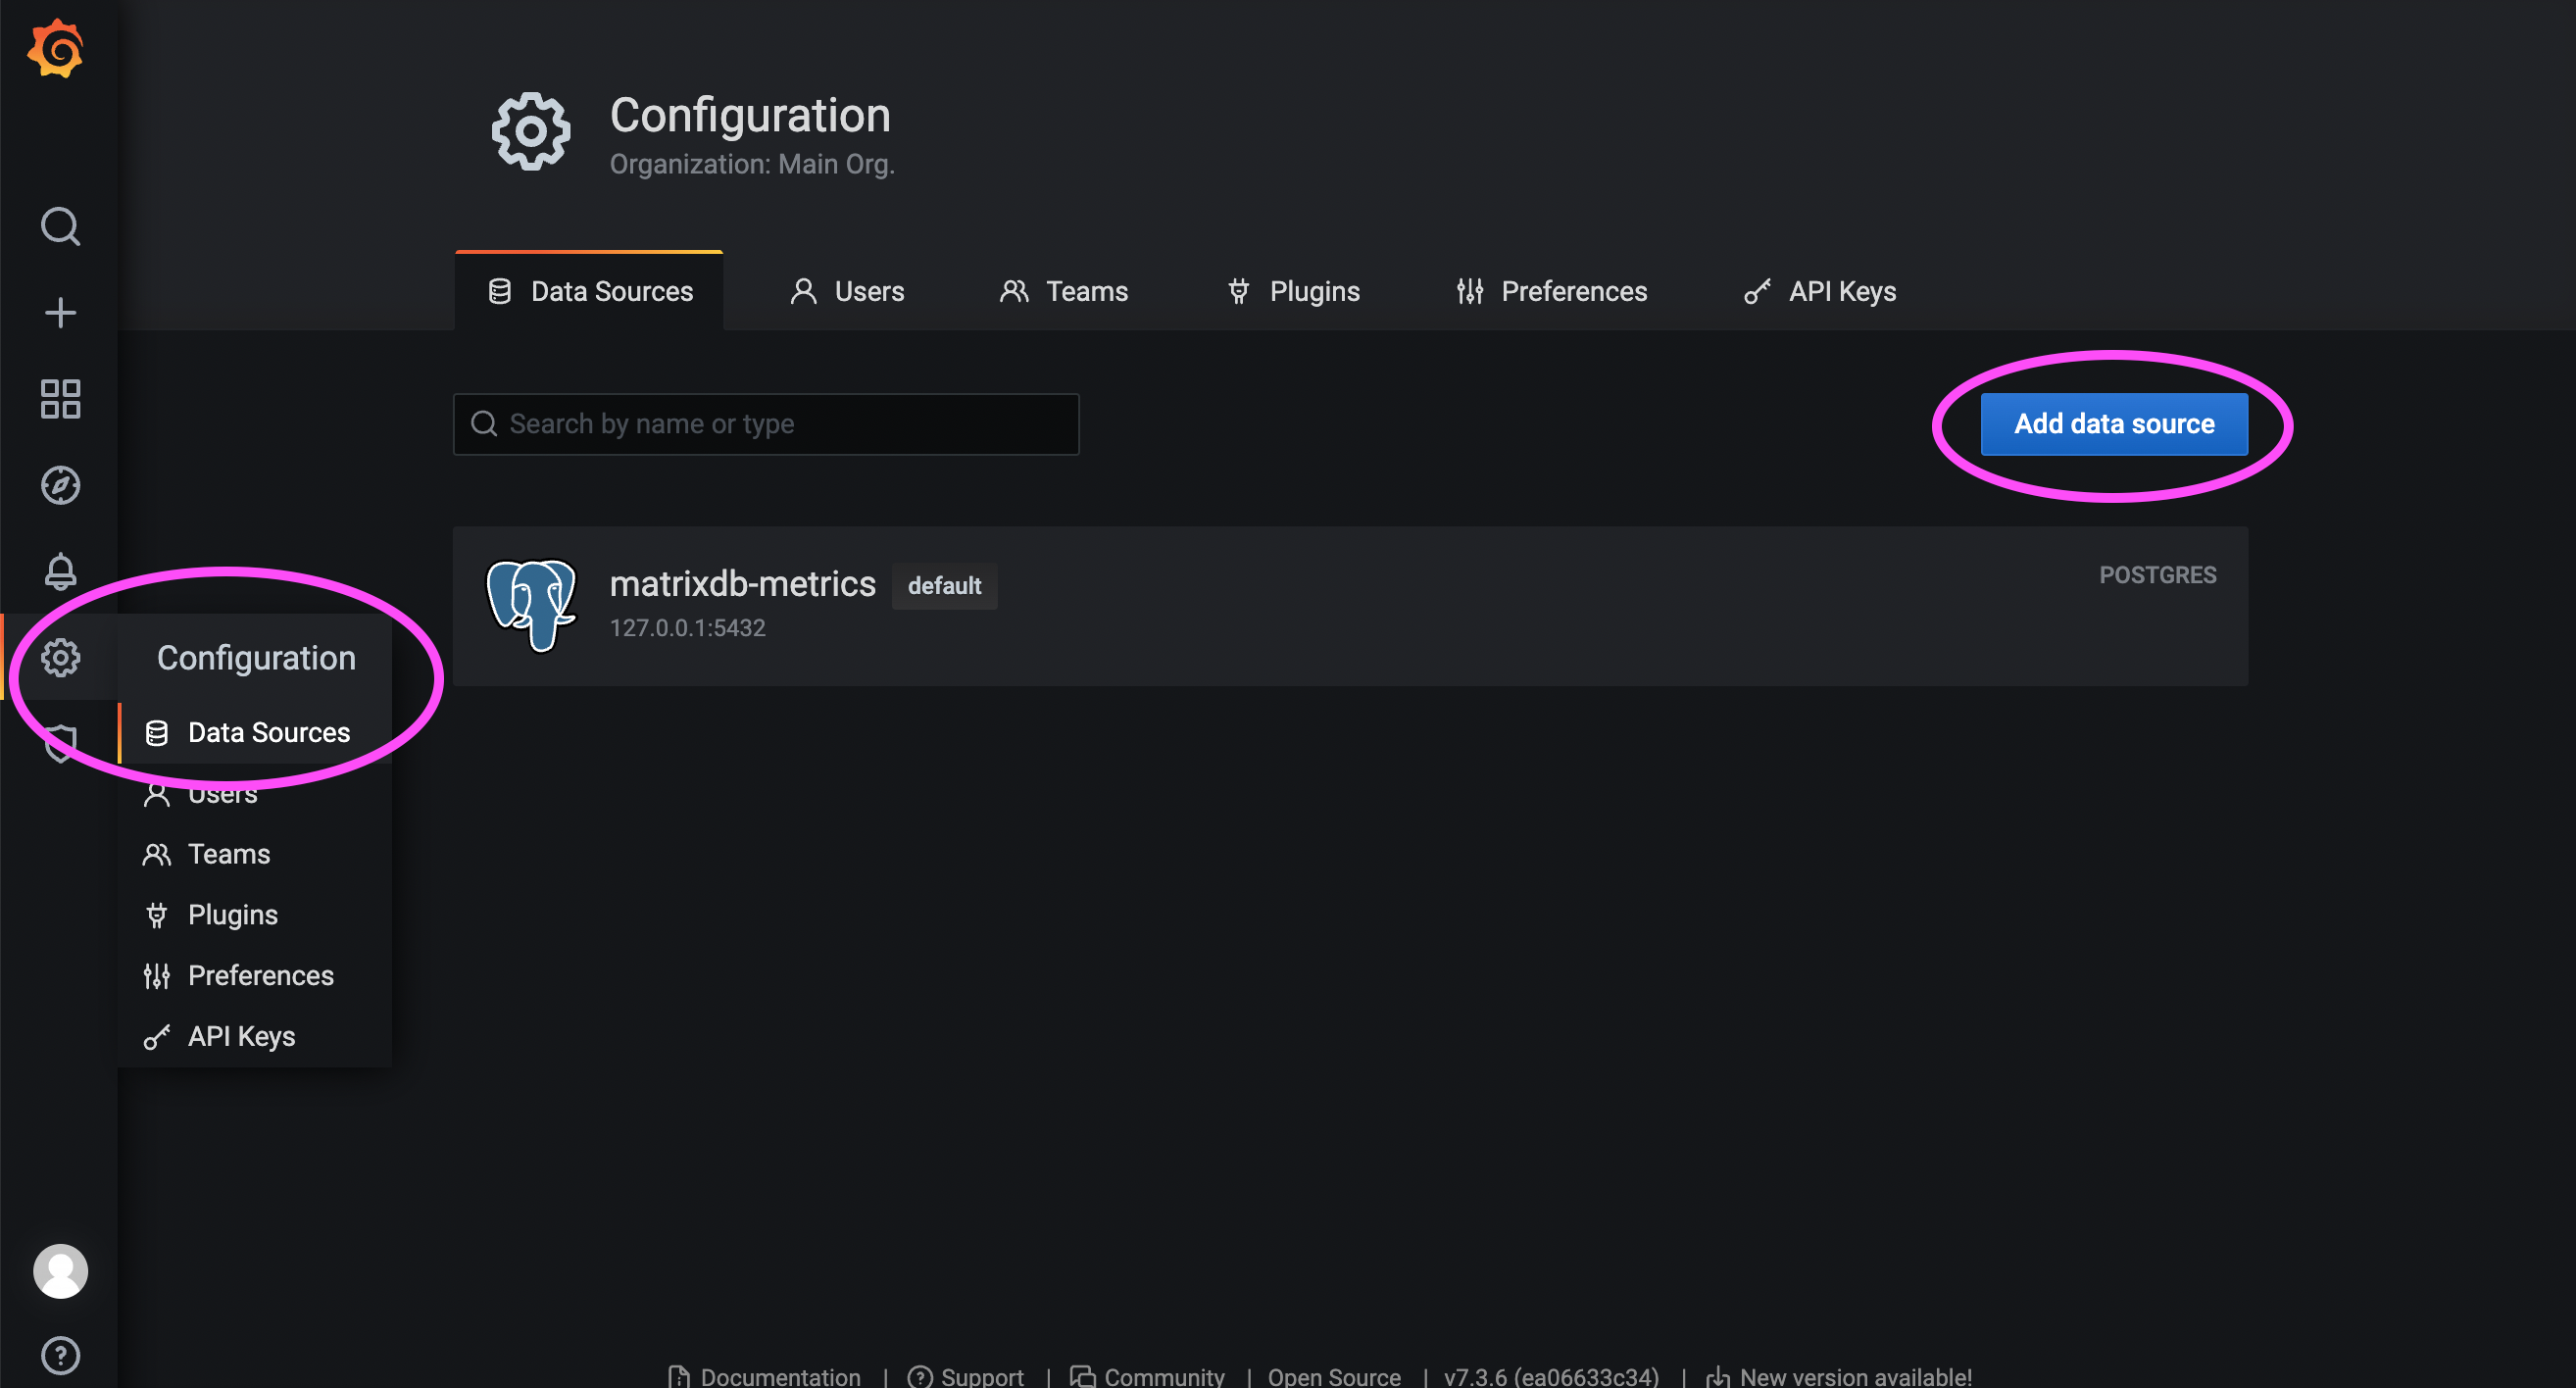
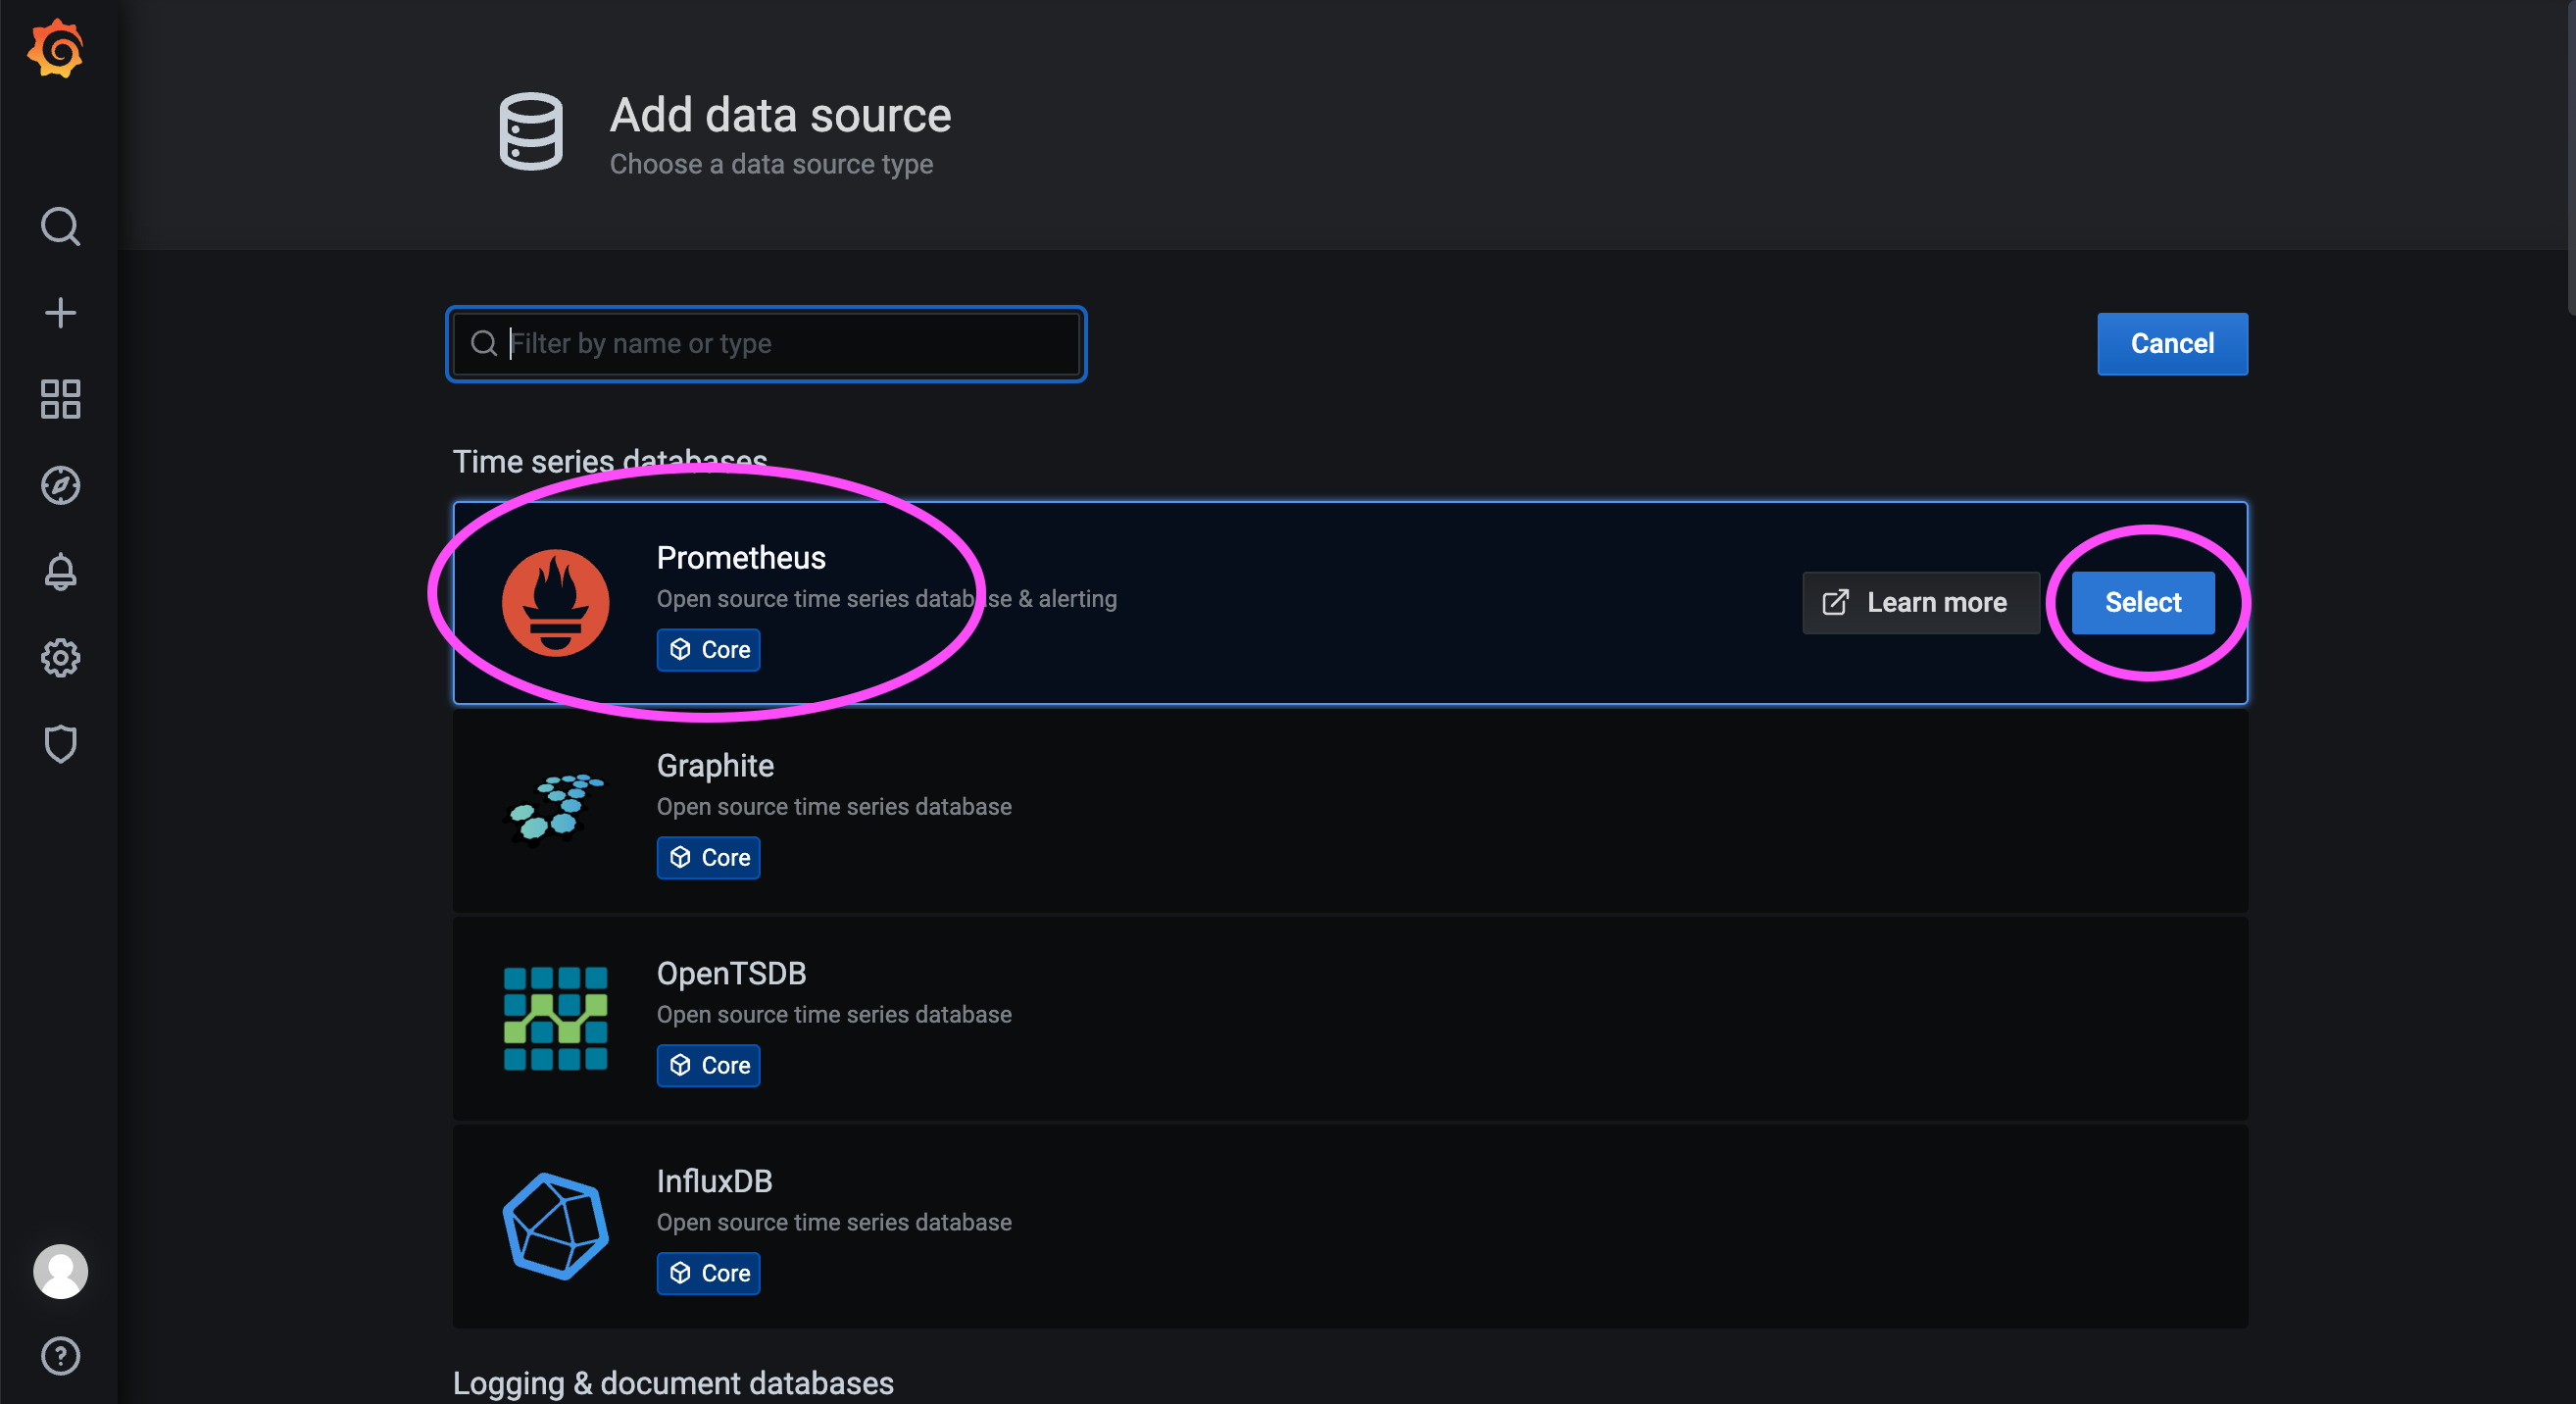

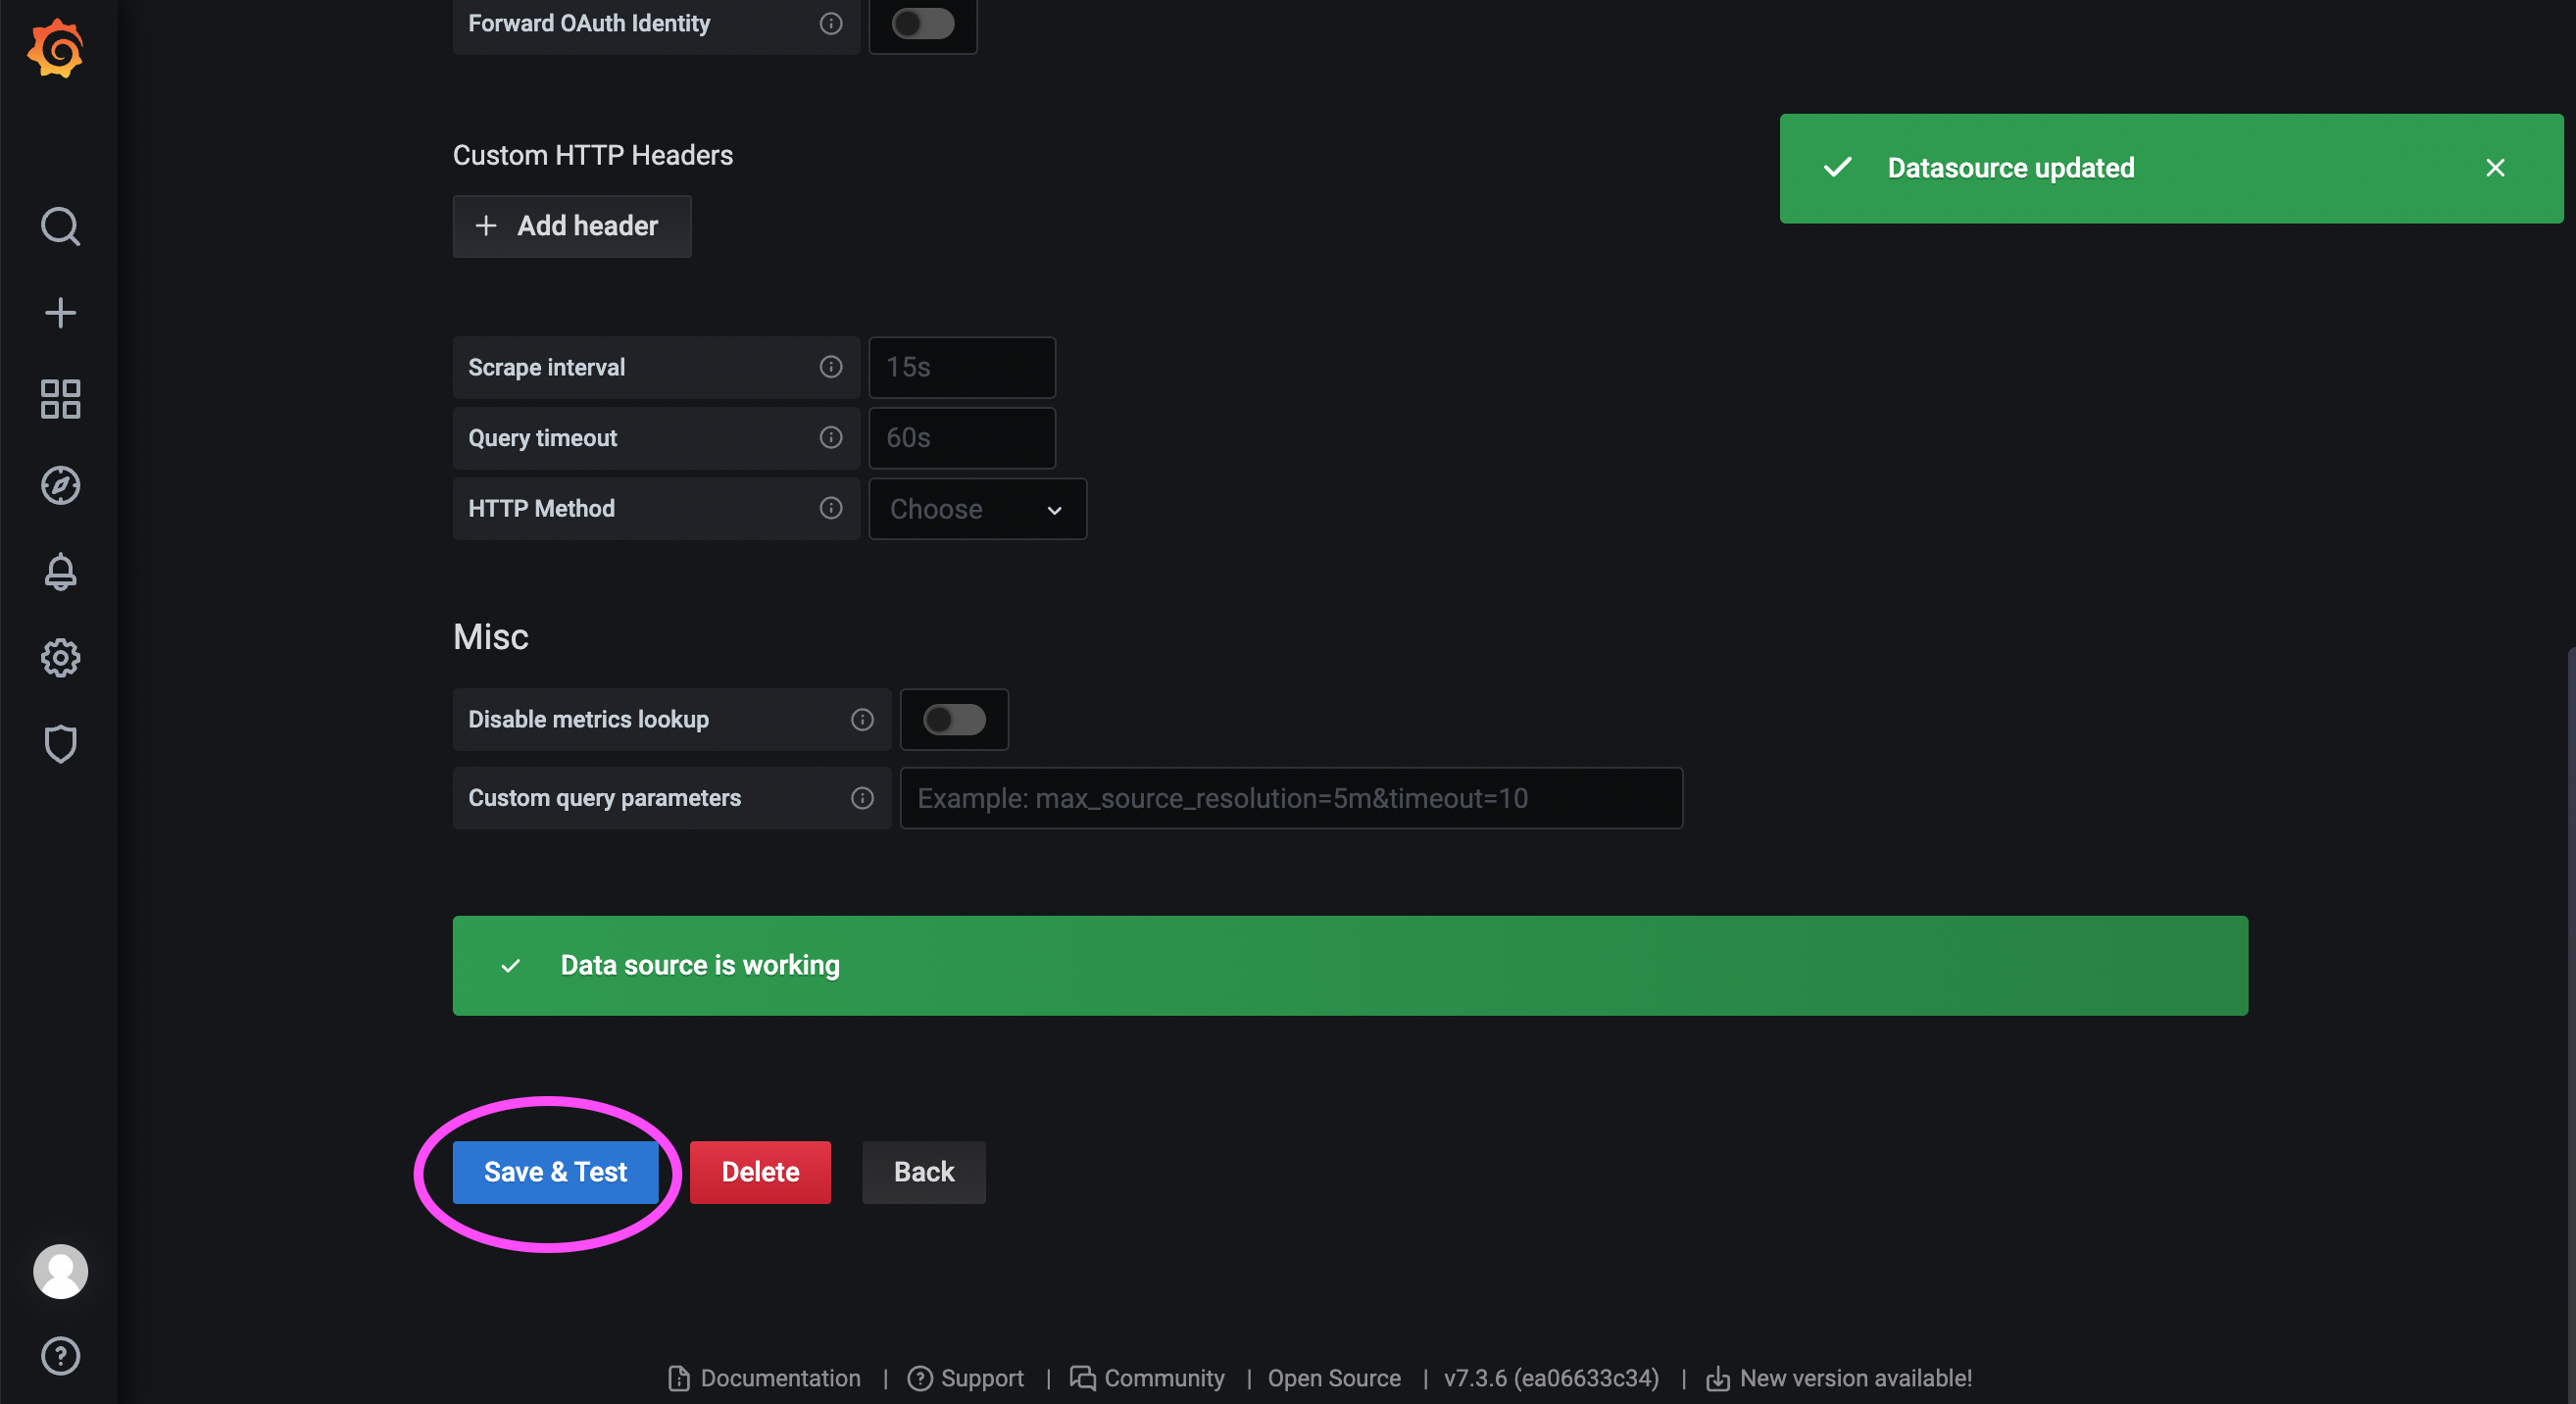
172.31.23.21:9090 is the service port of Prometheus deployed the previous step.
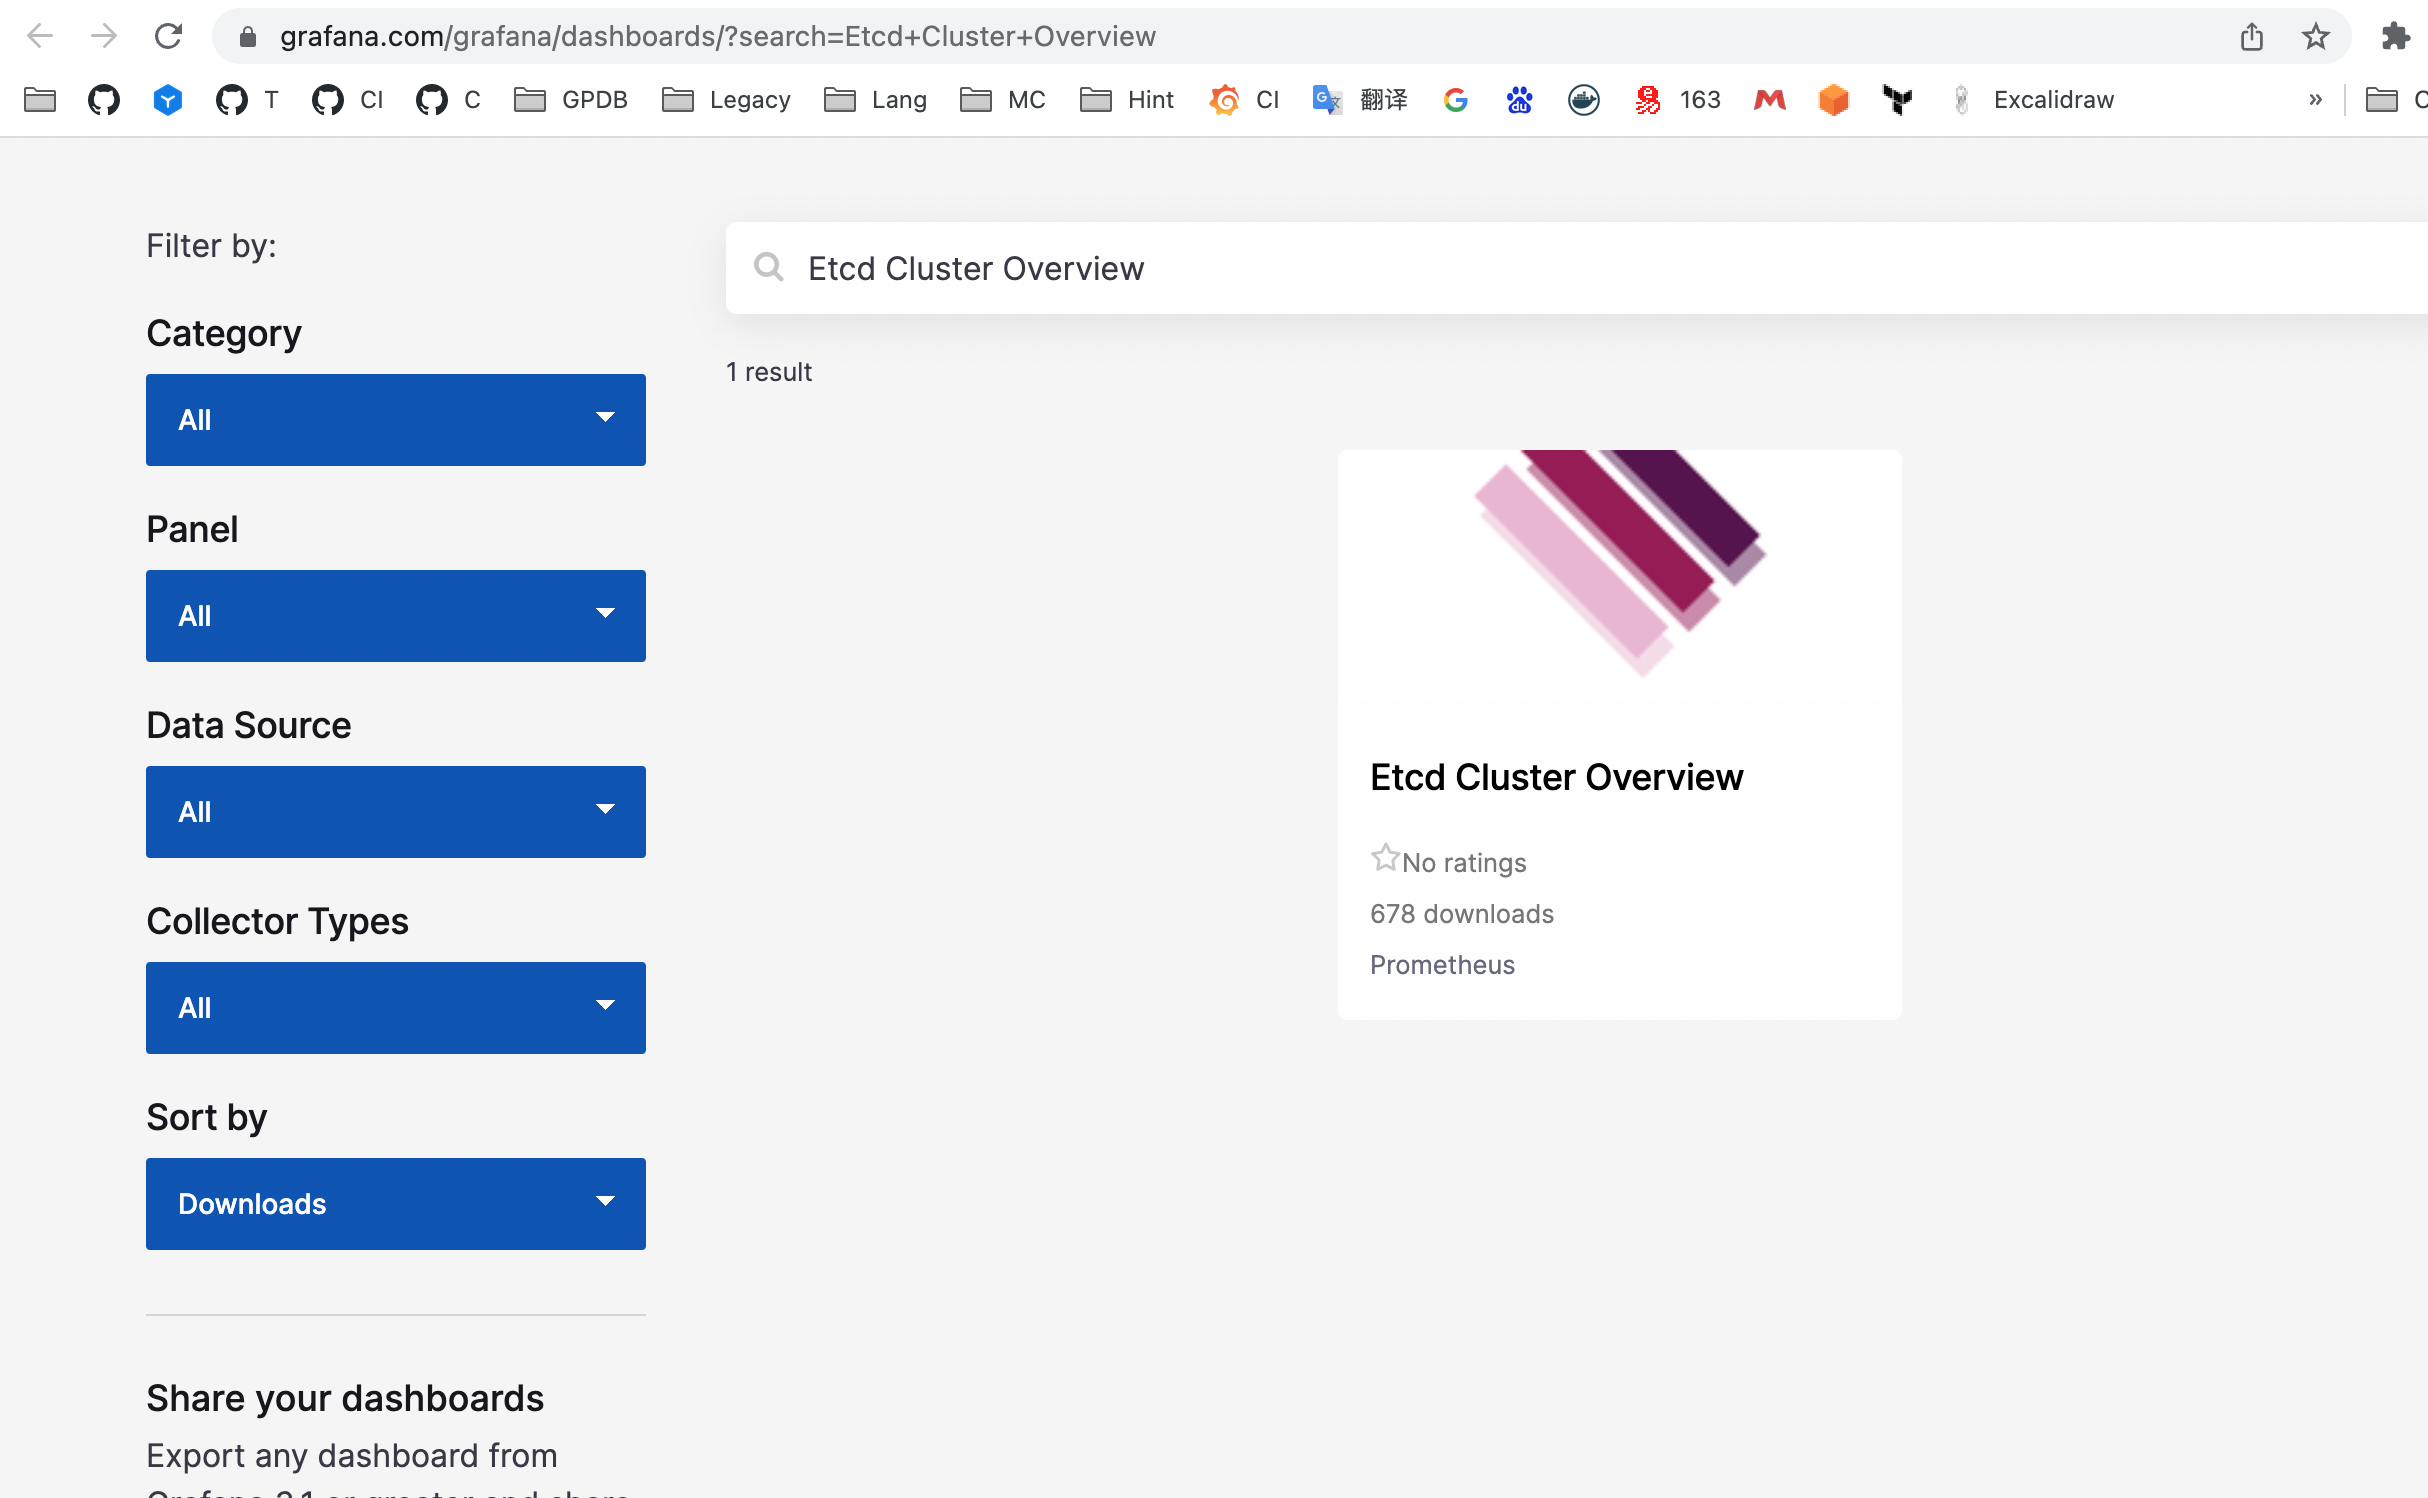
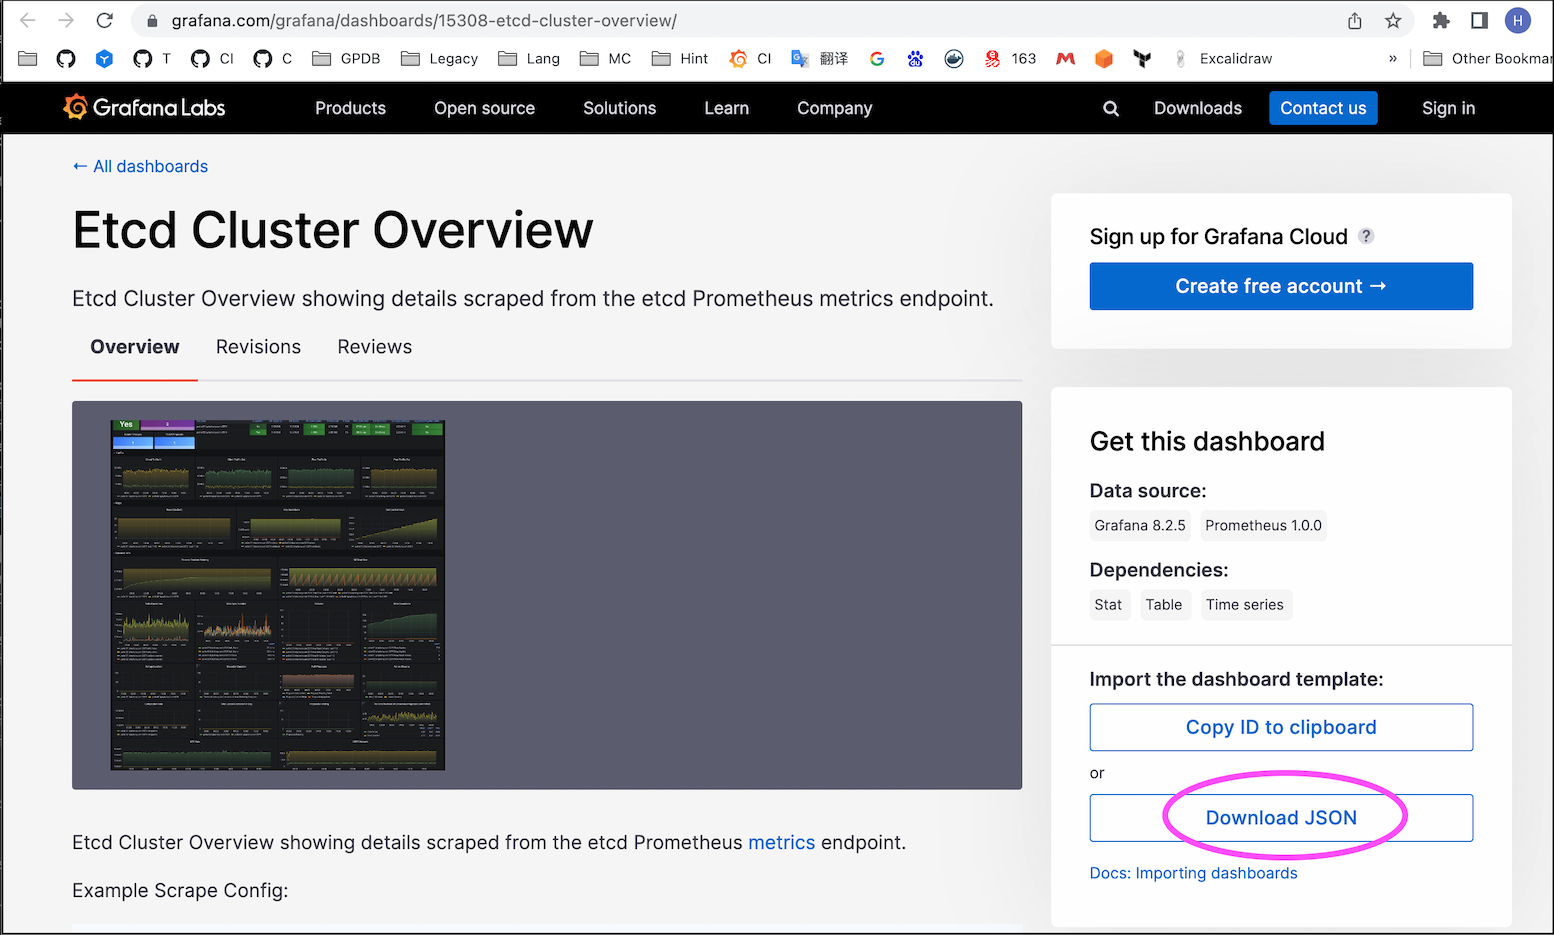
Visit the Grafana community: https://grafana.com/grafana/dashboards/?search=Etcd+Cluster+Overview
As shown in the above link, you can search for the Dashboard provided by the community:
Click to enter to get the ID of the Dashboard:
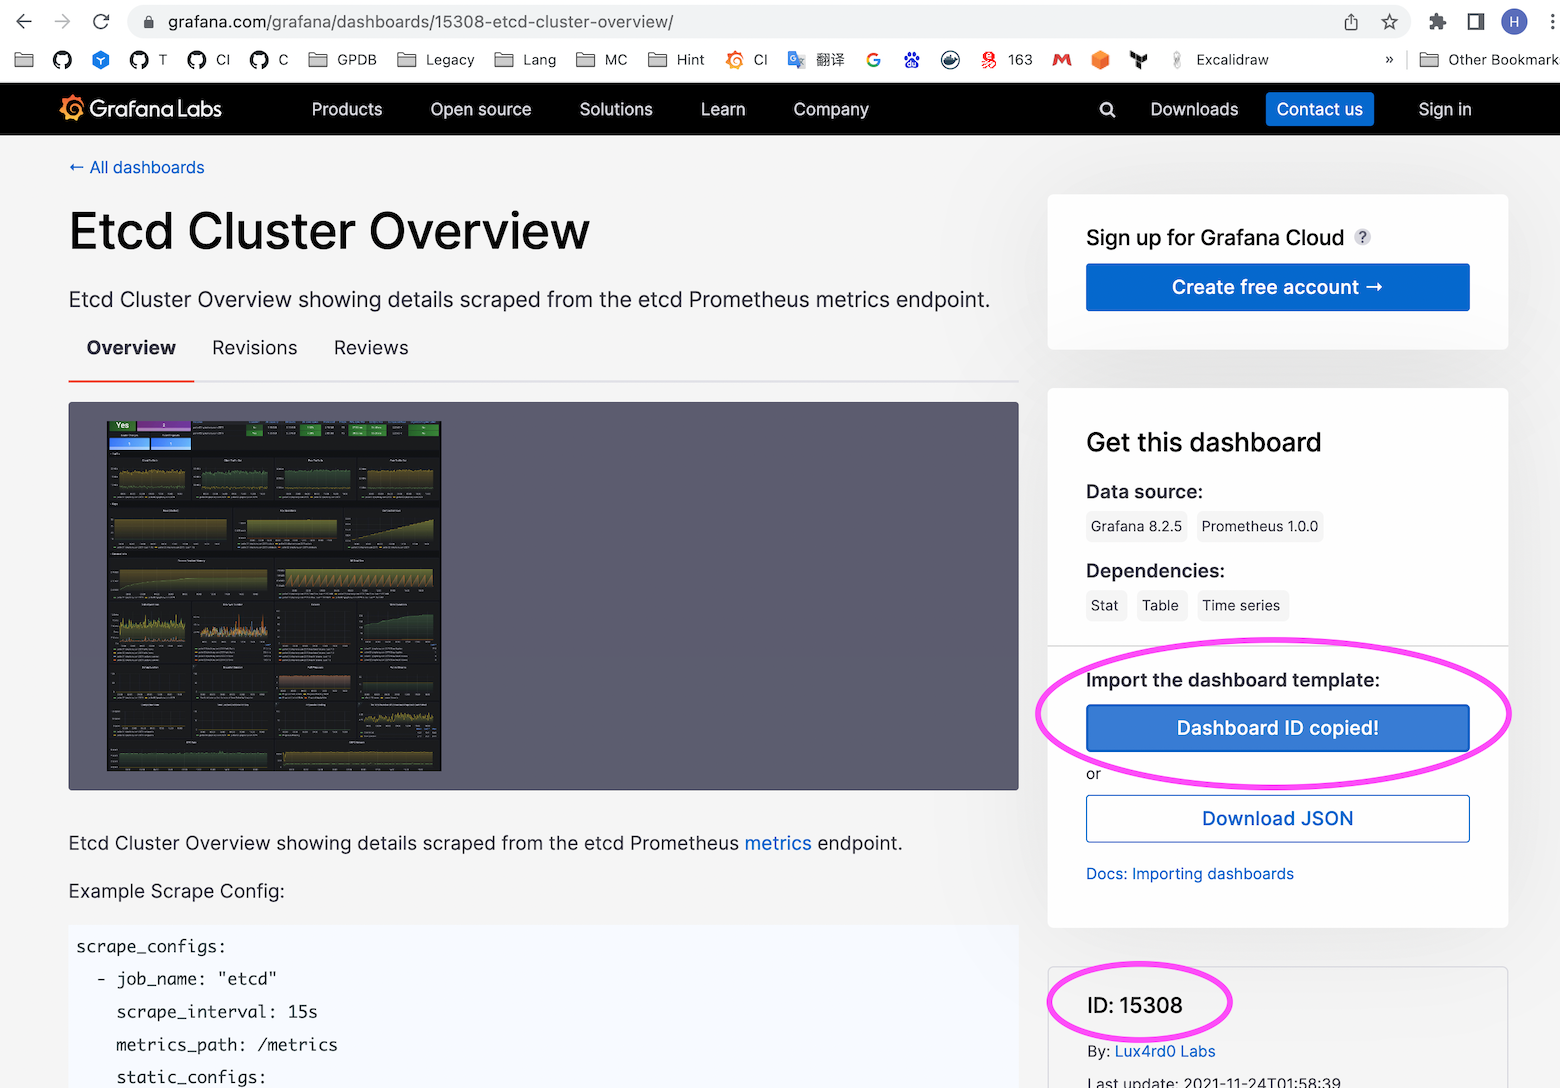
Notes!
The Dashboard corresponding to this ID does not rule out the possibility of changes. Currently, it is 15308. Users please refer to their own search results.
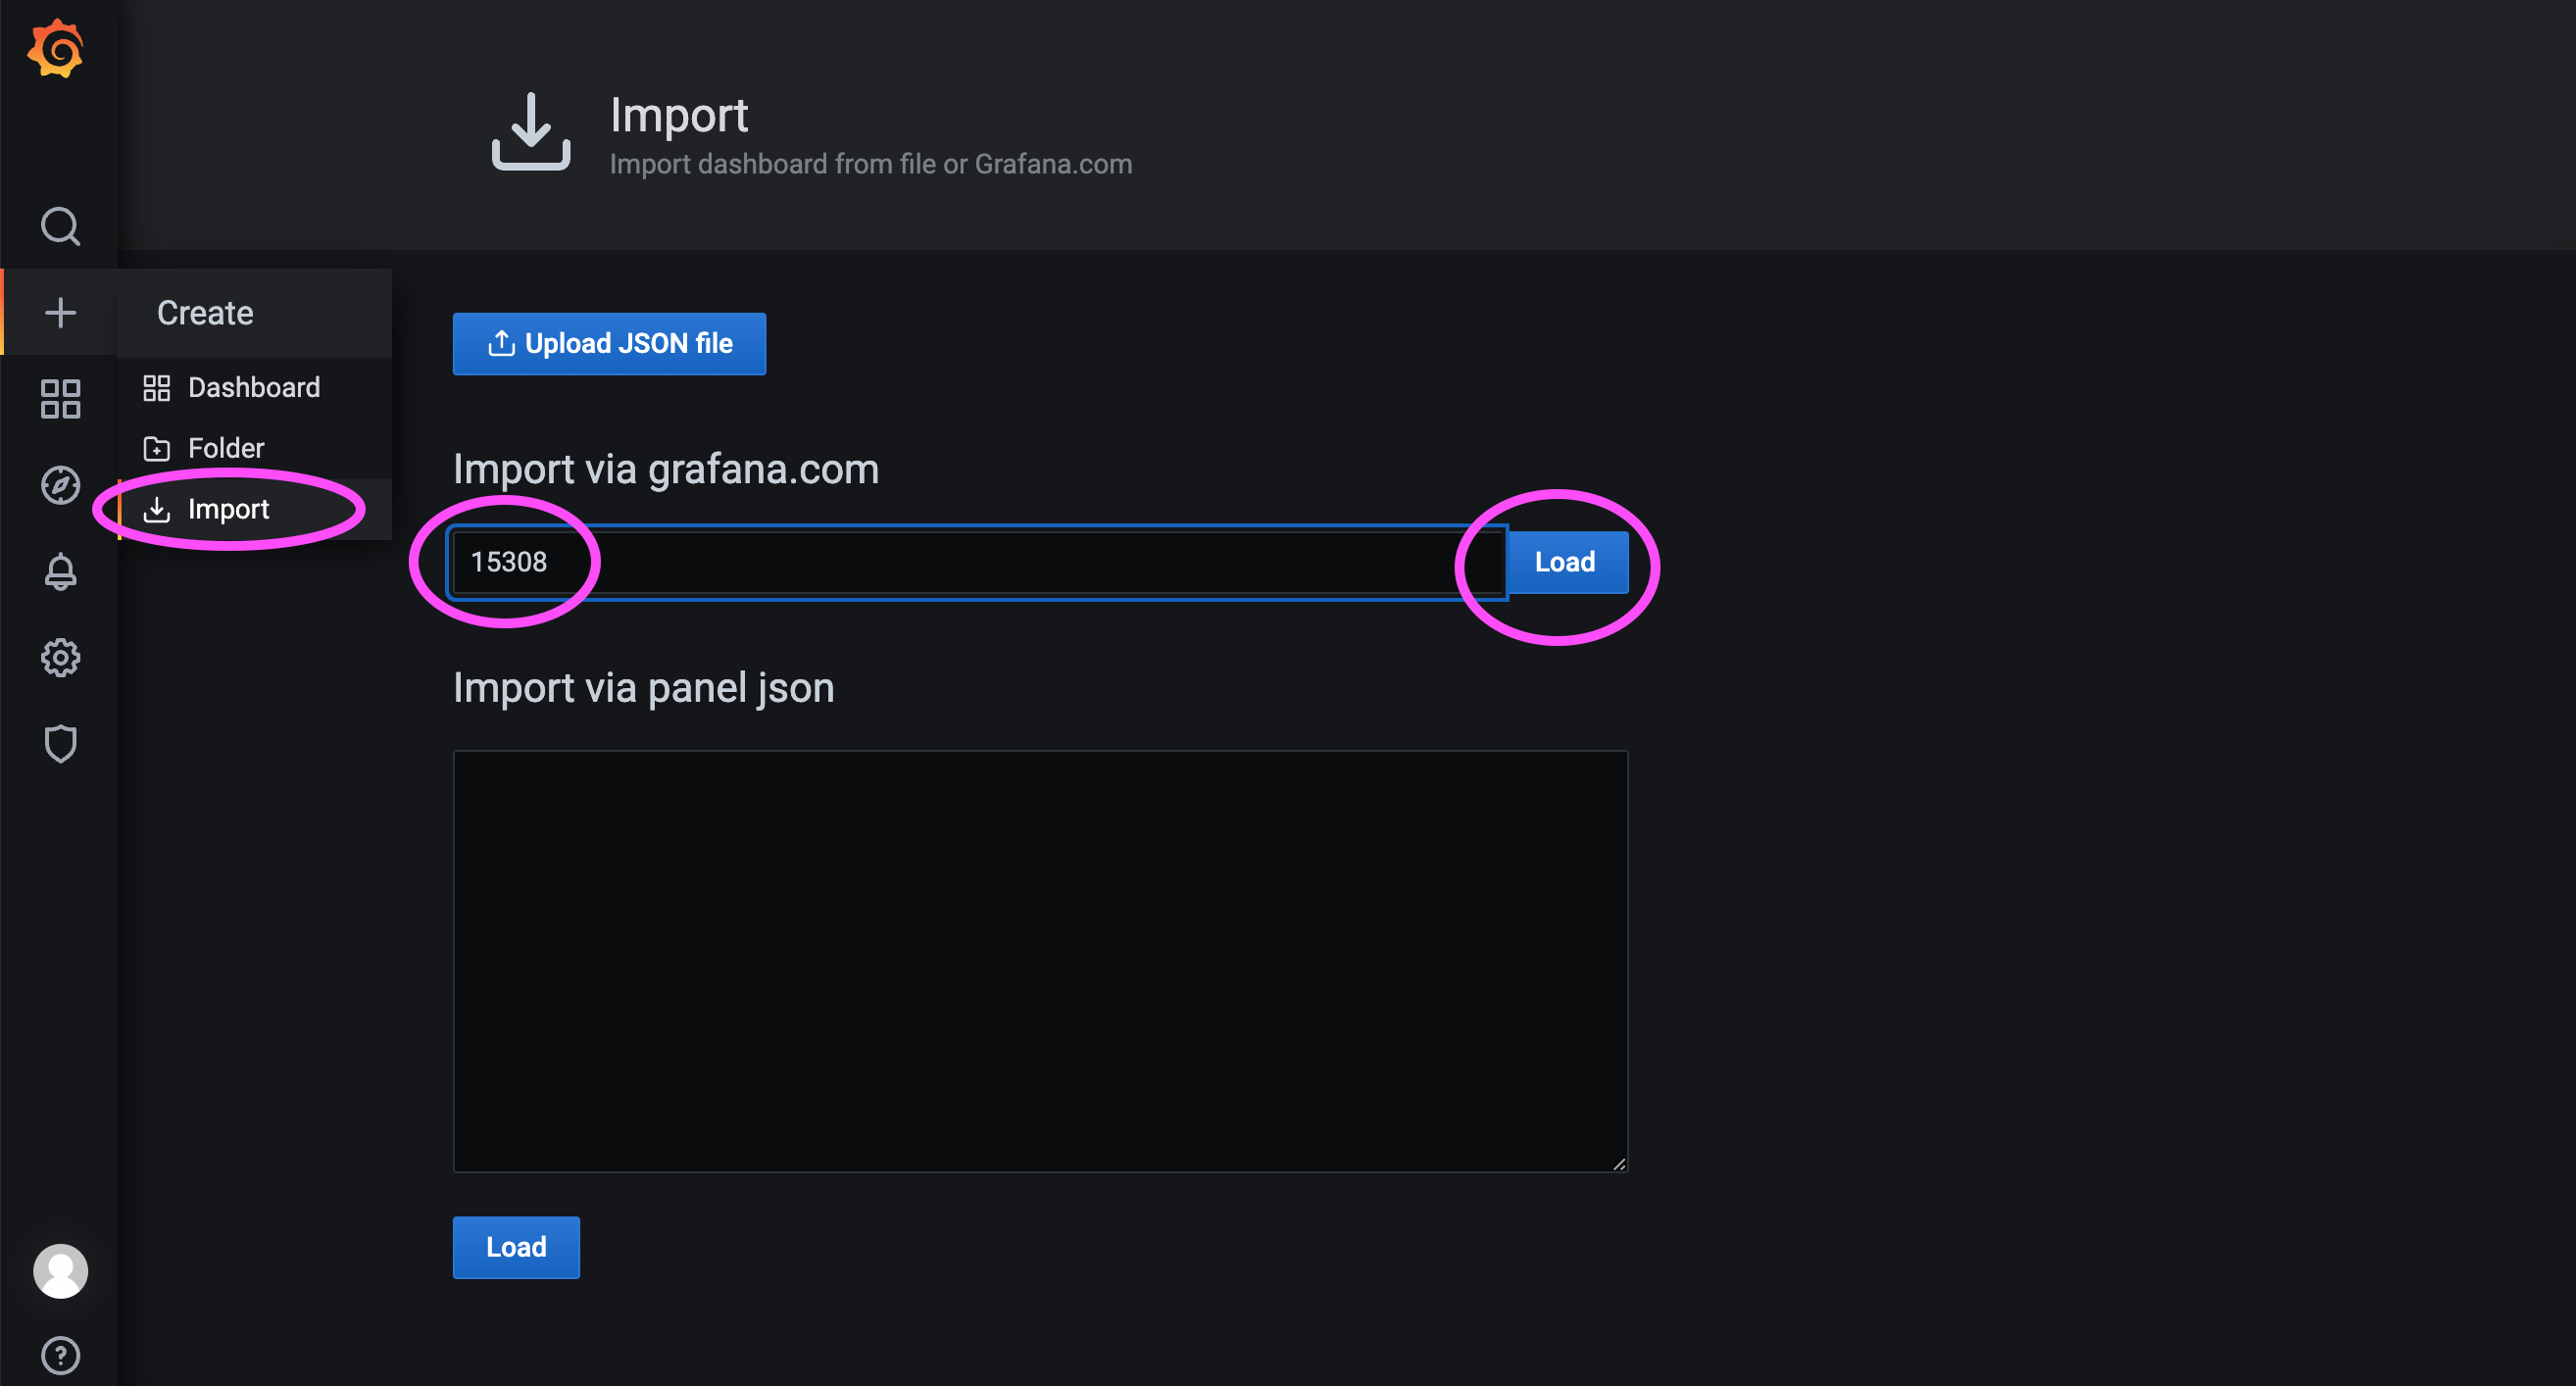
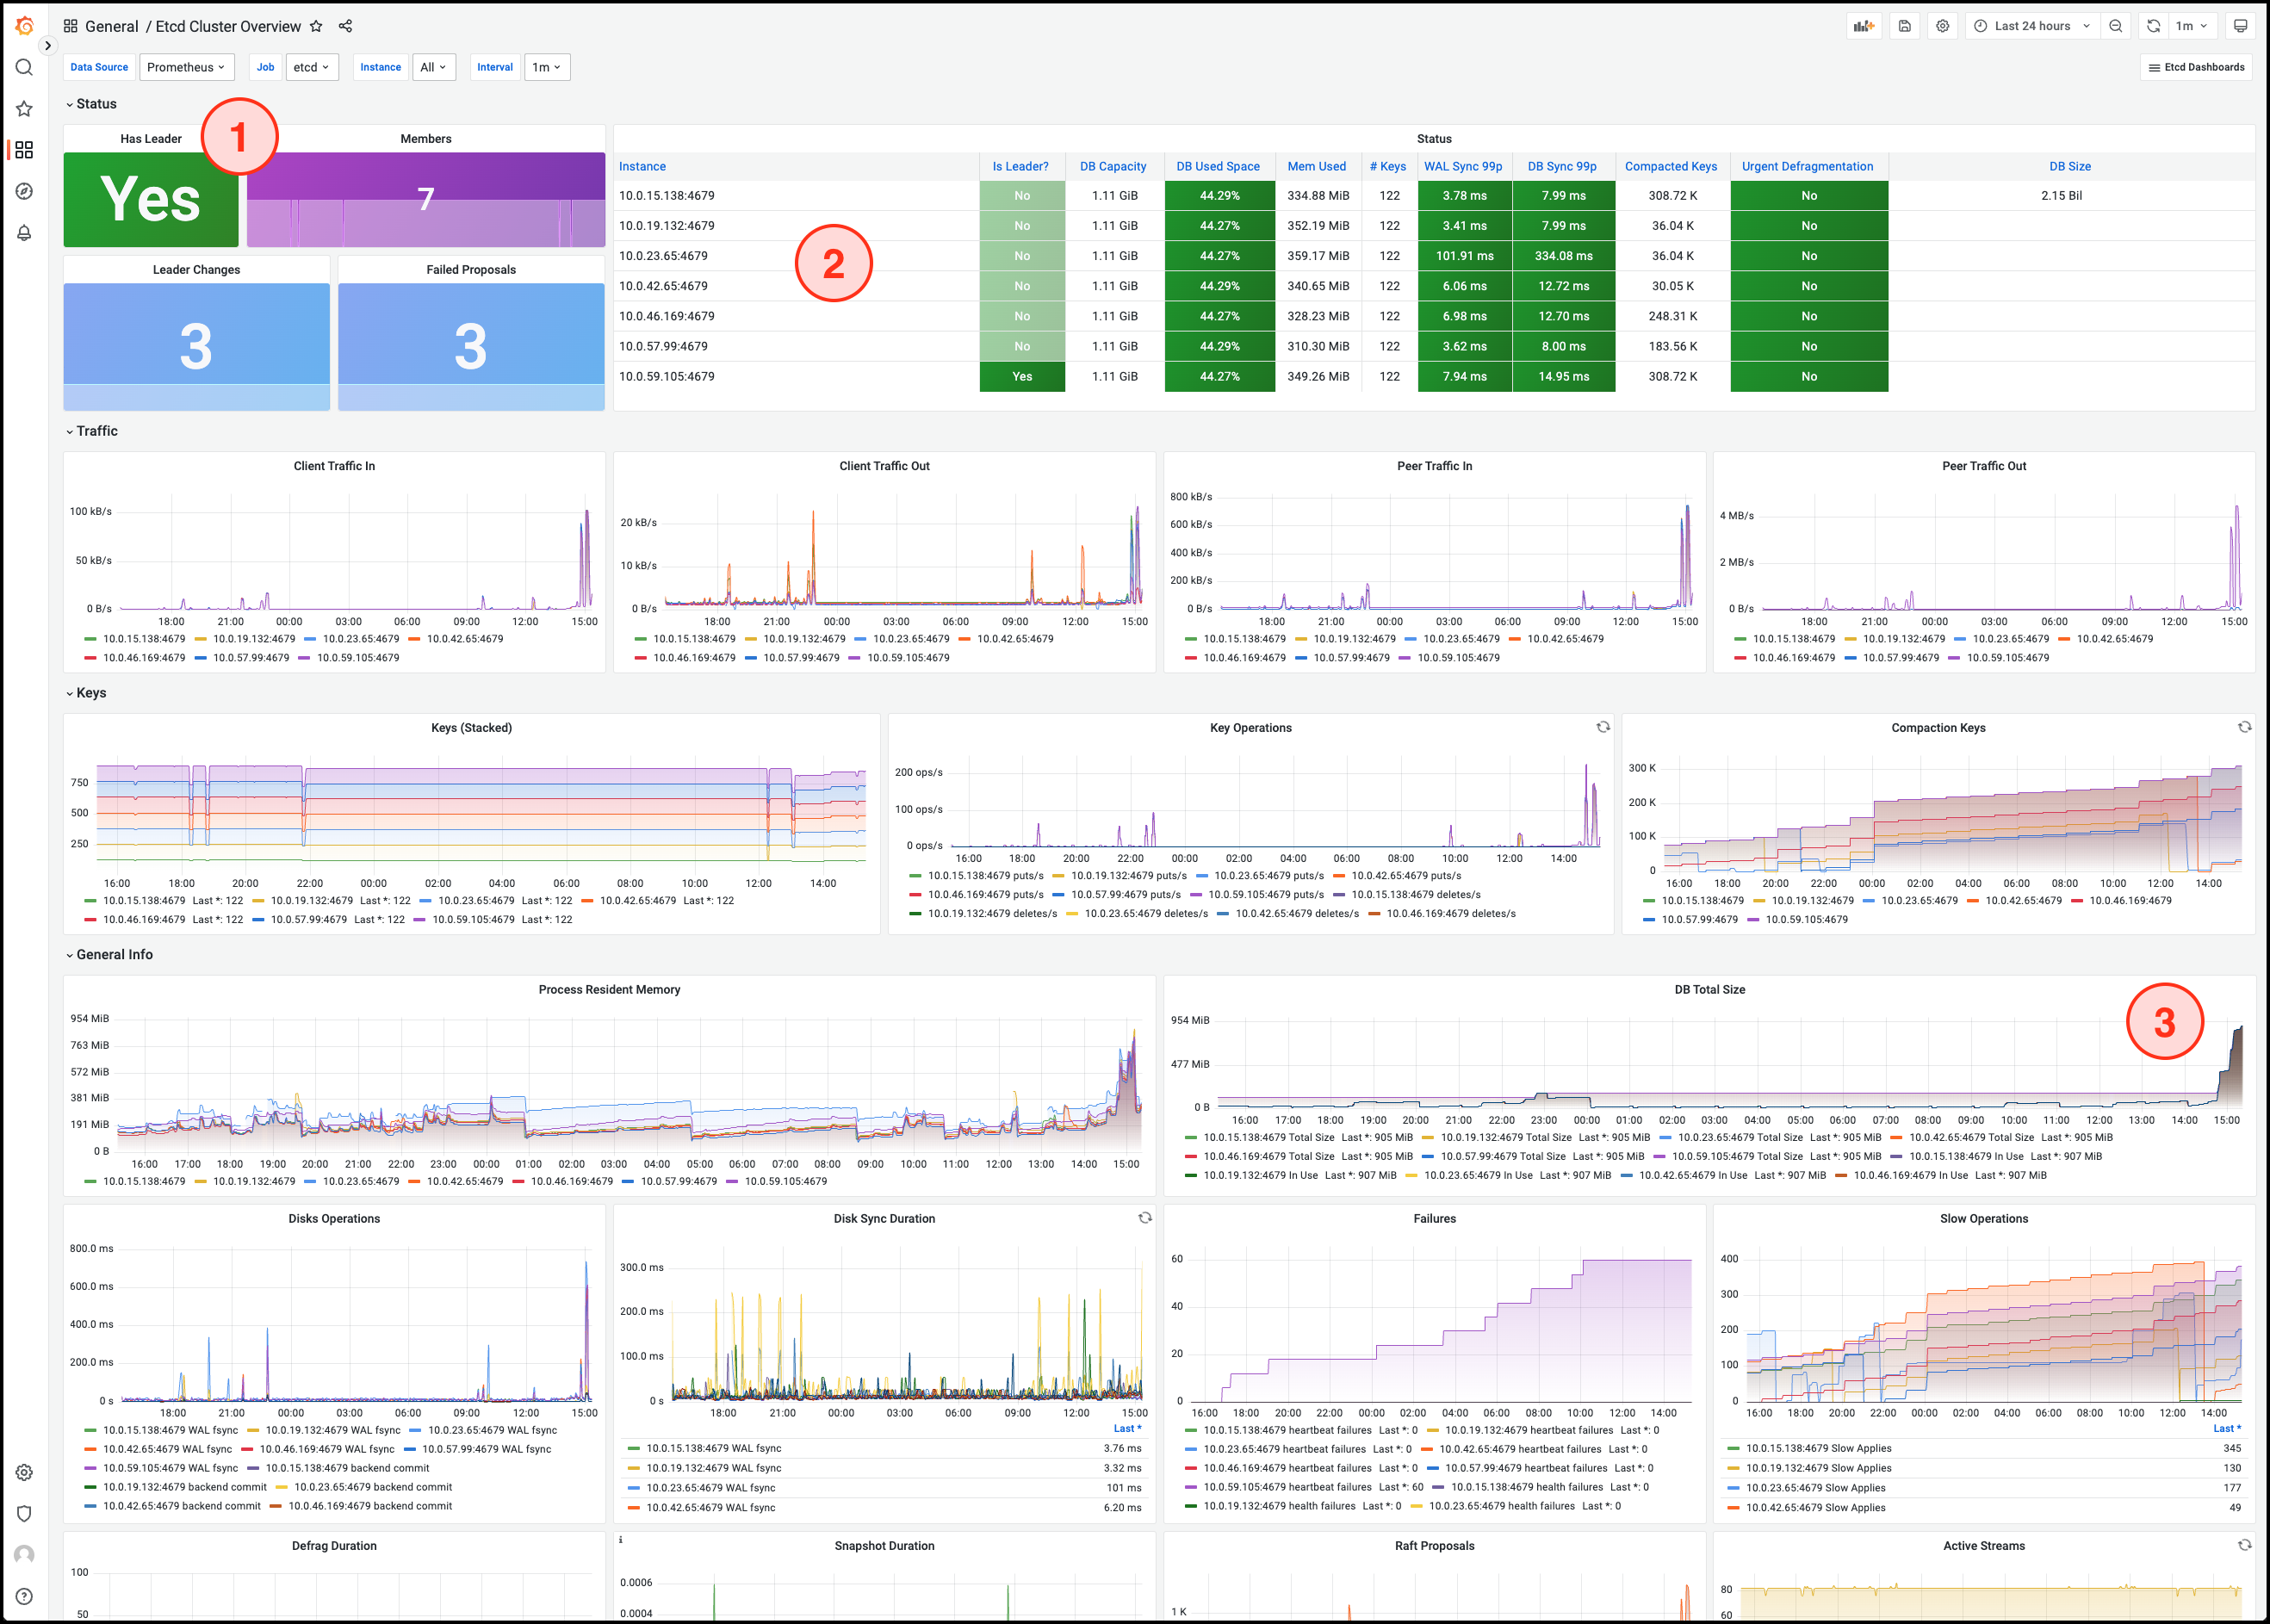
As shown in the figure below, here we import Dashboard No. 15308.
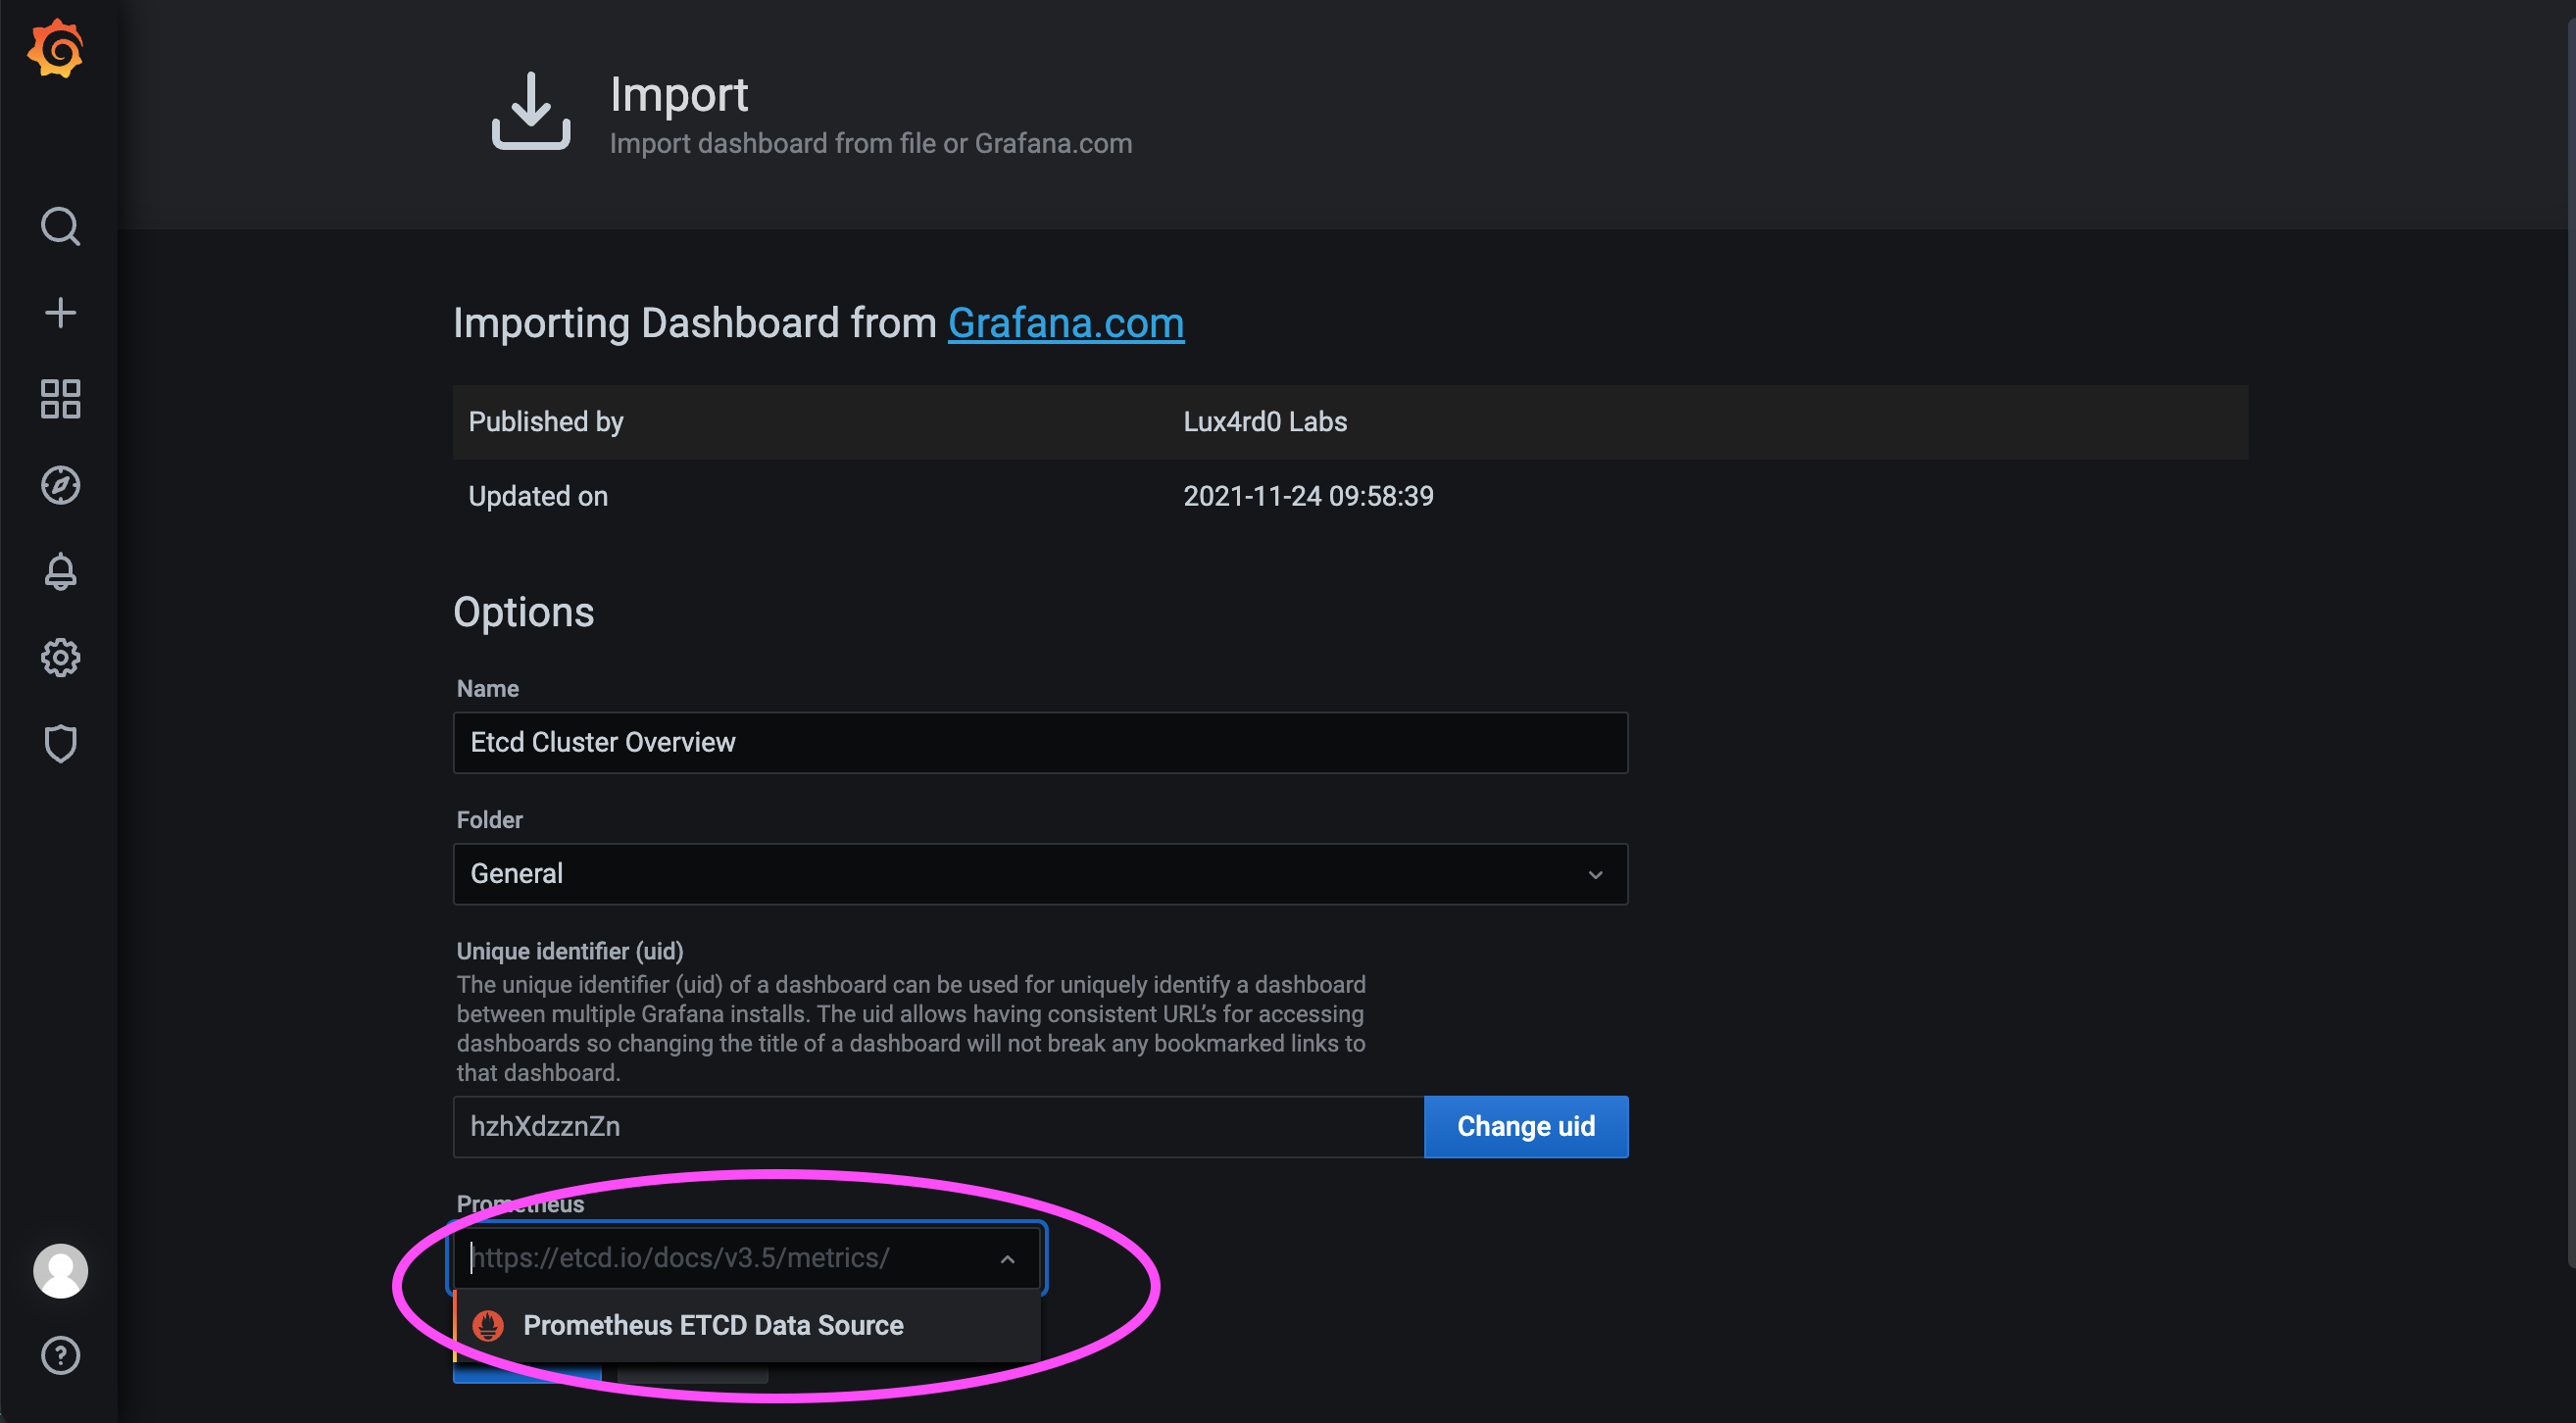
As shown in the figure below, select the data source name we just configured and finally load the Dashboard.
If the server is in the intranet, it may not be possible to import with number 15308. You need to import the JSON file Download Dashboard on other computers that can access the Internet.
Notes!
For more indicators and detailed introductions, please refer to etcd official documentation.