This document will introduce YMatrix's daily operation and maintenance management tools, mainly in the following two parts:
Use Command Line Tools to start and stop the cluster, view the cluster running status, modify the cluster configuration, etc.
Notes!
These commands are controlled by the master node, so they must be executed on the Master node.
Use [Graphic Interface] (/doc/5.0/maintain/management#mxui_tools) to view cluster information.
YMatrix 5 launches a brand new database architecture. Under this architecture, we provide the latest cluster operation and maintenance tools: mxstart, mxstop, mxstate. For more information about the new YMatrix 5 architecture, please see YMatirx Architecture.
Notes!
YMatrix 5 uses the new operation and maintenance tool to manage the cluster by default, and YMatrix 4 (MatrixDB 4) still uses the Greenplum series operation and maintenance tool by default. For details, please see YMatrix 4 Cluster Basic Management.
The mxstart -a command can start the YMatrix cluster.
[mxadmin@mdw ~]$ mxstart -a
The mxstop -a command is used to stop a running YMatrix cluster.
| mxstop mode | parameters | disable new connection | wait for the process to run | Is it the default mode |
|---|---|---|---|---|
| smart | -M smart | Yes | Yes | |
| fast | -M fast | Yes | No, interrupted connection, transaction rollback | No |
| immediate | -M immediate | Yes | No, kill the process directly | No |
[mxadmin@mdw ~]$ mxstop -a -M fastPlease select a mode to stop the cluster. For most cases of YMatrix clusters, using fast mode is the best way to do it. If you do not select mode (mxstop -a), the smart mode is enabled for you by default to ensure that the operations you are doing can be completed naturally, but may wait for a long time. Blocking of this command will not affect the use of the cluster, but the cluster cannot create new connections.
mxstop -ar can restart the cluster.
After modifying the pg_hba.conf authorization configuration, you need to call mxstop -u to reload the authorization configuration.
mxstate can view the running status of the cluster, including:
[mxadmin@mdw ~]$ mxstategpconfig is used to view or modify configuration parameters in the configuration file postgresql.conf.
You can view the configuration by adding the configuration name:
[mxadmin@mdw ~]$ gpconfig -s shared_buffers
Values on all segments are consistent
GUC          : shared_buffers
Master  value: 1078464kB
Segment value: 1078464kBModify the configuration via gpconfig -c {config name} -v {value}:
[mxadmin@mdw ~]$ gpconfig -c shared_buffers -v 128MB
20210723:17:13:35:004318 gpconfig:sdw2:mxadmin-[INFO]:-completed successfully with parameters '-c shared_buffers -v 128MB'
After modifying the configuration, you must restart the cluster before it can take effect:
[mxadmin@mdw ~]$ mxstop -arAfter restarting, check the configuration:
[mxadmin@mdw ~]$ gpconfig -s shared_buffers
Values on all segments are consistent
GUC          : shared_buffers
Master  value: 128MB
Segment value: 128MB
Notes!
For details of gpconfig, please refer to gpconfig
Normally, you may get cluster meta information through system tables such as pg_database, pg_class.
To view this information more conveniently and intuitively (databases, data tables, and each table size, type, access time, etc.), YMatrix provides a graphical work page that can be easily clicked to get what you need.
First, you need to log in to the graphical interface. Enter the IP of the machine where the graphical interface MXUI process is located (the default is the IP of Master) and the port number:
http://<IP>:8240After successfully logging in, enter the "Cluster Management" page, and the "Metrics View" is displayed by default, including 2 parts:
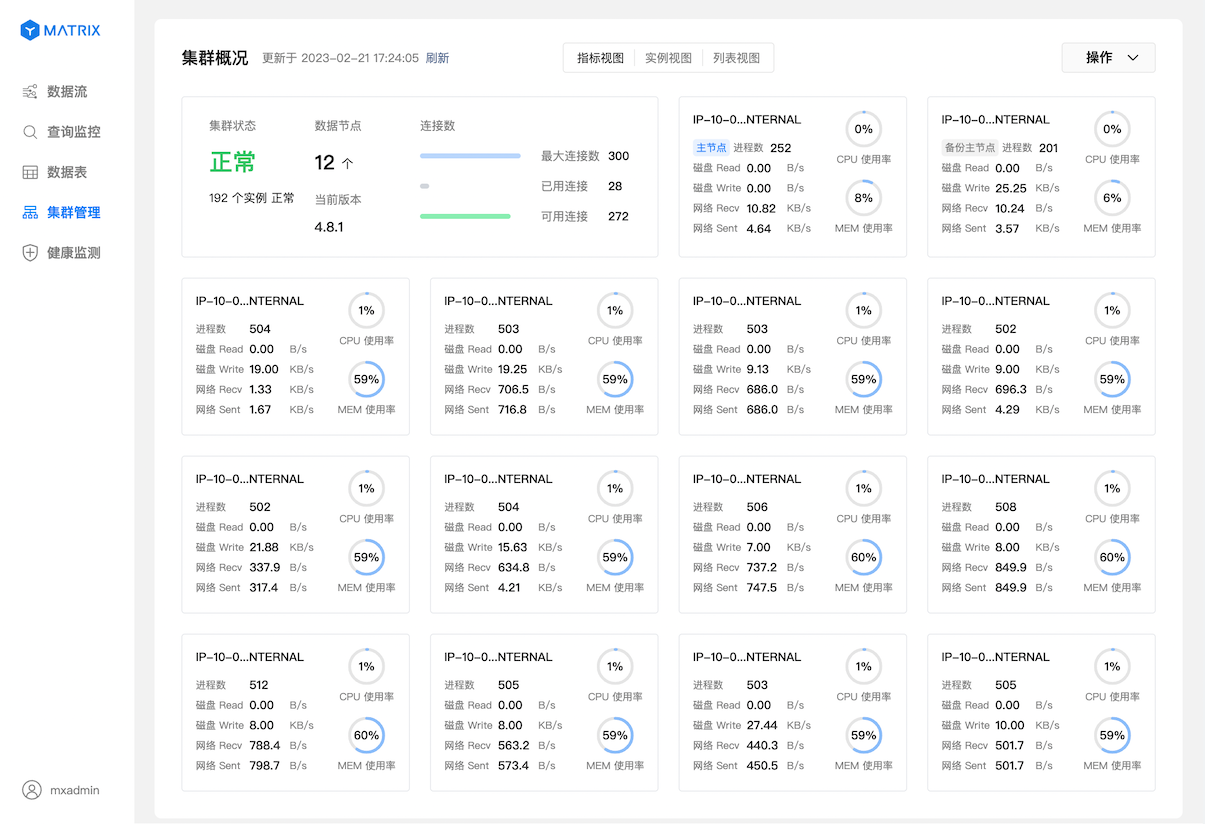
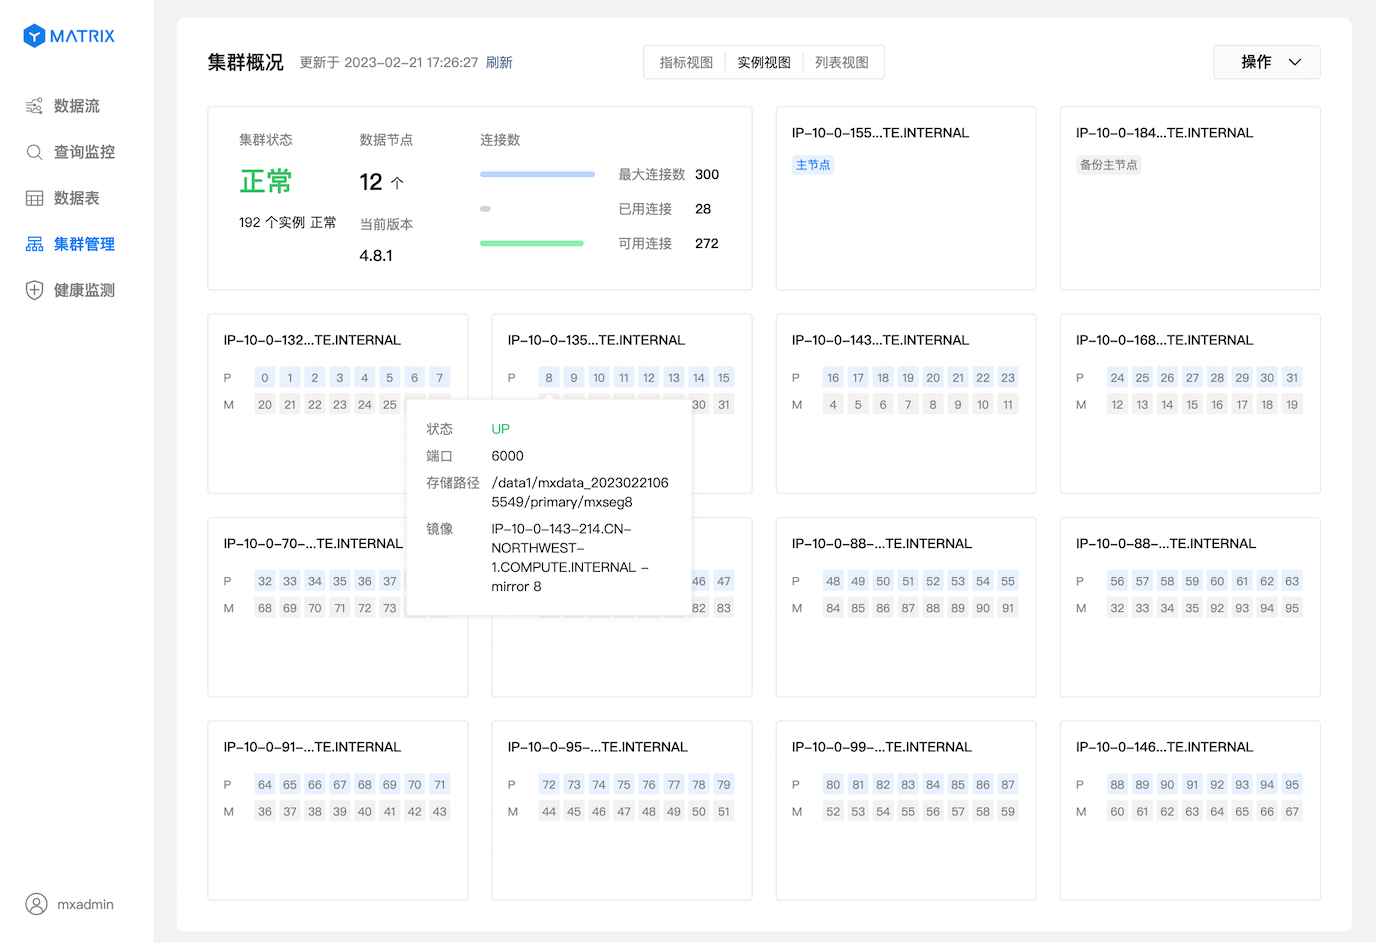
Switch to "Instance View", and the information of each node is switched from the indicator to the status and distribution of the instance.

The mouse is suspended in any instance to obtain detailed information about the instance.
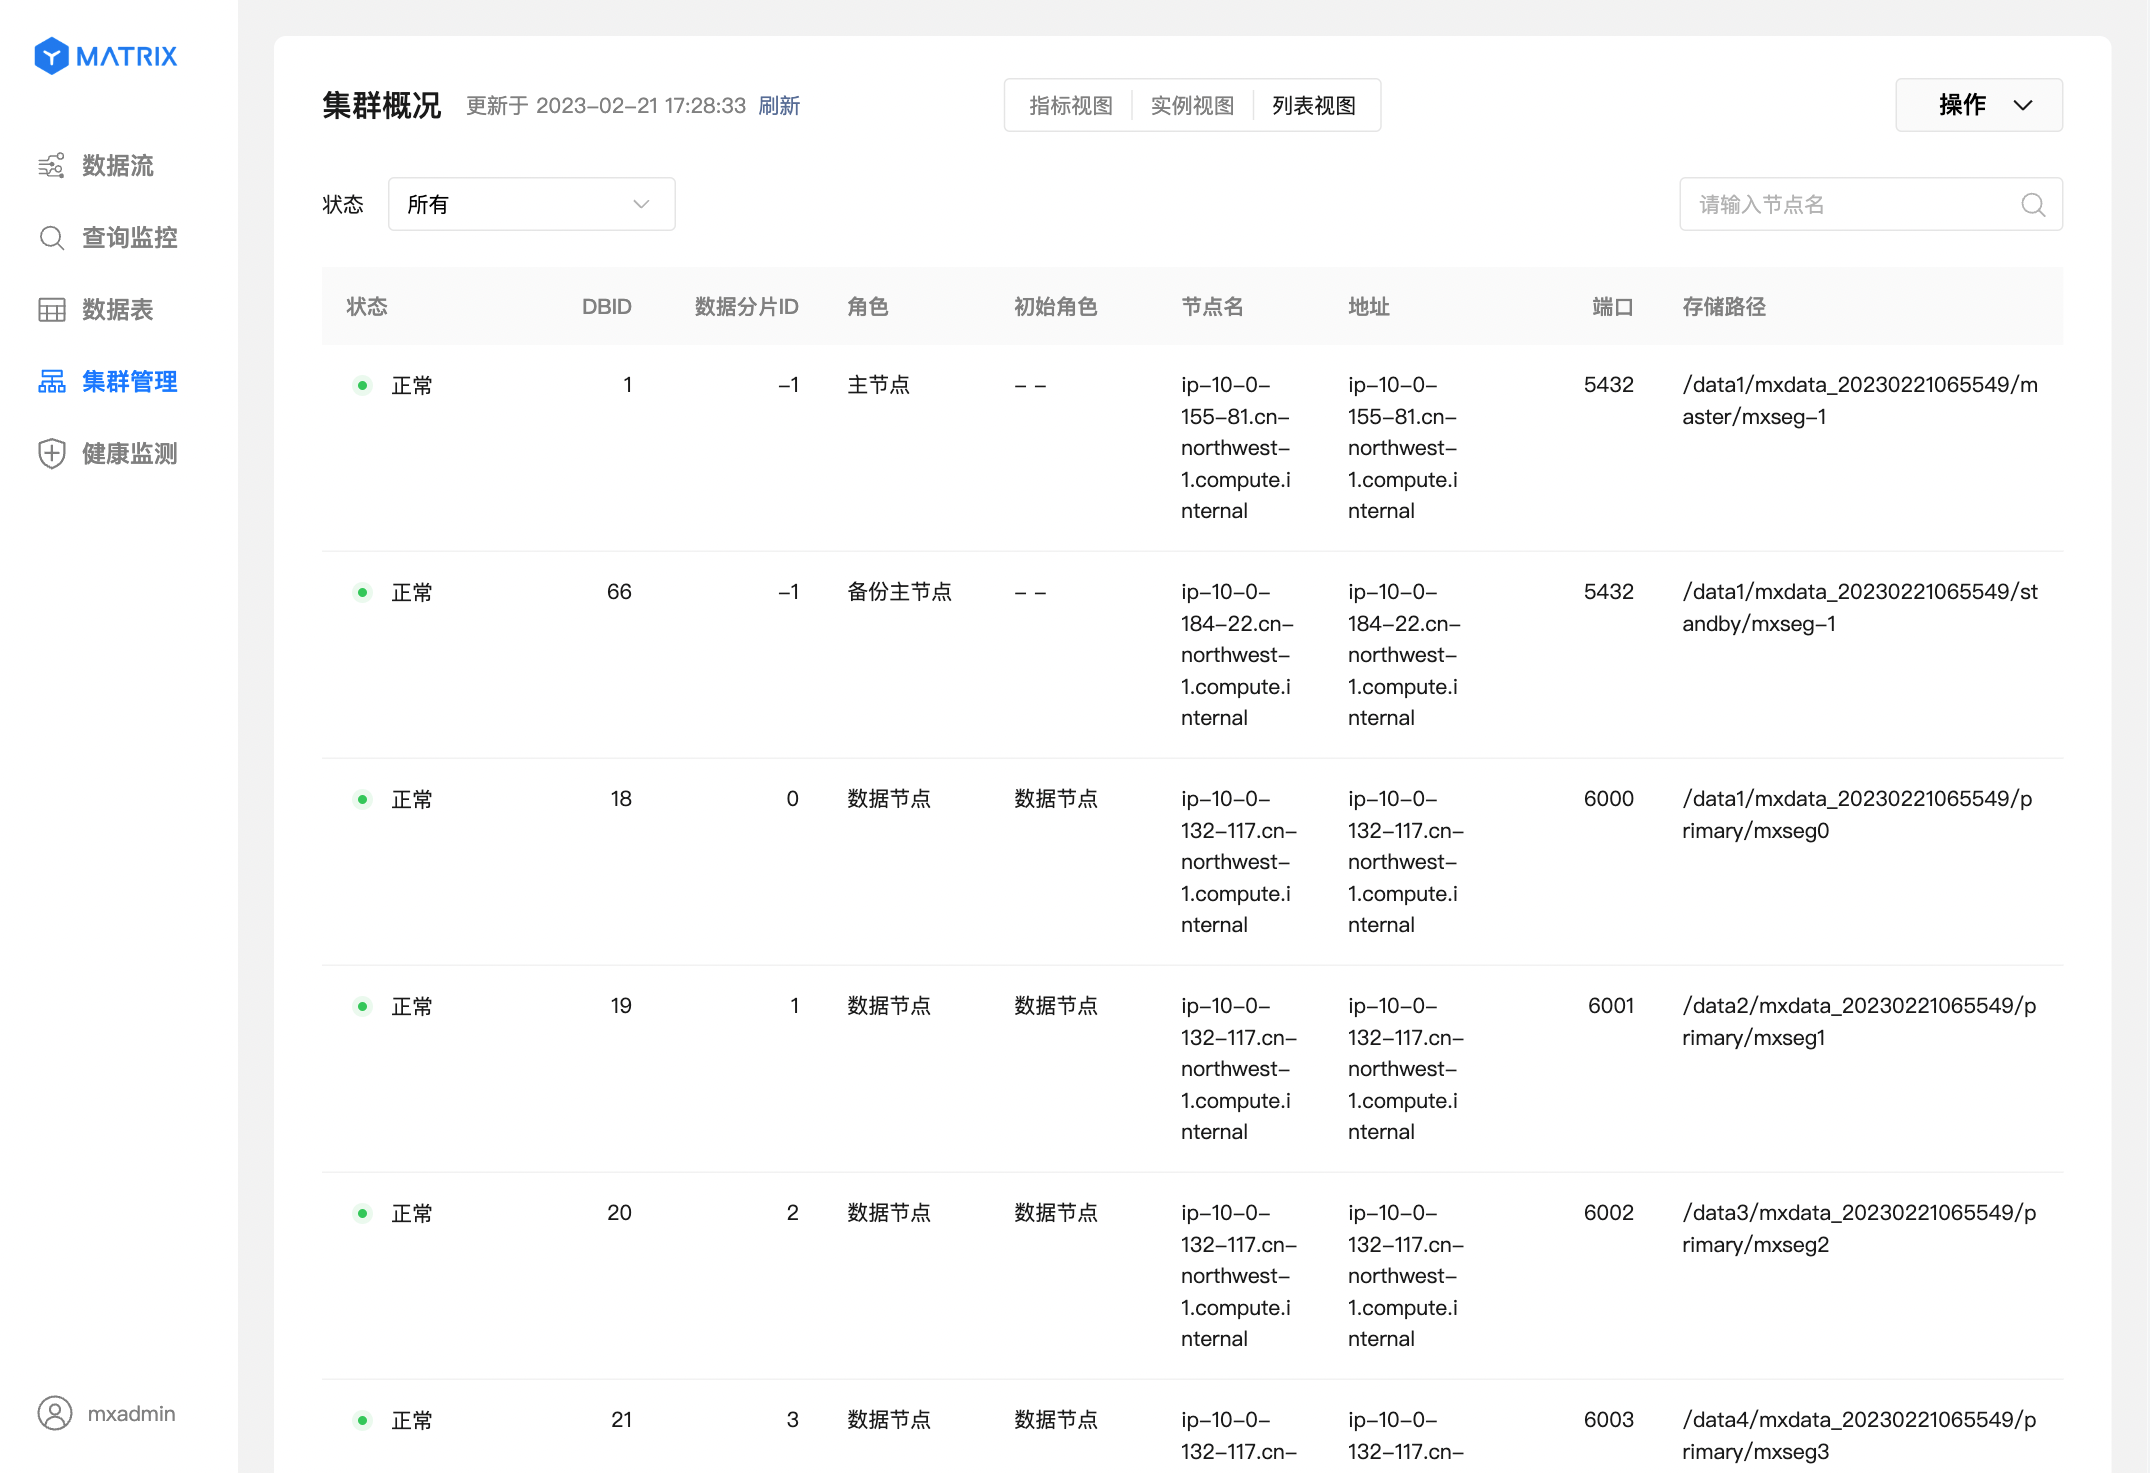
Switch to "List View", and displays the information of each node in the list form such as the status of the instance, DBID, port, storage path, etc.
Click the "Data Table" option on the left to enter the data table page, and you can see all databases:
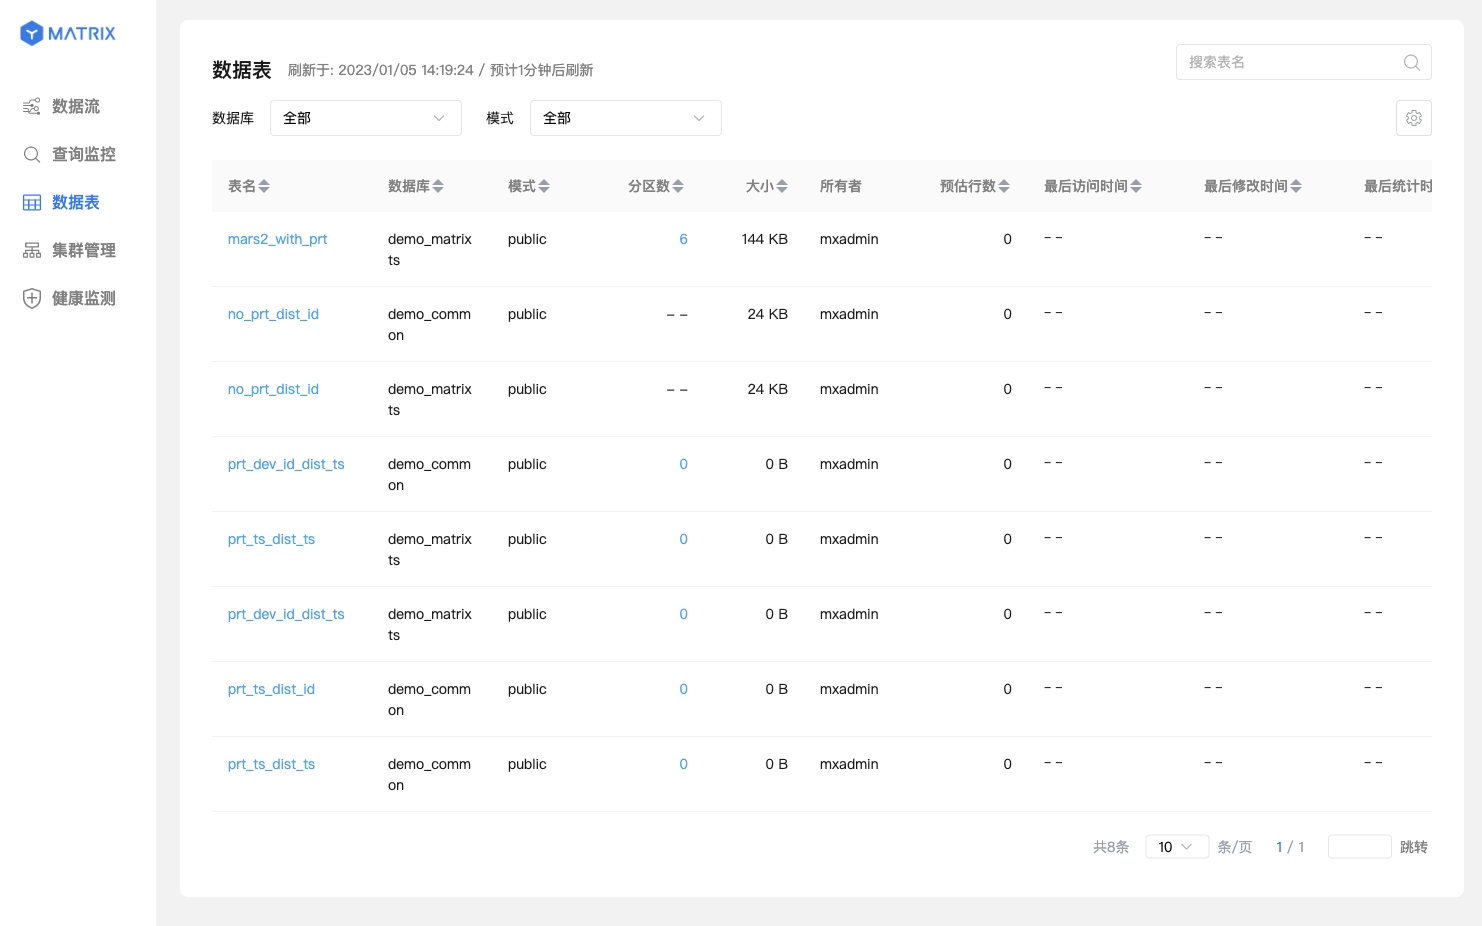
You can also refer to selecting a database in the database list:
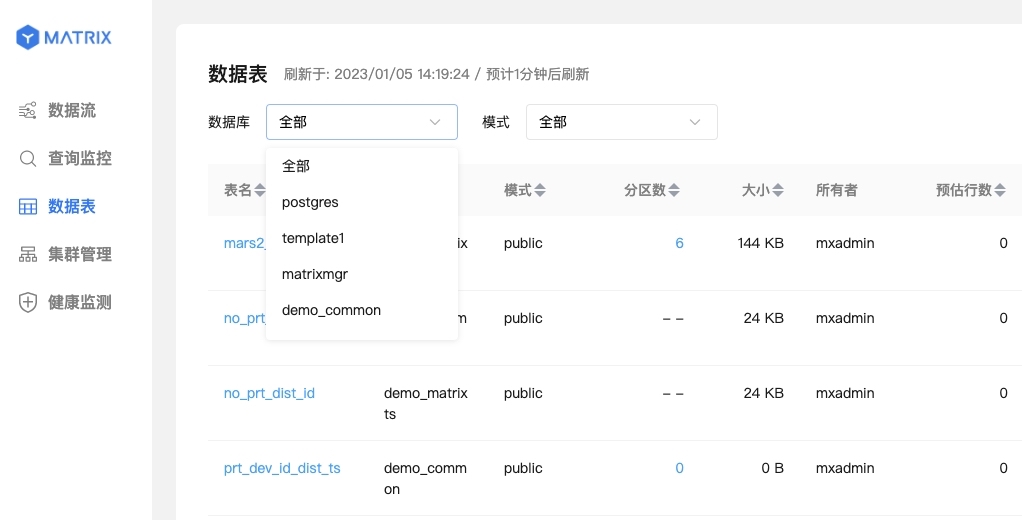
You can see a list of statistical information for all tables in the library, including table names, database names, schemas, partition counts, sizes, owners, estimated row counts, last access time, last modification time, and last statistical time.
Click on a specific table and you will enter the table's details page. The detailed information page is divided into two parts: basic information and structural information.
The basic information is basically the same as the content on the list page, and the lower part is the statistical information:
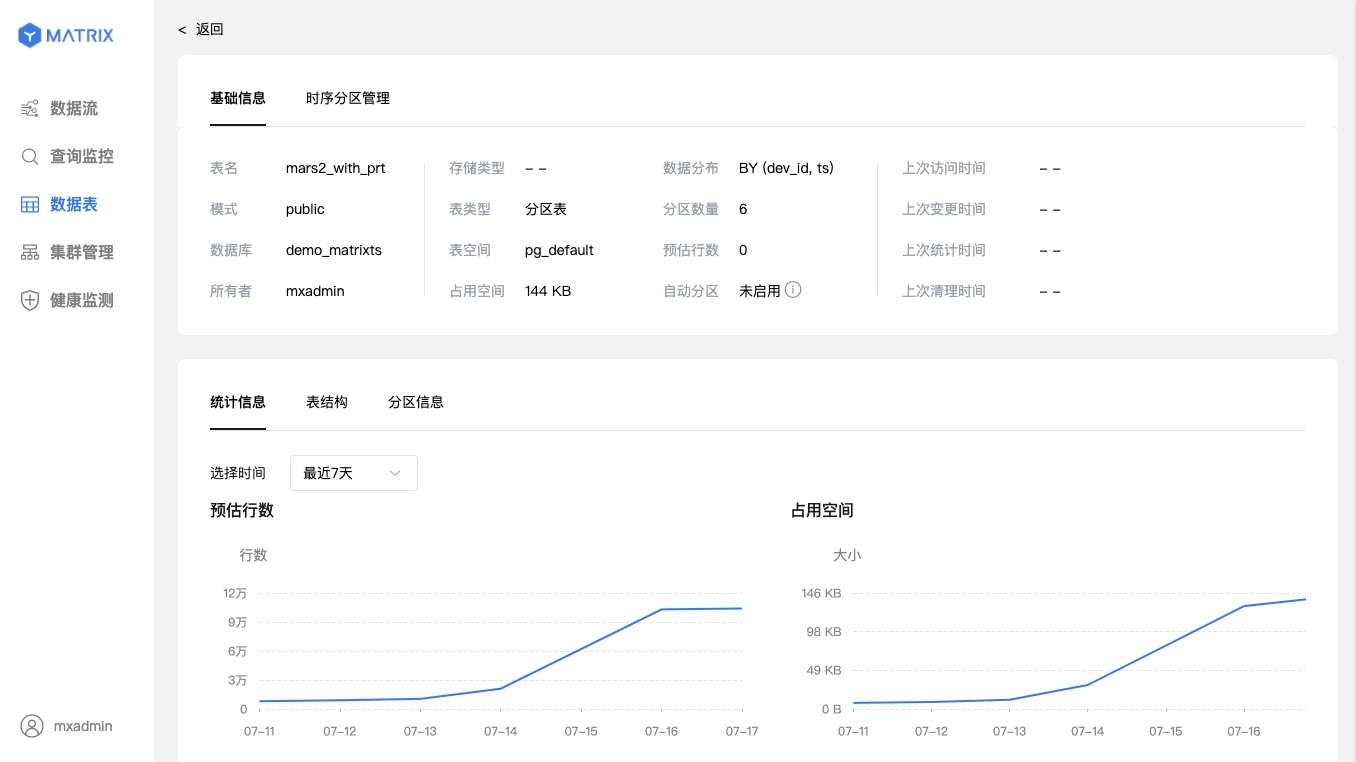
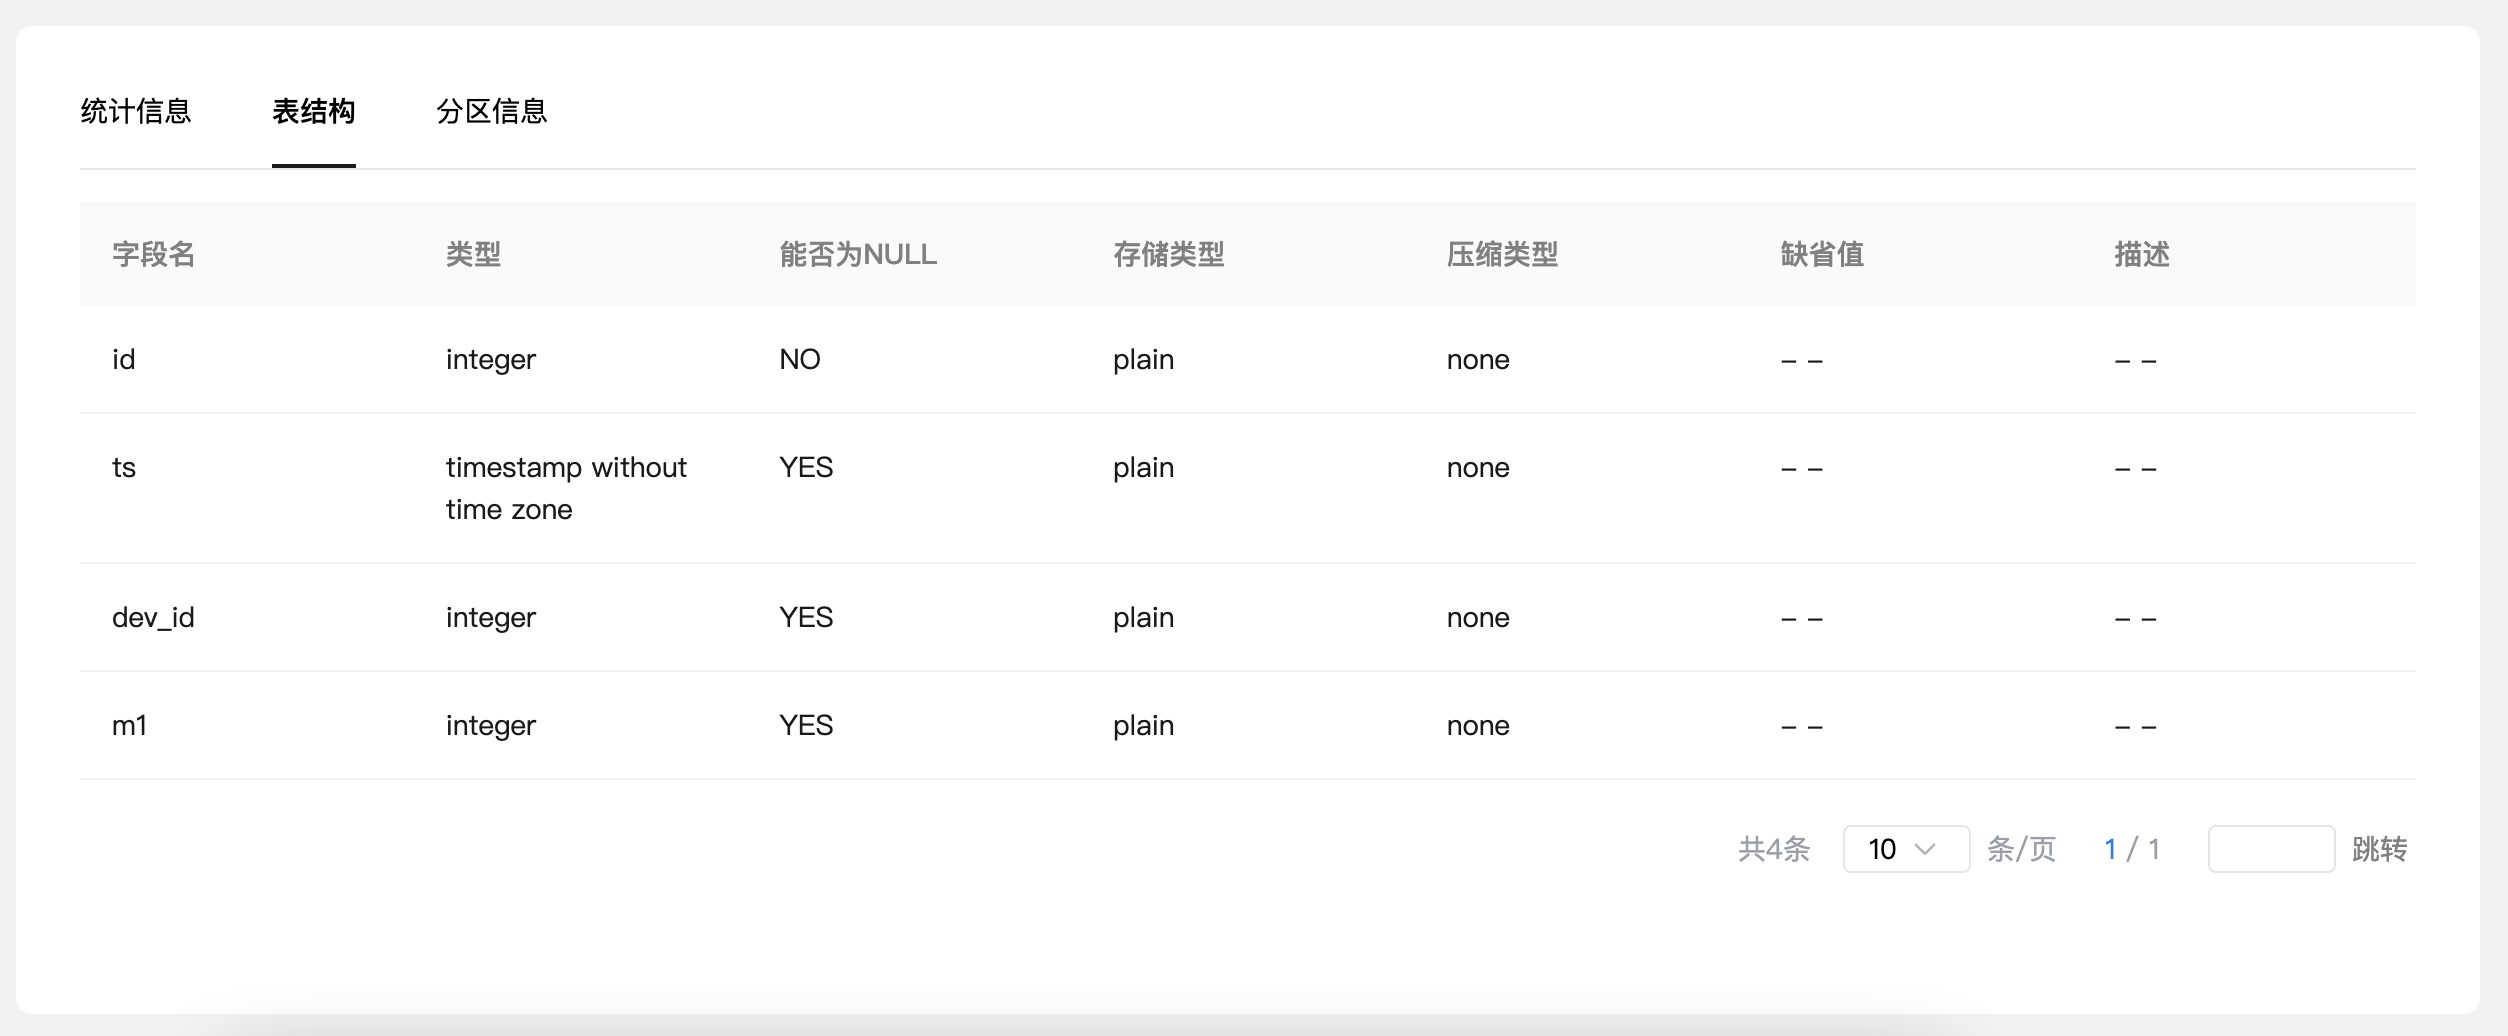
Table structure:
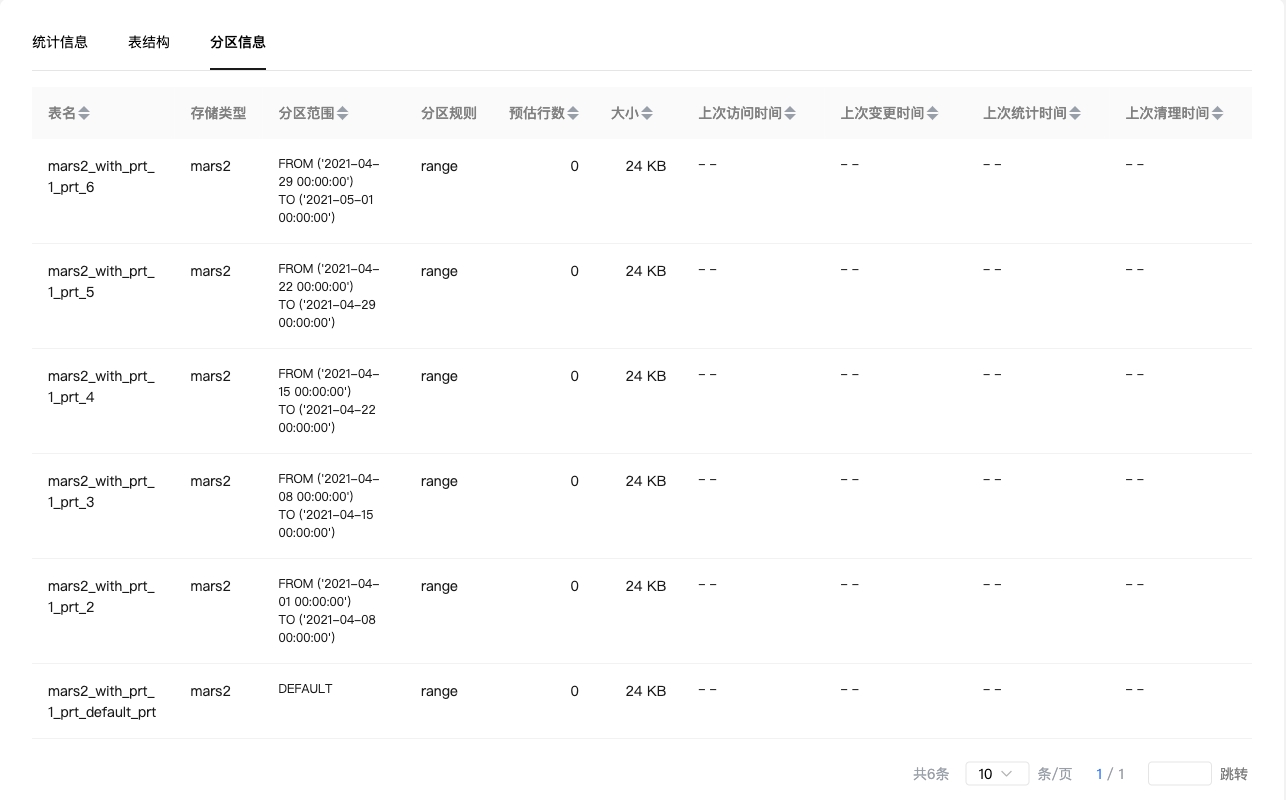
For the partition table, you can see the specific information of each partition:
 You can have a detailed understanding of the data table information through the above two pages to manage and operate the cluster.