Grafana's alerting feature detects whether monitored metrics meet defined threshold conditions, based on configured monitoring rules. It helps notify users and facilitates timely identification and resolution of issues, ensuring your cluster remains secure and stable.
This section describes how to configure and manage alerting components. YMatrix supports alerting for the following metrics:
Four alert notification methods are available. You may choose one or combine multiple methods as needed:
To use alerting, you must first deploy and enable monitoring. For detailed steps, see: Monitor Deployment
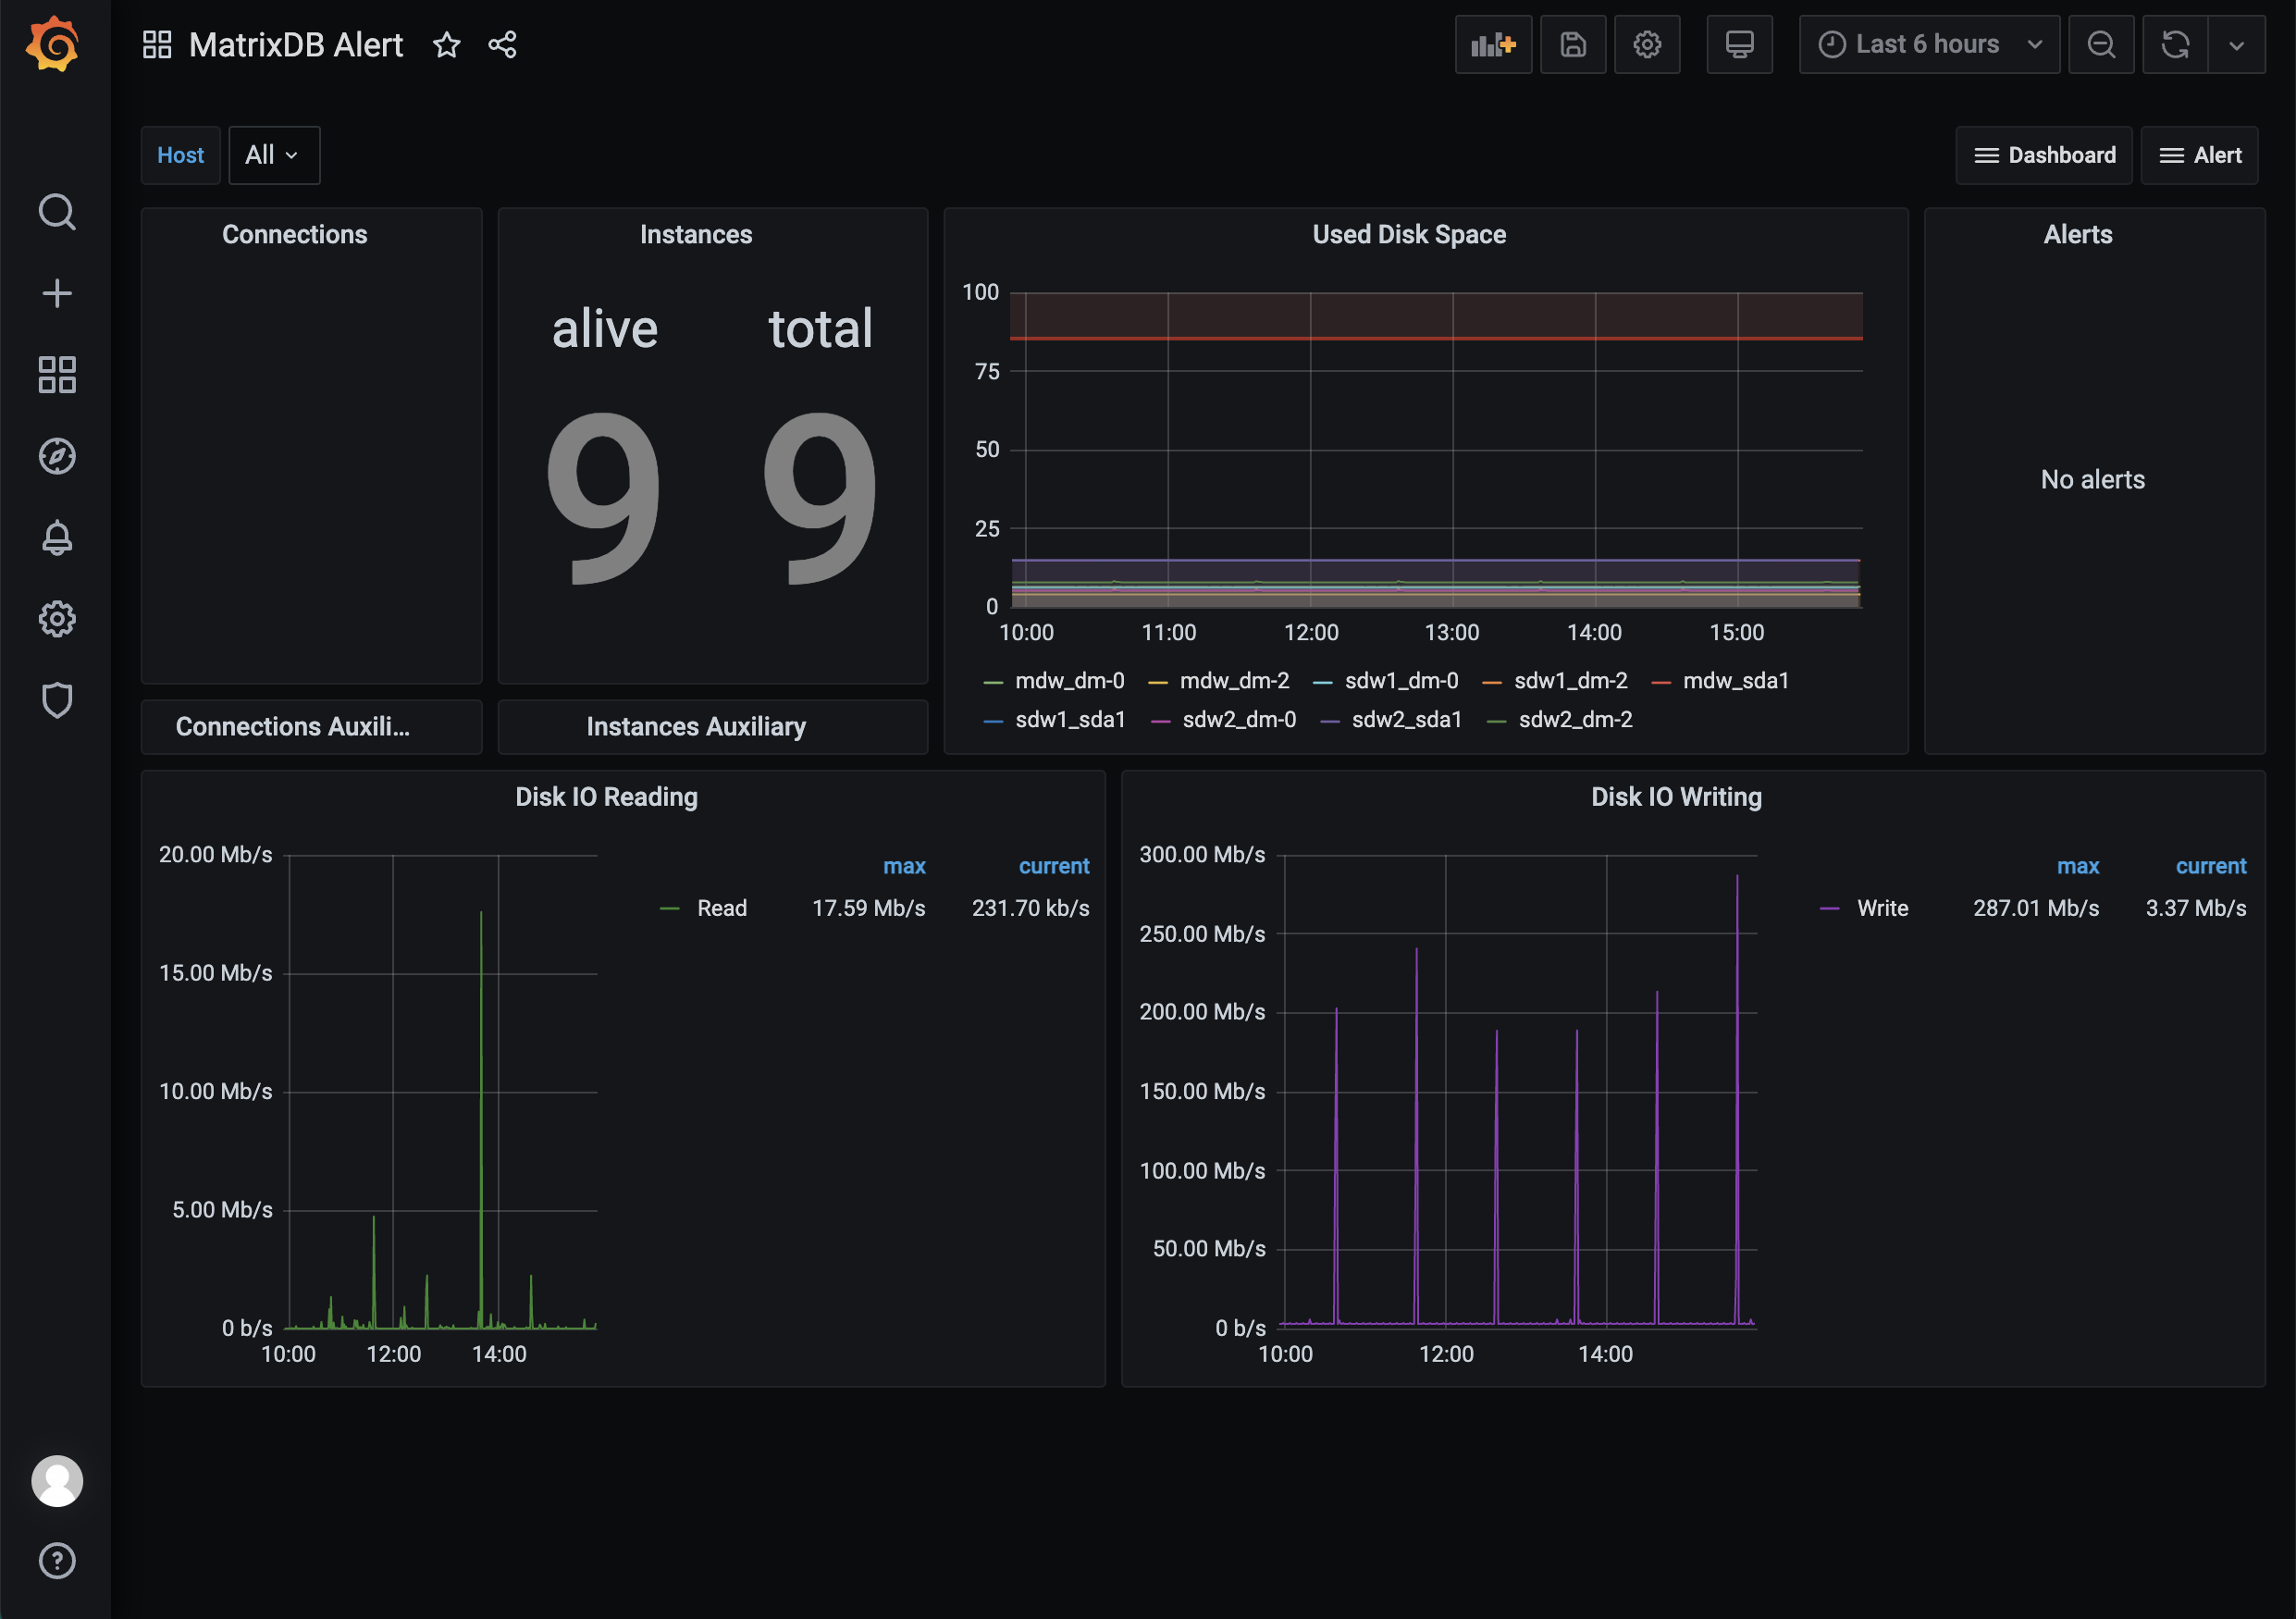
After deployment, you will see an interface similar to the following:
Before importing predefined alert dashboards, you must copy the alert.json file from the server to your local machine. Similar to importing dashboard.json and database.json in Grafana, the process involves locating the file on the server, copying it, and uploading it locally. Follow these steps:
Log in to the server and switch to the mxadmin user. Locate the alert.json file at the path shown in the image. You can use the cd command, find command, or any other method you prefer.
[mxadmin@mdw ~]$ cd /opt/ymatrix/matrixdb5/share/doc/postgresql/extension

##or

[mxadmin@mdw ~]$ find /opt/ymatrix/matrixdb5/share/doc/postgresql/extension -name alert.json
Next, use the scp command to copy the file to your local machine. Permission issues may arise, so consider first copying the file to the shared /tmp/ directory, then transferring it from /tmp/ to your local system.
Note!
When copying from/tmp/, ensure you switch users appropriately to avoid permission issues.
[mxadmin@mdw]$ scp mxadmin@<server IP address>:/opt/ymatrix/matrixdb5/share/doc/postgresql/extension/"alert.json" mxadmin@<server IP address>:/tmp/

~ scp waq@<server IP address>:/tmp/"alert.json" /Users/akkepler/workplace/Grafana
Finally, open your local folder or use a command-line tool to verify the file was copied successfully. After confirmation, batch-replace all instances of the variable $host in the local alert.json file with actual hostnames. For example, if your cluster consists of a master and two segments named mdw, sdw1, and sdw2, replace every $host with 'mdw', 'sdw1', 'sdw2'. Once modified, import the file into the Grafana interface.
Note!
Thedashboard.jsonanddatabase.jsonfiles uploaded to your Grafana interface must also have their variables modified, and they must be imported beforealert.json. Indashboard.json, replace all${cluster}withlocaland$hostwith actual hostnames. Indatabase.json, only replace${cluster}withlocal.
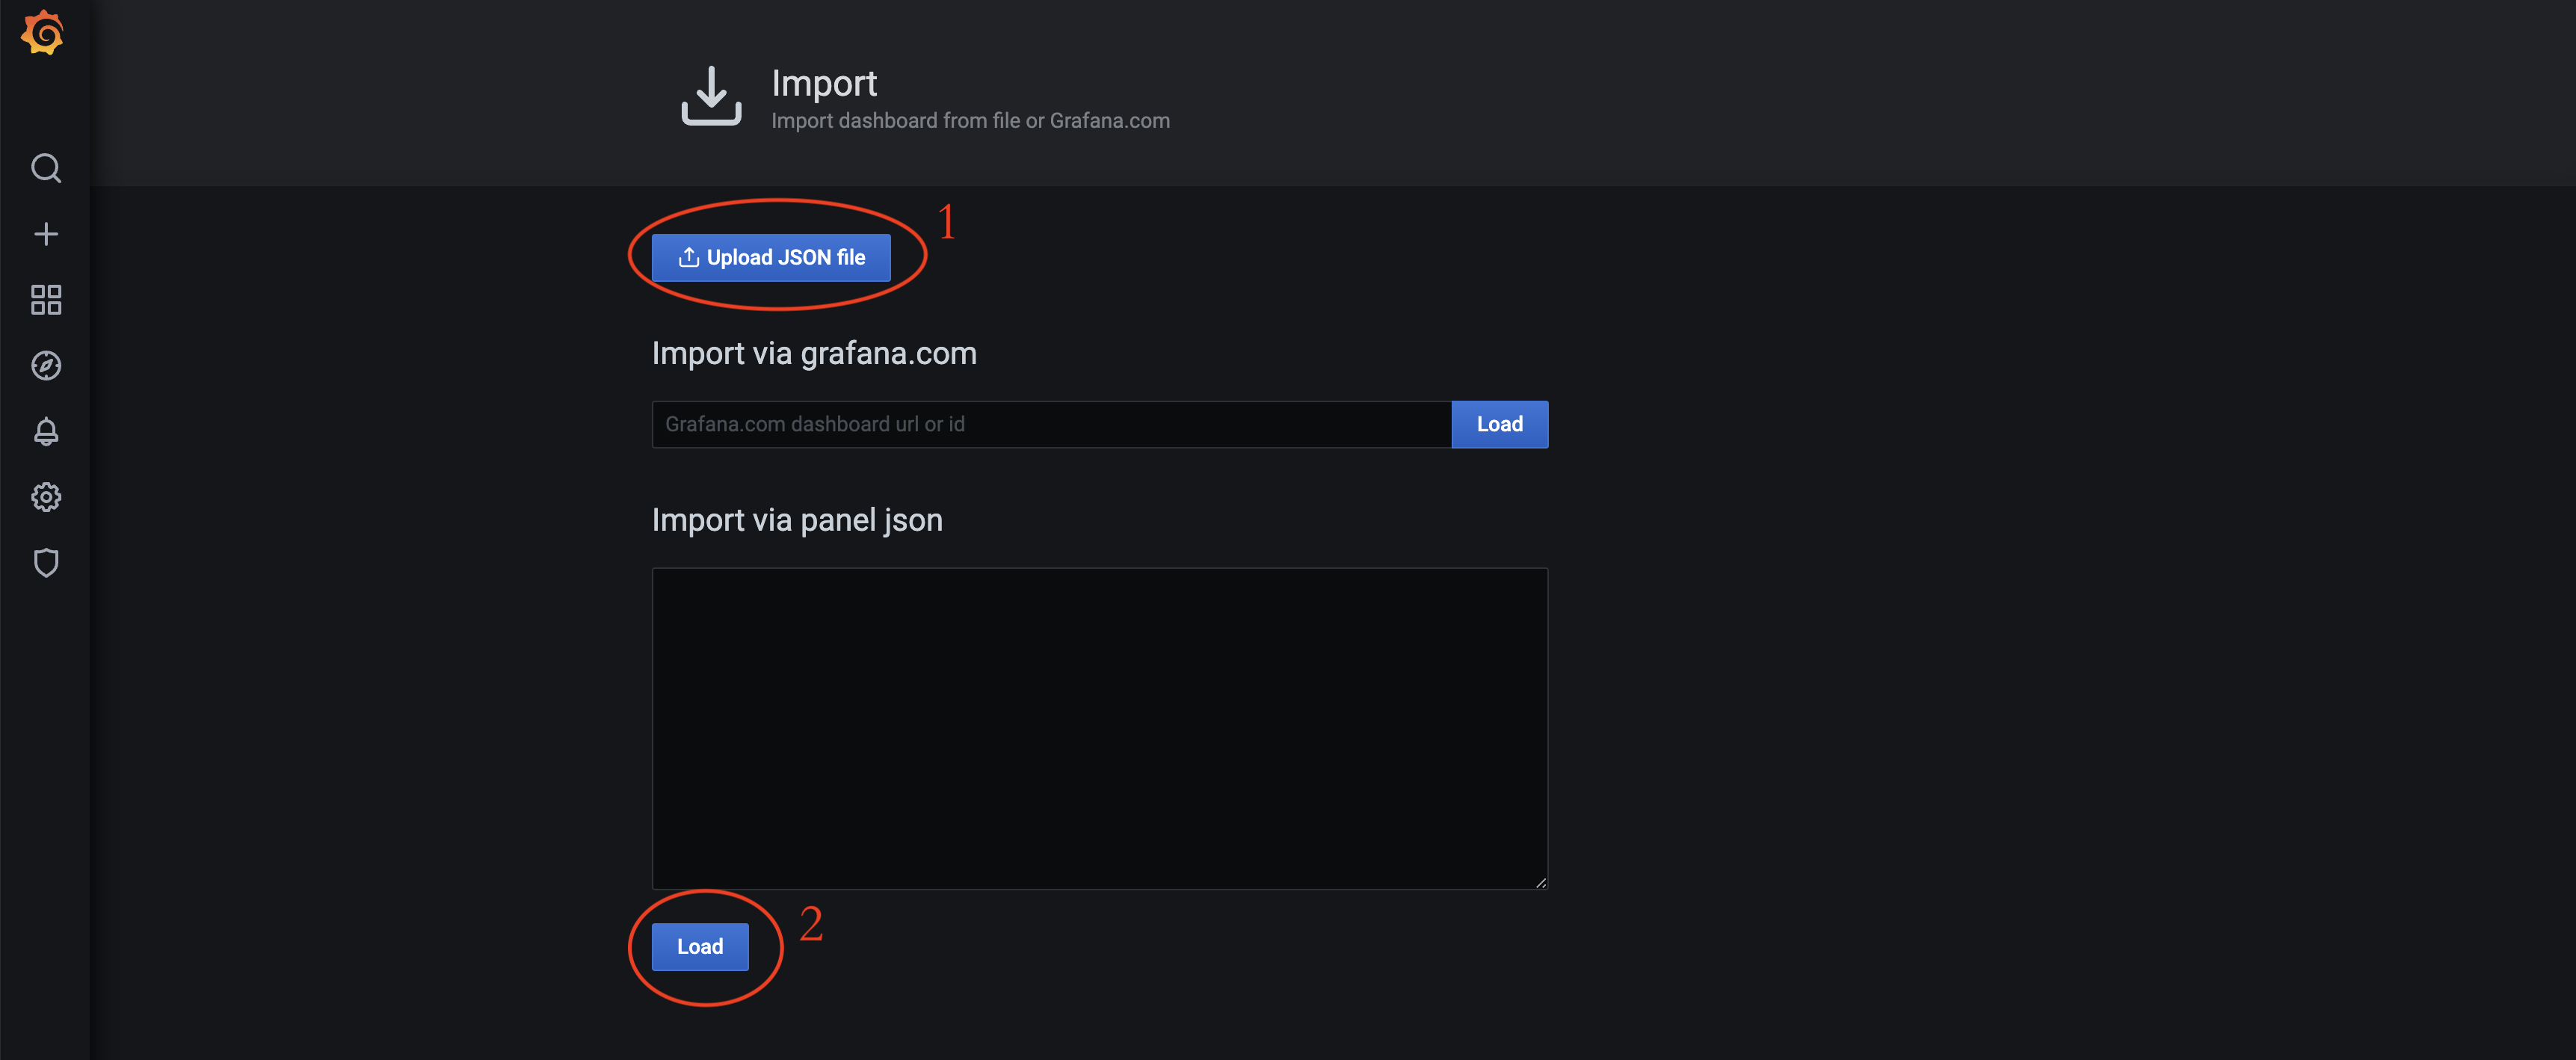
Select the alert.json file located at /opt/ymatrix/matrixdb5/share/doc/postgresql/extension.
The alert dashboard functions the same as the monitoring dashboard. You can switch between them using the dropdown menu located in the upper-right corner of each panel.
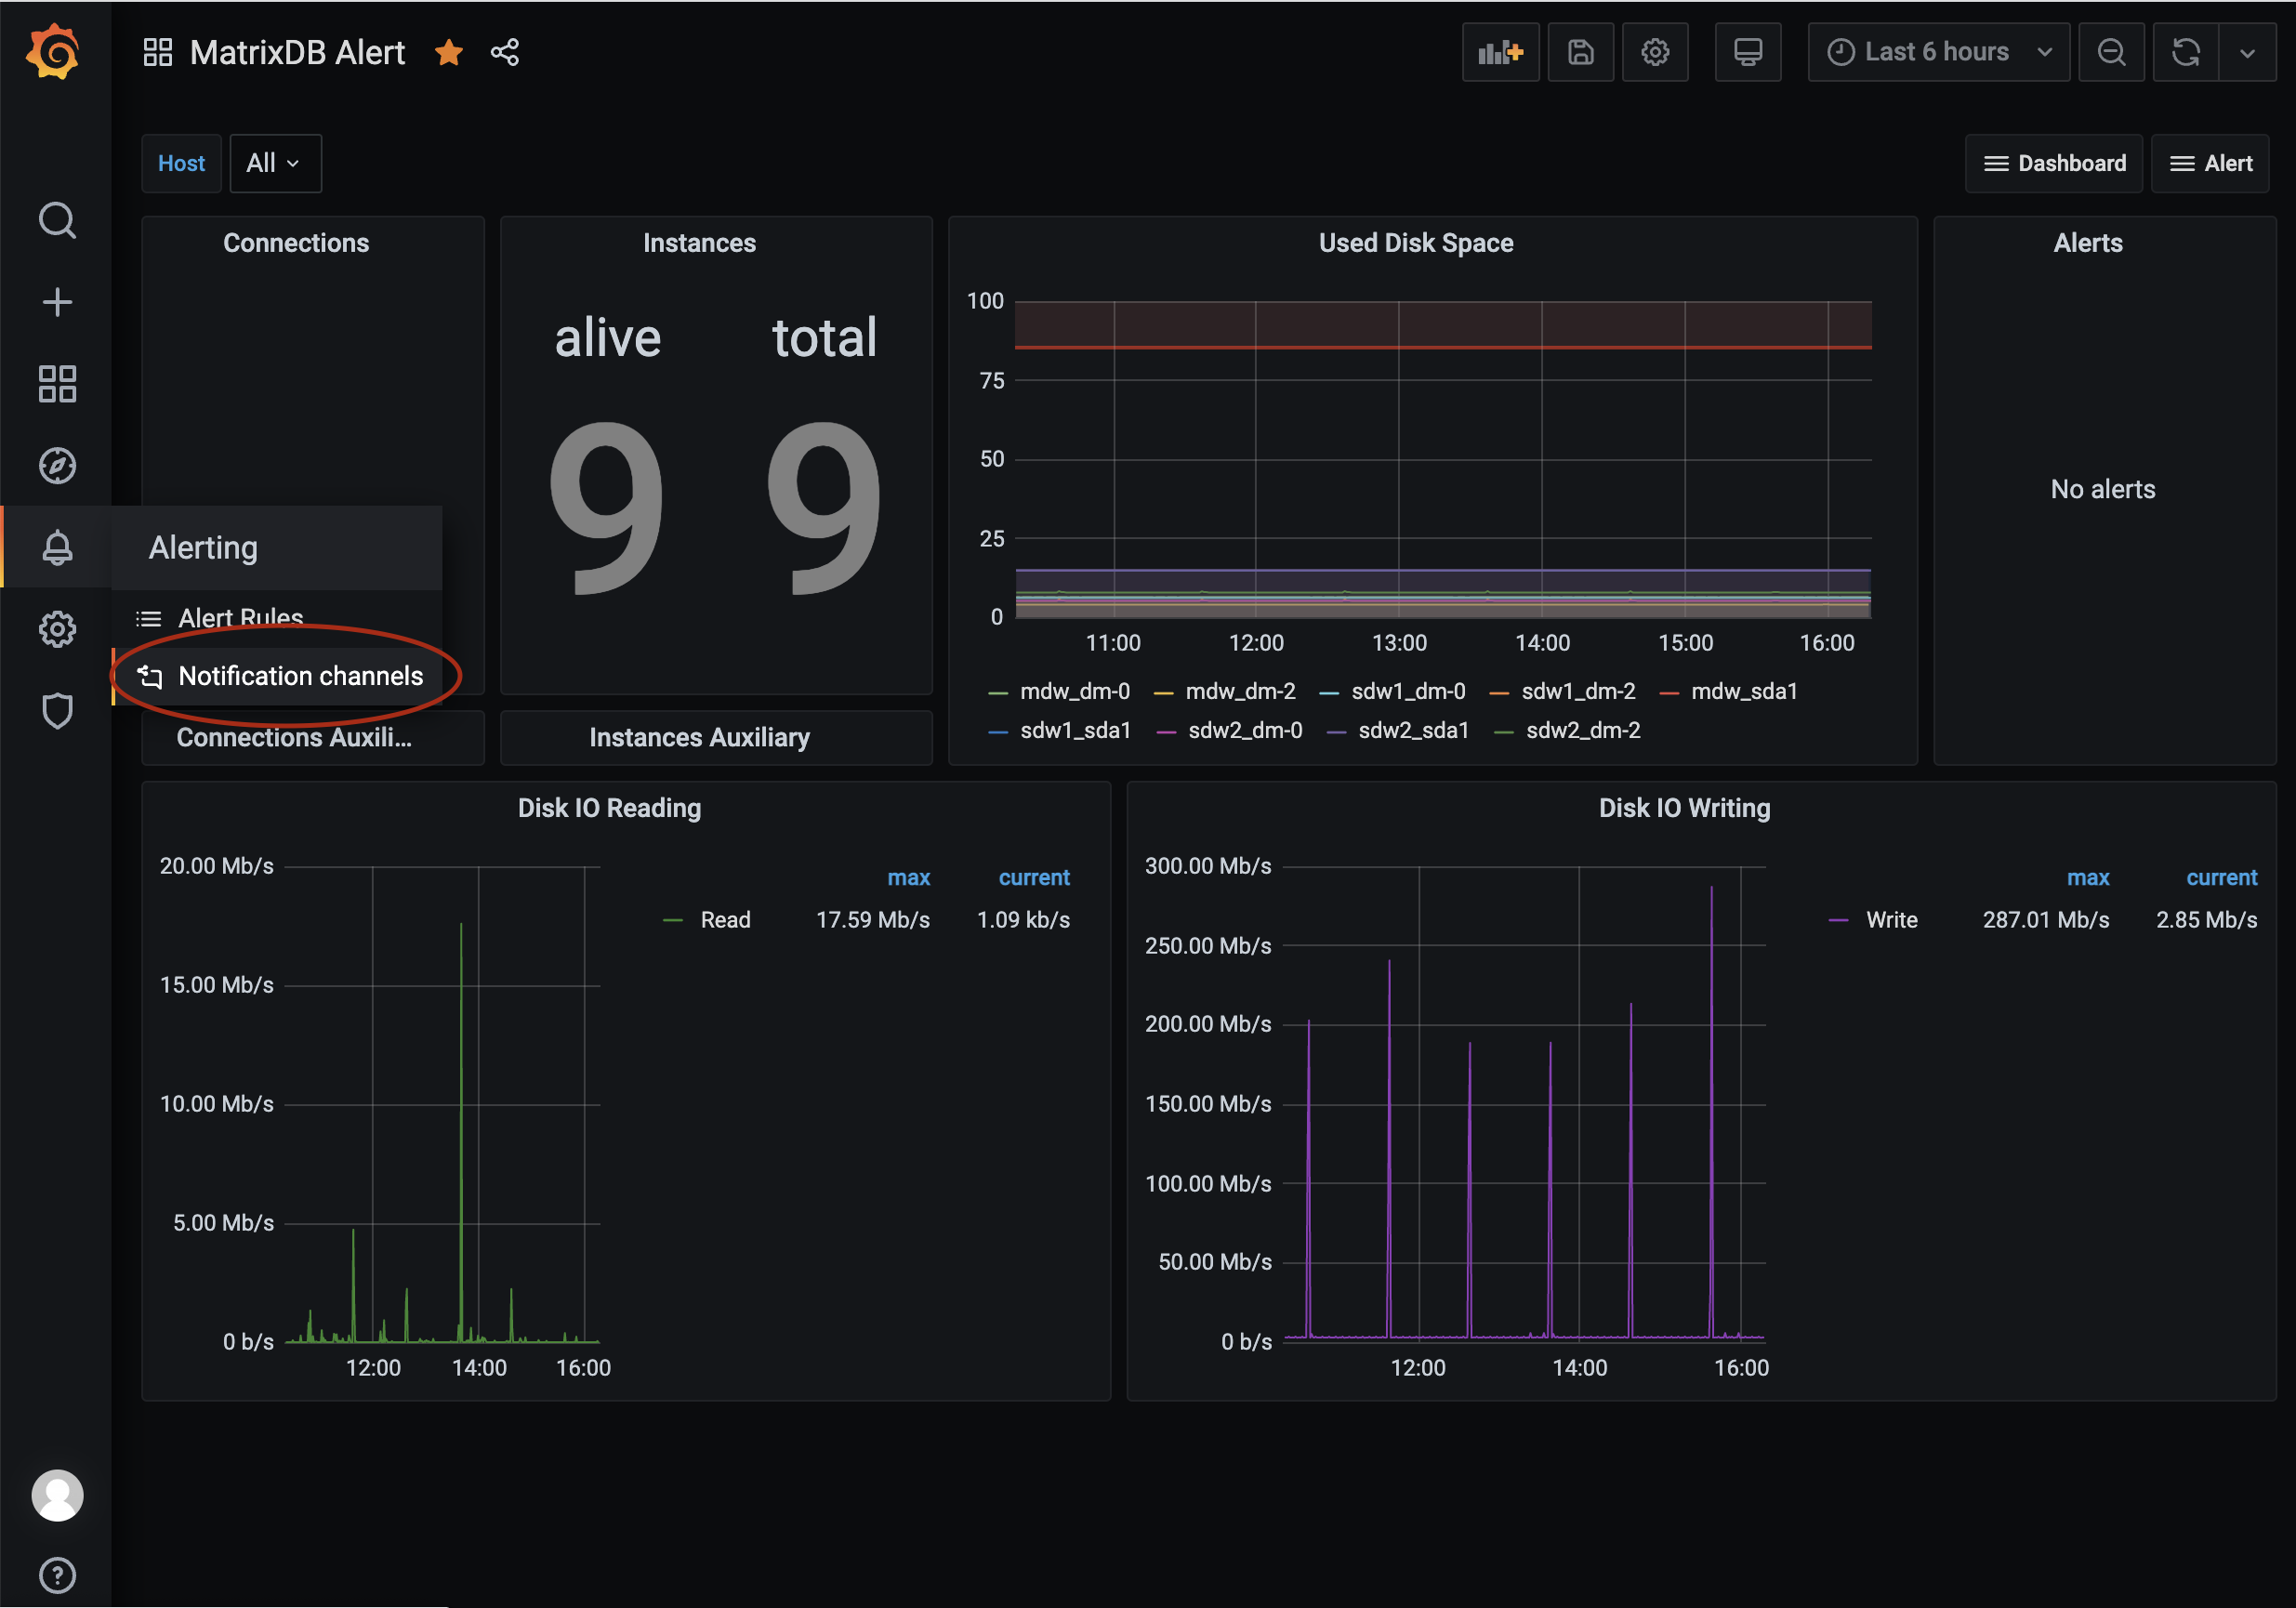
First, configure notification channels. Access the configuration page as shown:
YMatrix provides built-in SMS alerting via Alibaba Cloud SMS service, which is recommended. When an alert is triggered, SMS messages are sent to configured phone numbers. Bulk sending is supported. Before use, apply for and configure Alibaba Cloud SMS service. For details, refer to:
Alibaba Cloud Documentation: Quick Start for Domestic SMS
Alternatively, you can implement custom SMS alerts using Webhooks. This requires programming the Webhook logic. For more information, see Grafana Alert Documentation: Webhook Notifications
Create an alert.yaml file under /etc/matrixdb/:
# aliyun service config
aliyun_service:
  access_key_id: "your access_key_id"
  access_key_secret: " access_key_secret"
  signature: "signature"
  sms_template_code: "SMS_123445678"
Here:
access_key_id and access_key_secret: Provided by Alibaba Cloud after service activation.signature: The approved signature text registered in the Alibaba Cloud SMS console.sms_template_code: Template ID starting with "SMS_", registered and approved in the Alibaba Cloud SMS console.${name}.Example template:
Dear administrator, your database system has triggered a ${name} alert. Please log in to view details and take action promptly.As shown in the image:

Name the channel following this convention:
Aliyun Batch Short Message - For SuperAdministrators
"SuperAdministrators" represents a group of recipients. To define another group, create a separate rule. Note that the phoneNumbers parameter is case-sensitive. Multiple numbers can be specified, separated by commas:
http://
: /api/alert/batch-sms?phoneNumbers=18311111111,13811111111
In addition to SMS, YMatrix supports voice call alerts via Alibaba Cloud's voice service. When triggered, calls are made to configured numbers. Bulk calling is supported. Before use, apply for and configure Alibaba Cloud Voice Service. For details, see: Alibaba Cloud Documentation: Quick Start for Domestic Voice Service
Custom voice alerts via Webhook are possible but require custom logic implementation. Refer to Grafana Alert Documentation: Webhook Notifications for details.
Add tts_template_code and region_id to the alert.yaml file under /etc/matrixdb/:
# aliyun service config
aliyun_service:
  access_key_id: "your access_key_id"
  access_key_secret: " access_key_secret"
  signature: "signature"
  sms_template_code: "SMS_123445678"
  tts_template_code: "TTS_123456788"
  region_id: "cn-hangzhou"
access_key_id and access_key_secret: Shared with SMS service.tts_template_code: TTS template ID starting with "TTS_", registered and approved in the Alibaba Cloud TTS console.${name}.Example:
Dear administrator, your database system has triggered a ${name} alert. Please log in to view details and take action promptly.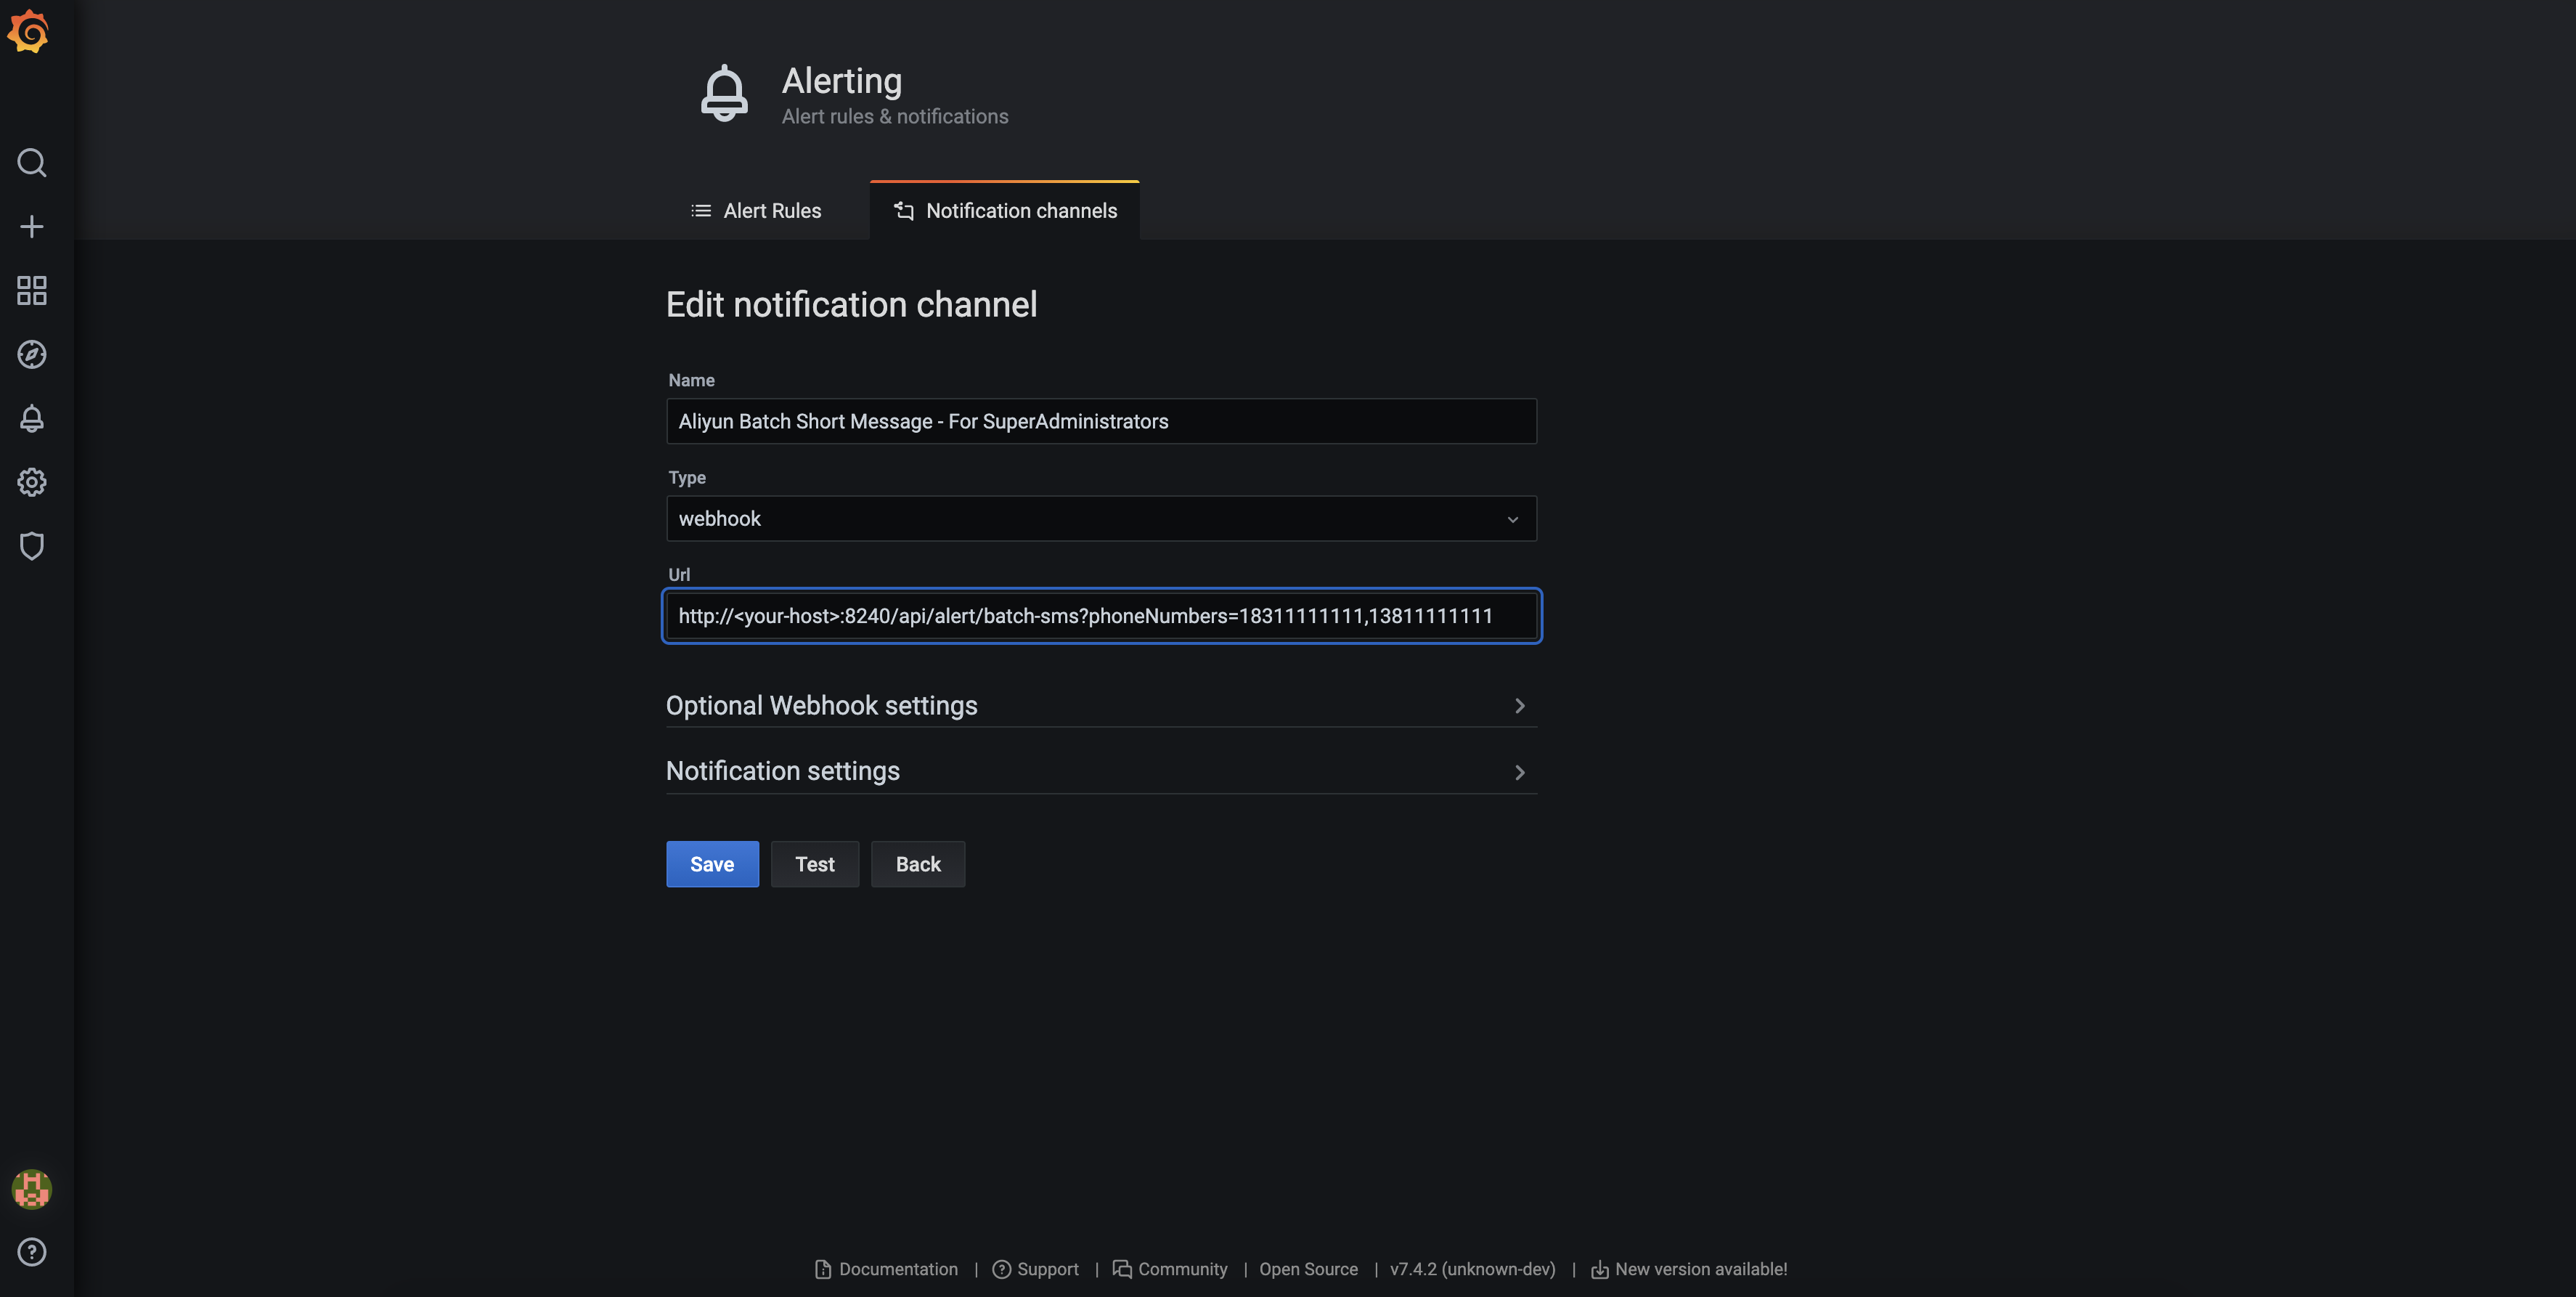
Use a channel name following this format:
Aliyun Voice Message - For SuperAdministrators
"SuperAdministrators" refers to the recipient group. Define additional rules for other groups. The phoneNumbers parameter is case-sensitive and supports multiple comma-separated numbers:
http://
: /api/alert/vms?phoneNumbers=18311111111,13811111111
Grafana includes built-in email alerting, which is simple to configure and use.
Email alerts use Grafana's native SMTP support. Configure the SMTP server in Grafana's main configuration file. The file location varies by deployment. On CentOS 7, the default path is:
/etc/grafana/grafana.ini
For more information, see: Grafana Official Documentation: Configuration
A sample configuration is provided below:
#################################### SMTP / Emailing #####################
[smtp]
enabled = true
host = <your smtp host>
user = <your user>
# If the password contains # or ; you have to wrap it with triple quotes. Ex """#password;"""
password = <your password>
;cert_file =
;key_file =
skip_verify = true
from_address = <your email address>
from_name = Grafana
;ehlo_identity =
;startTLS_policy =

[emails]
welcome_email_on_sign_up = false
templates_pattern = emails/*.htmlAs shown:
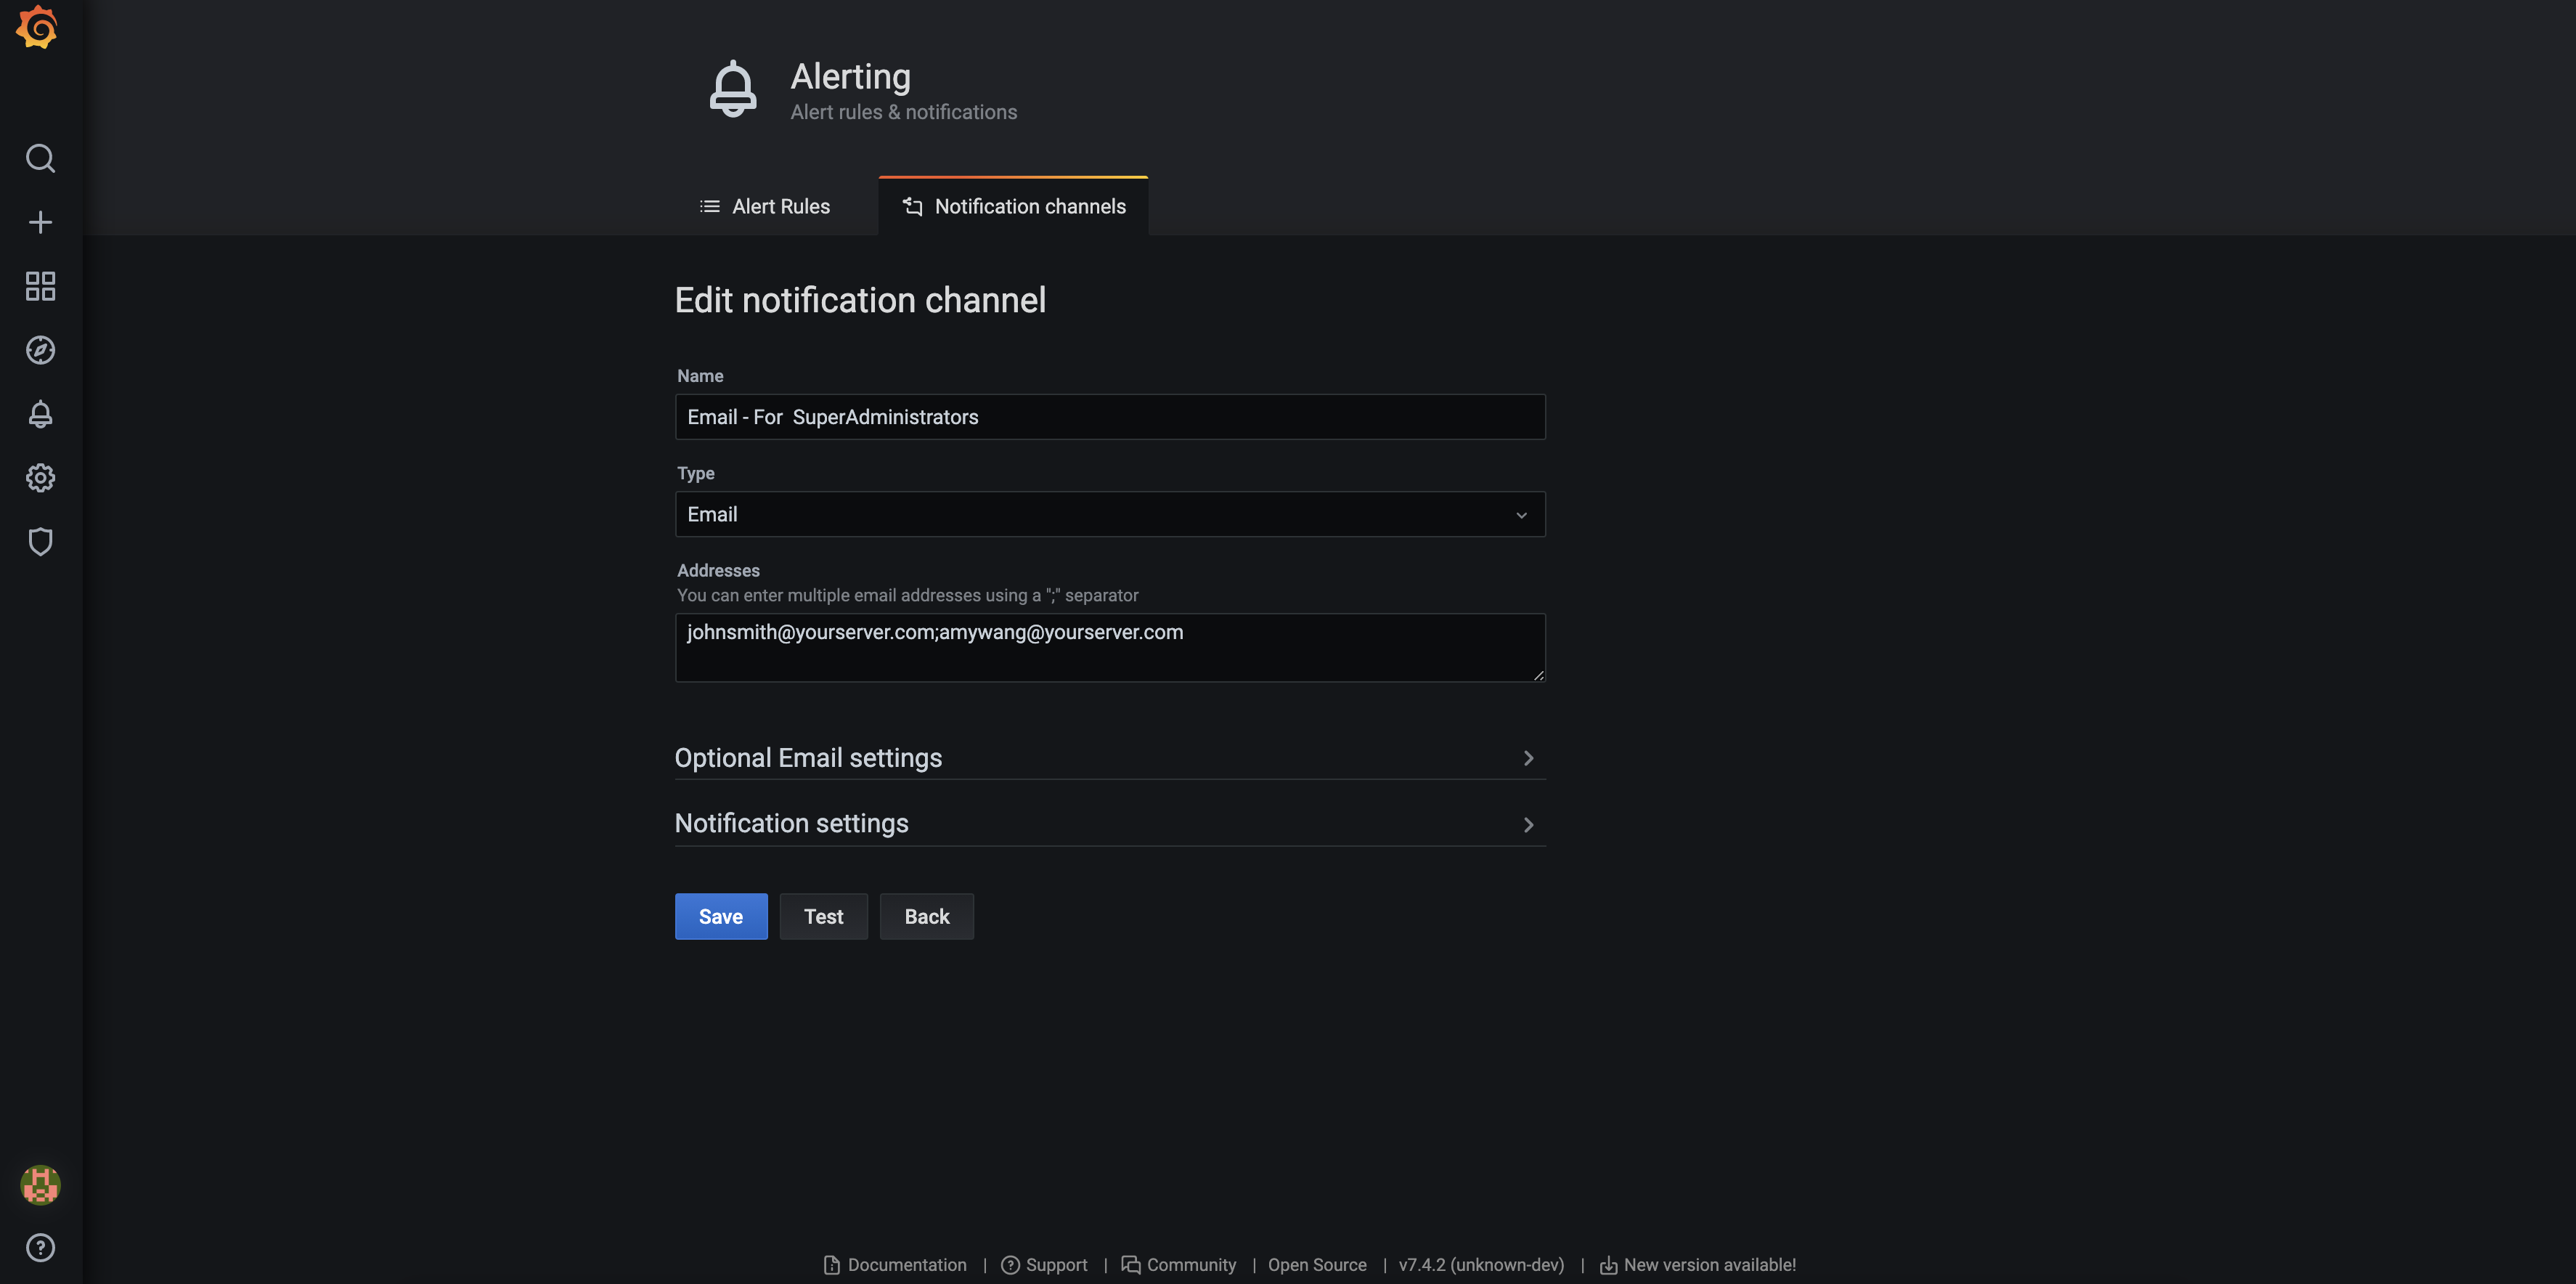
Name the channel as:
Email - For SuperAdministrators
"SuperAdministrators" represents the recipient group. Define additional rules for other groups.
Note!
If configuration fails, check/var/log/grafana/grafana.logfor error details.
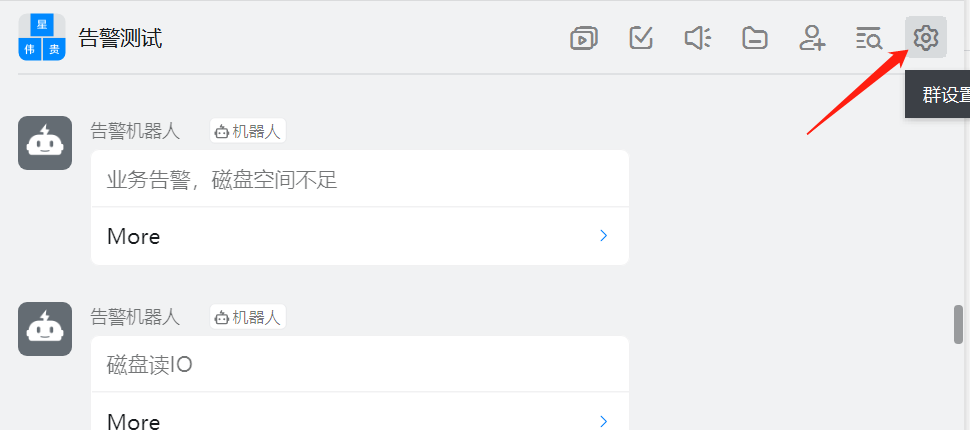
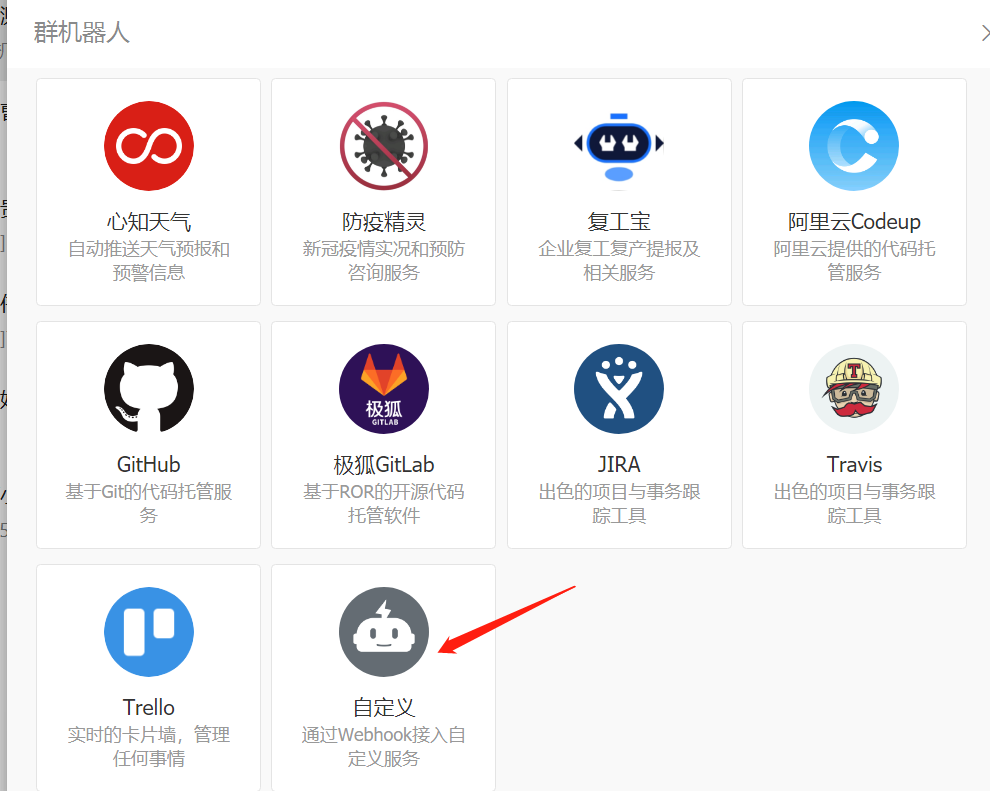
YMatrix supports DingTalk alerts. When triggered, a pre-configured DingTalk robot sends a message to the group. To use this feature, configure both DingTalk and Grafana.
As shown:
Create a DingTalk group and add one or more alert robots.

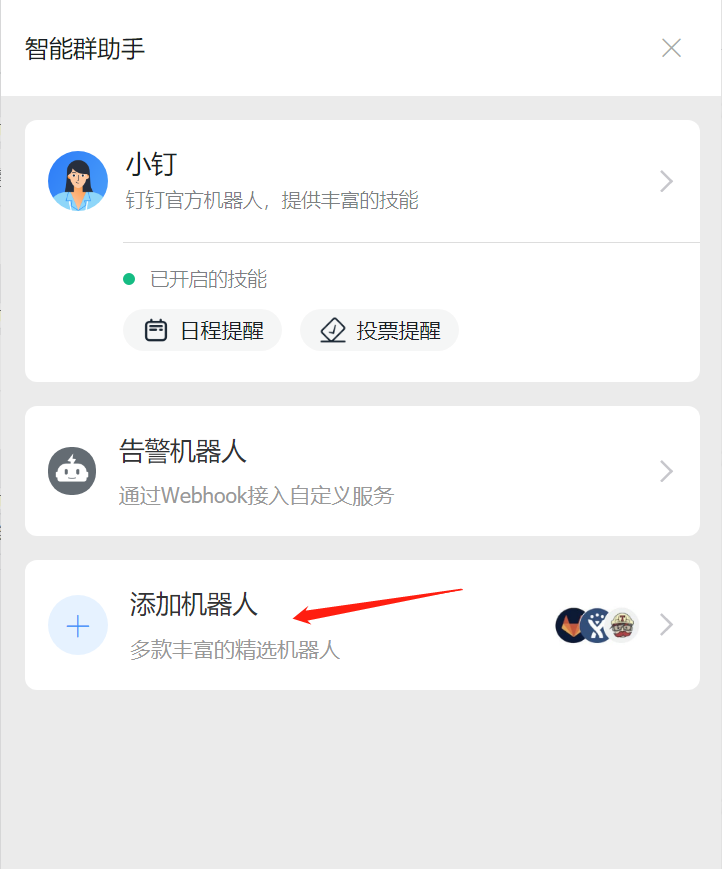
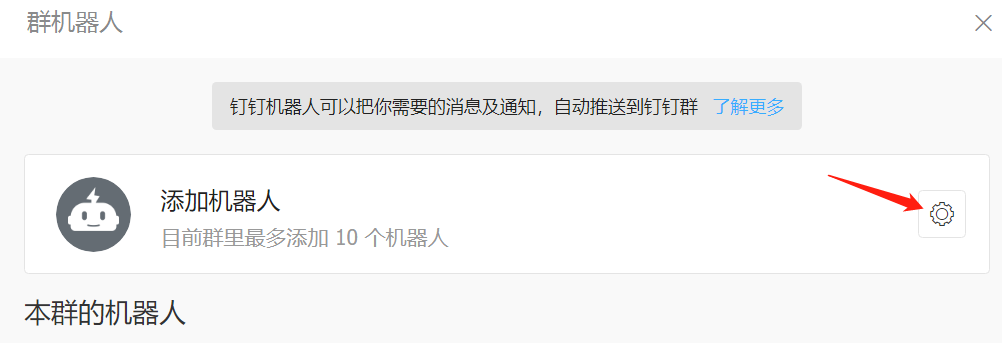
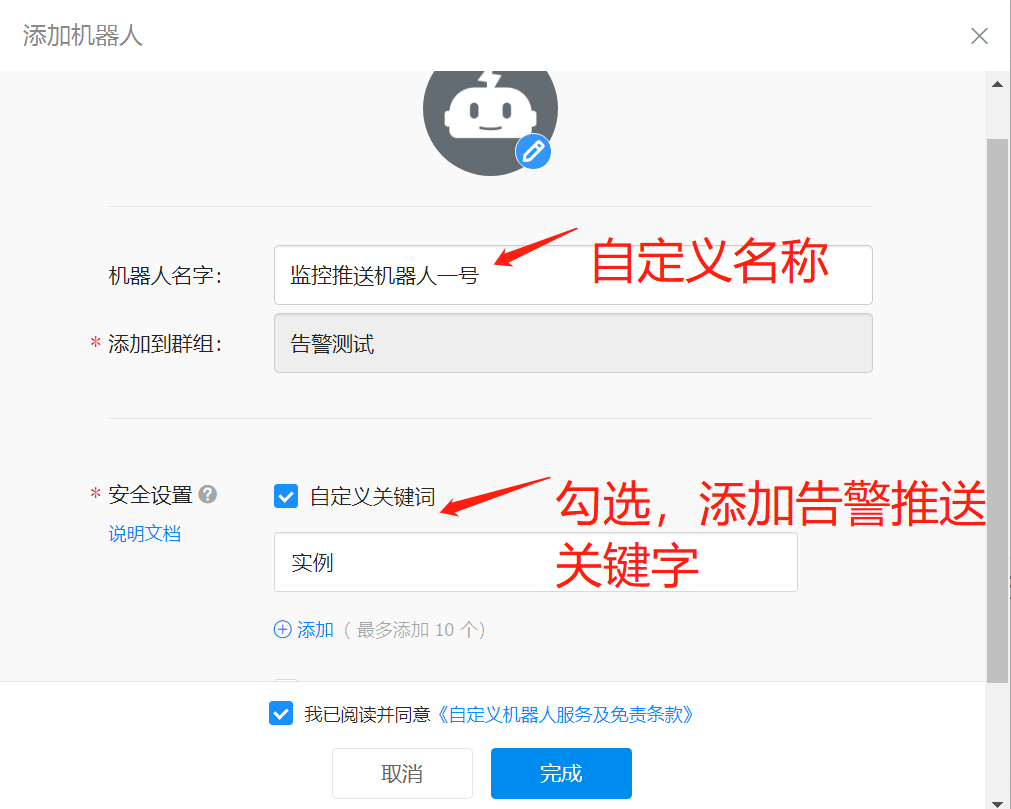
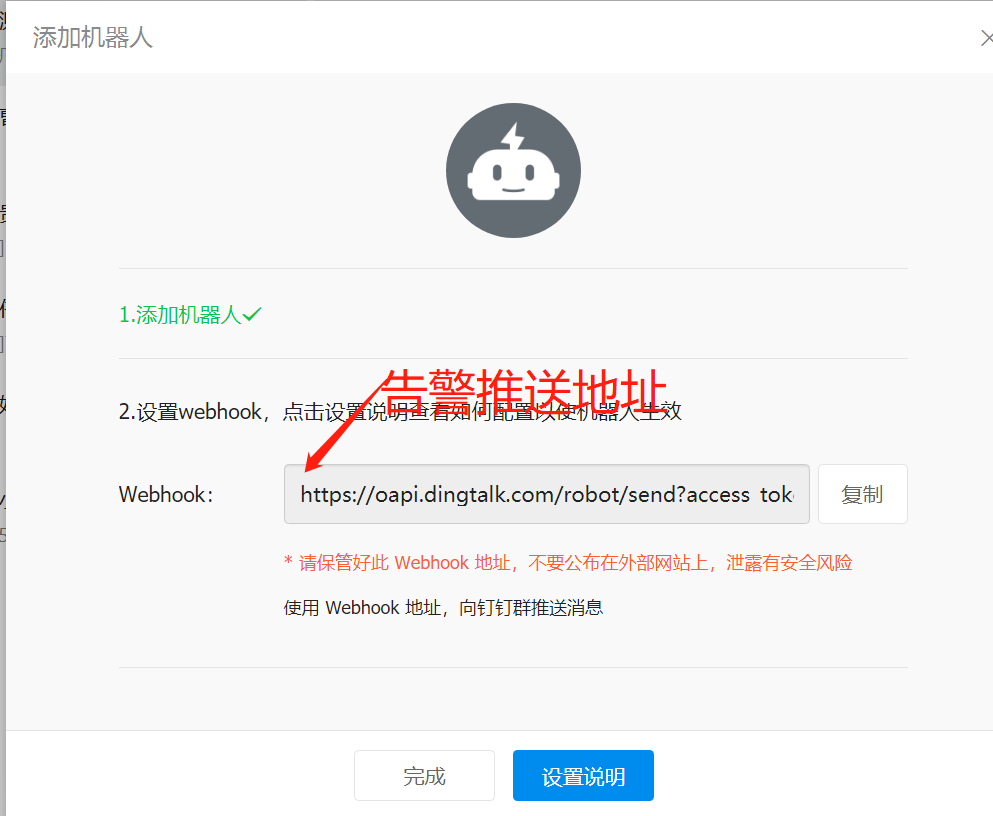
Click "Add Robot", then select "Custom". You can customize the robot name, set alert keywords, and save the webhook URL.
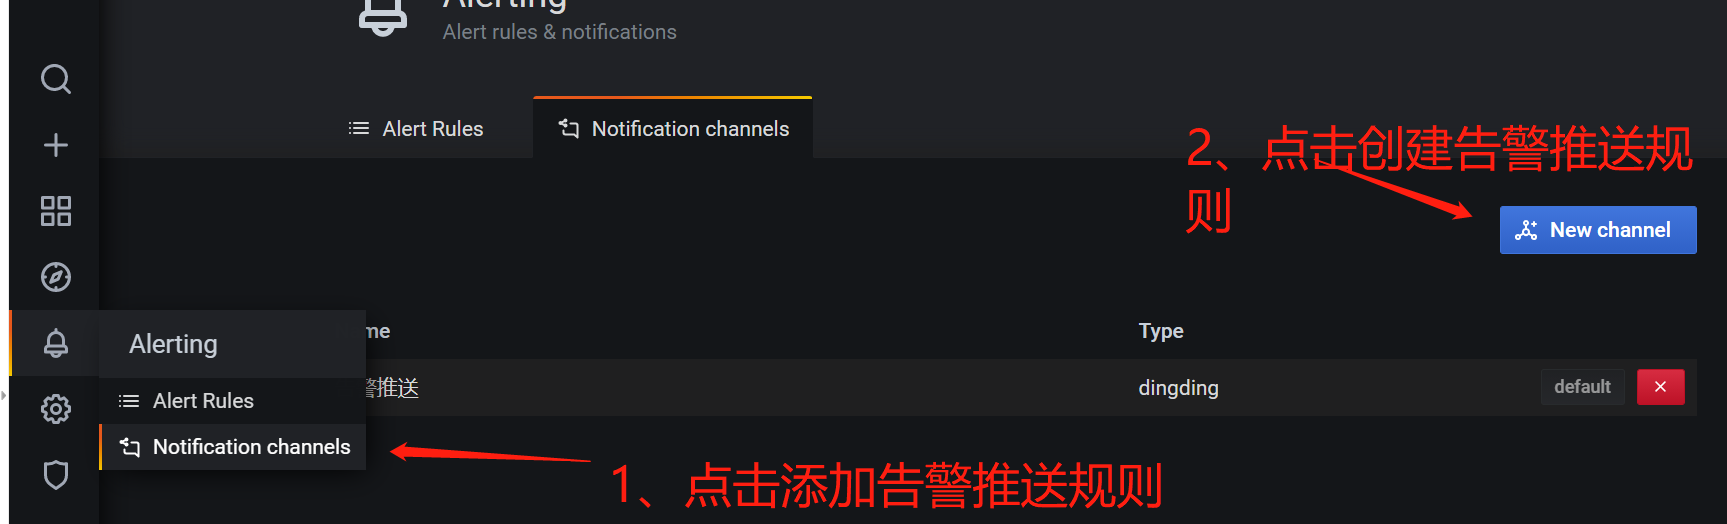
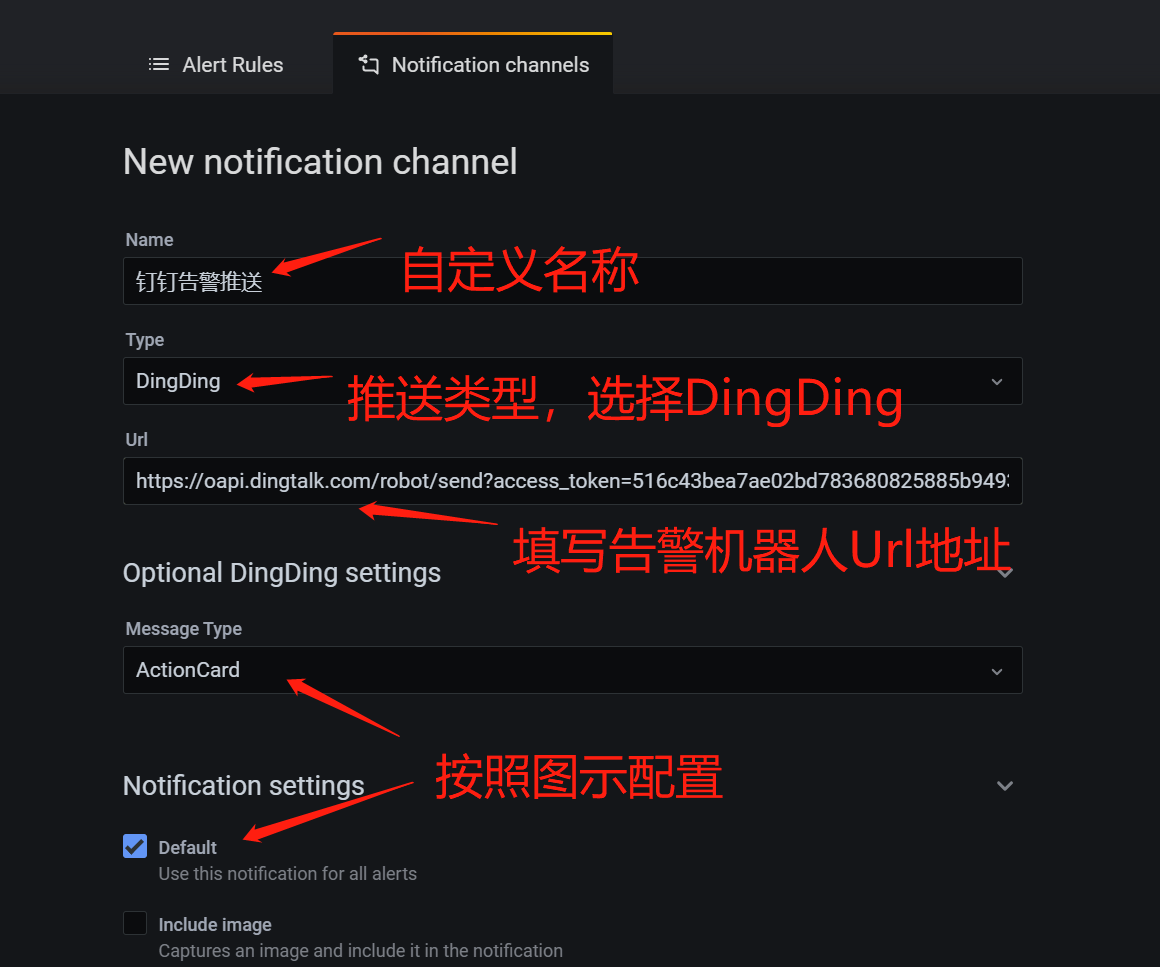
In Grafana, create a notification rule and fill in the required fields.
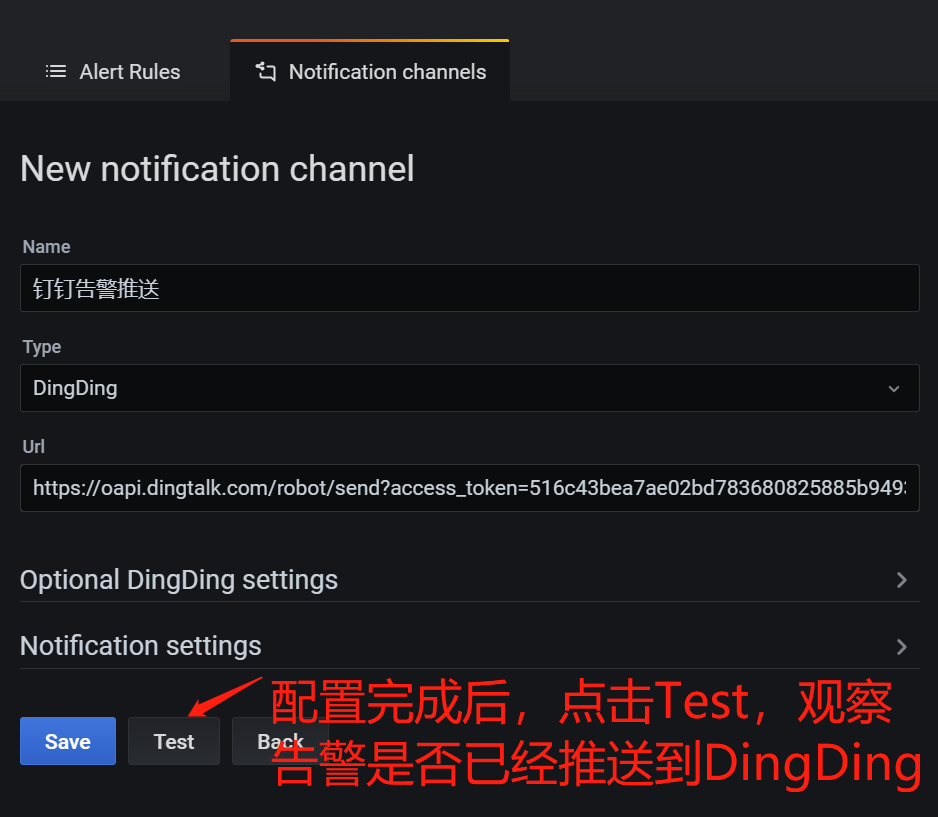
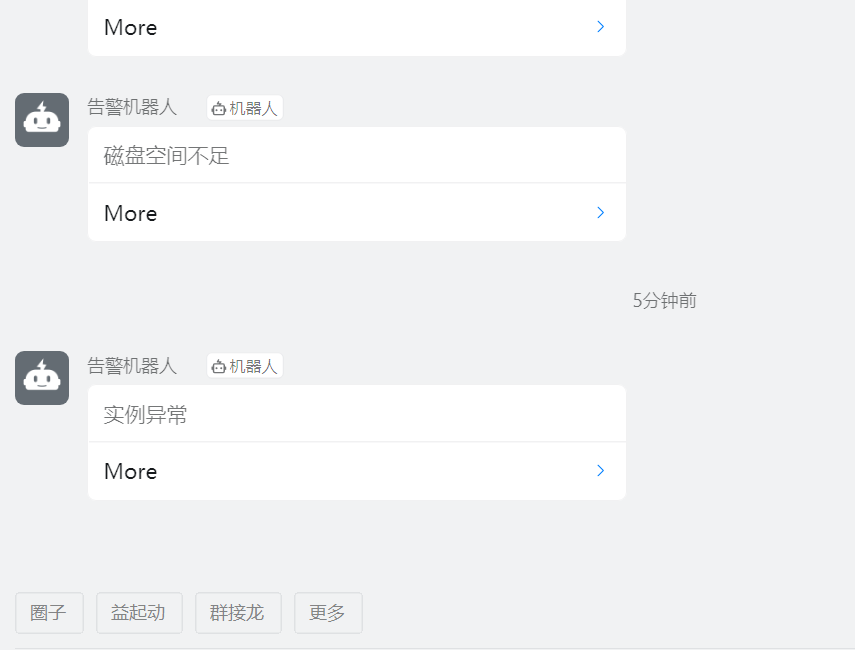
After configuration, click "Test" to verify connectivity between Grafana and DingTalk. If successful, clicking the alert in DingTalk should redirect to the Grafana dashboard. If you see "localhost refused to connect", replace localhost with your actual IP address.
After setting up notification channels, configure alert rules for each monitoring panel.
For more information on alert configuration, see: Grafana Official Documentation: Alert
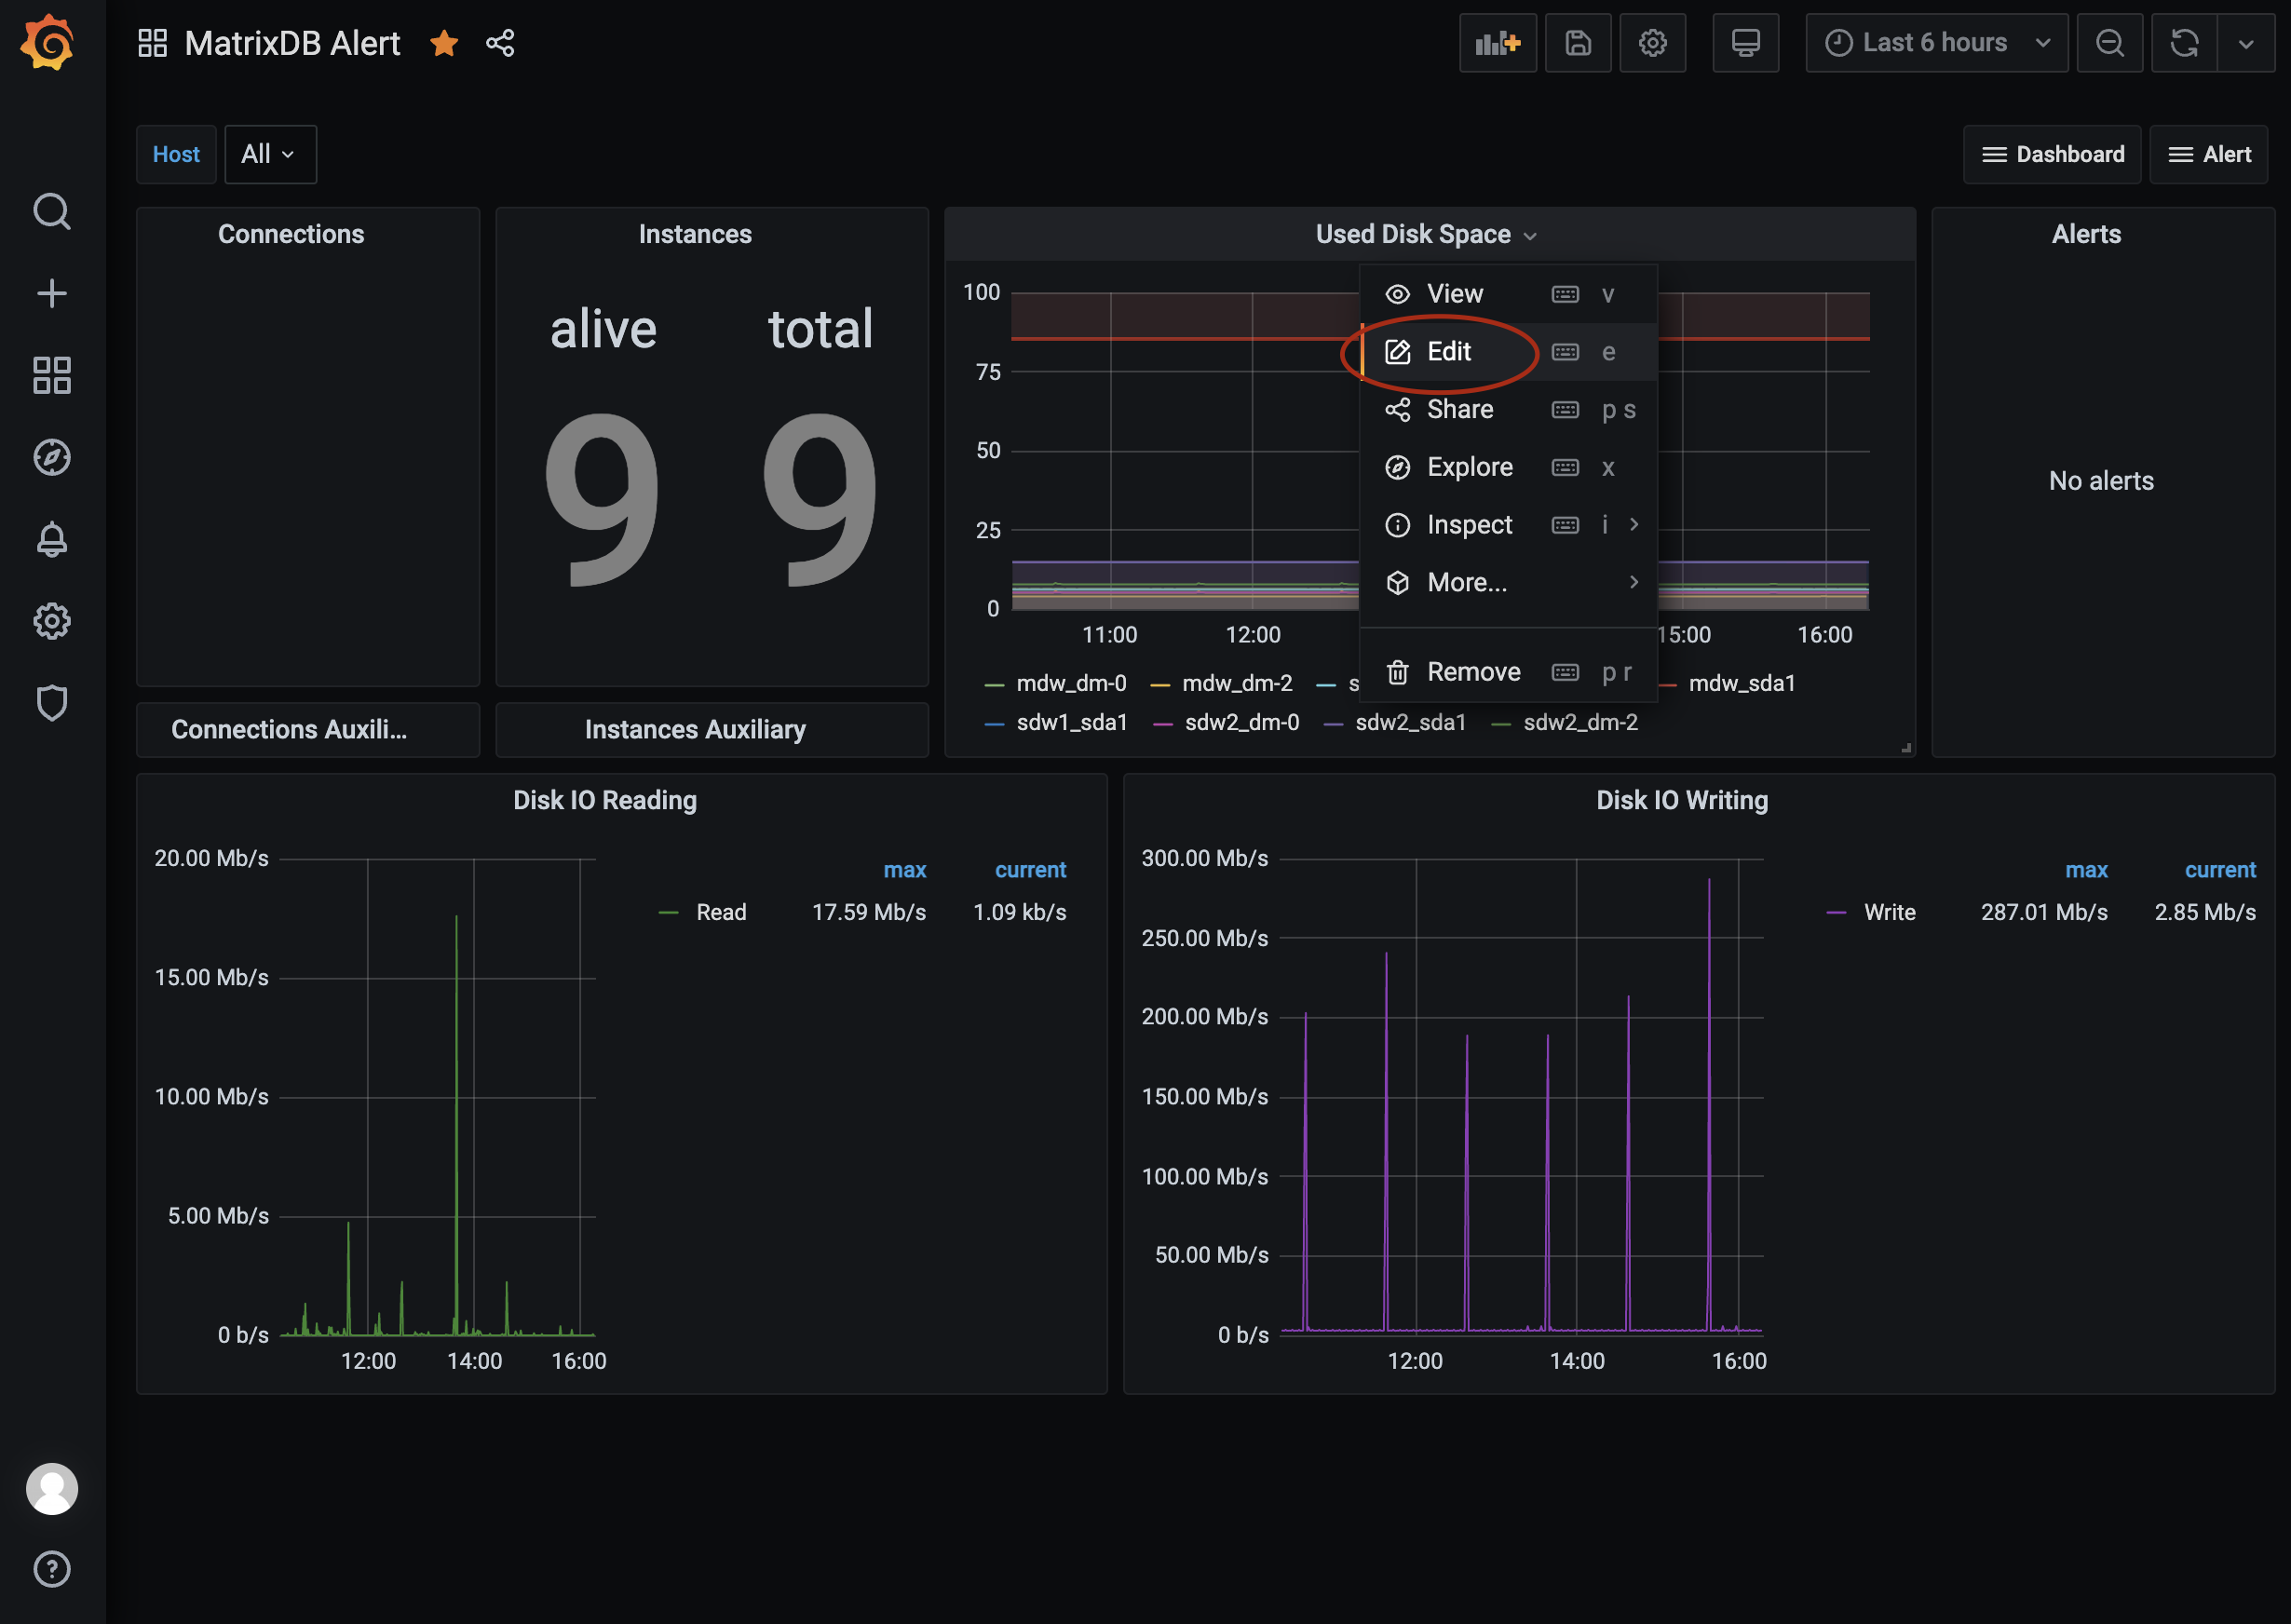
Hover over a panel title. A dropdown arrow appears on the right. Click "Edit" to enter edit mode.
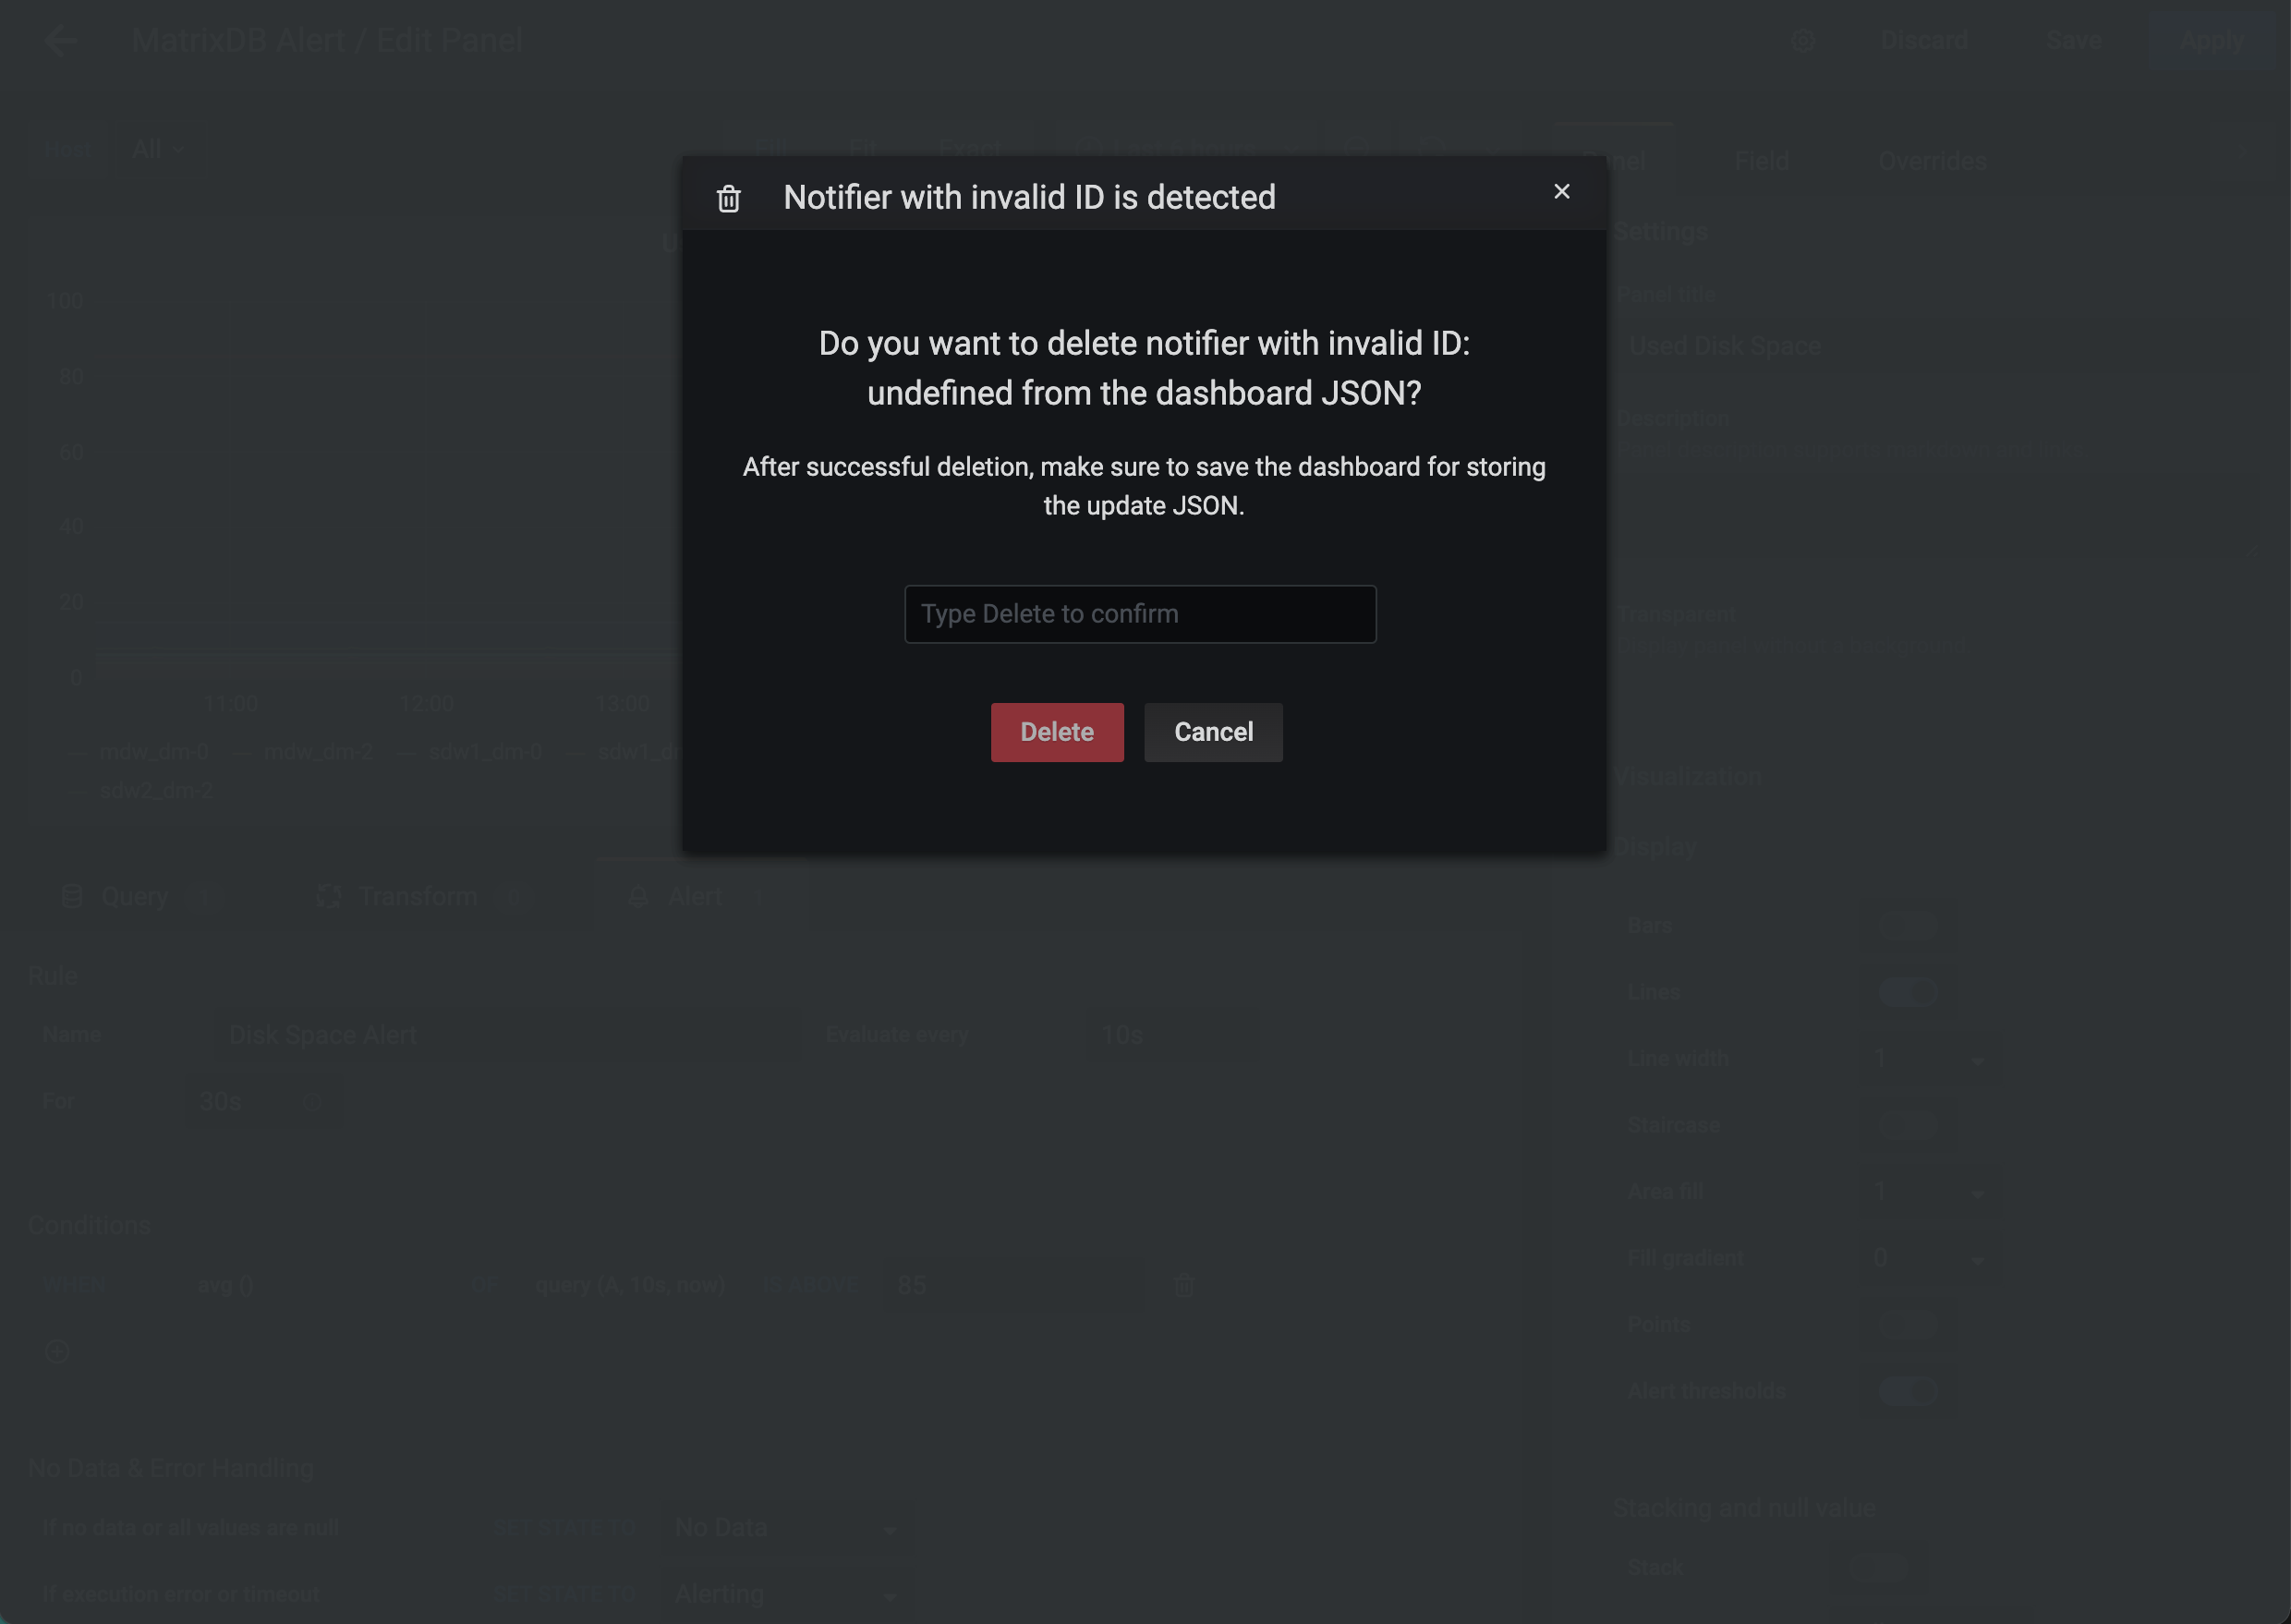
Switch from "Query" to the "Alert" tab below "Edit Panel". If a popup appears saying "Notifier with invalid ID is detected", do not click "Delete", as this may remove the entire panel. Click "Cancel" and close the window instead.
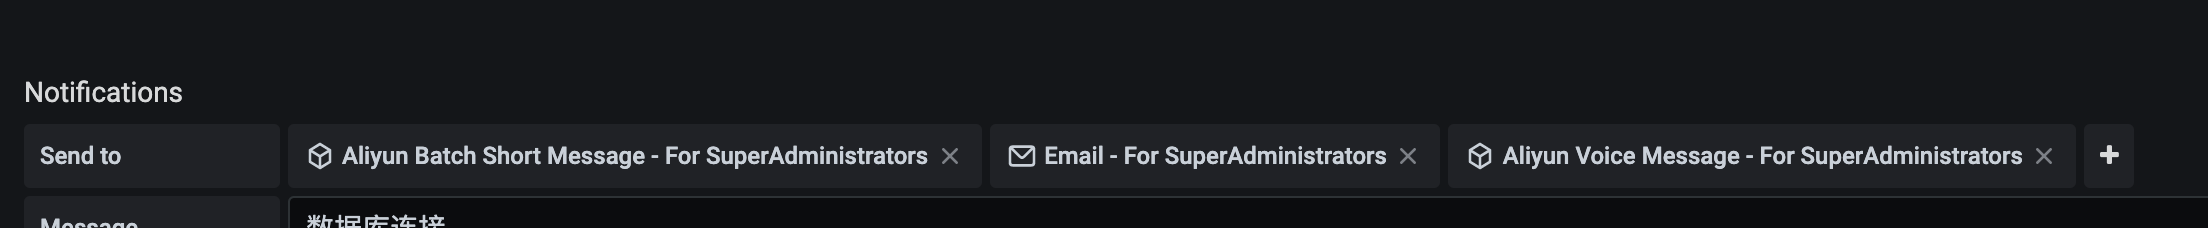
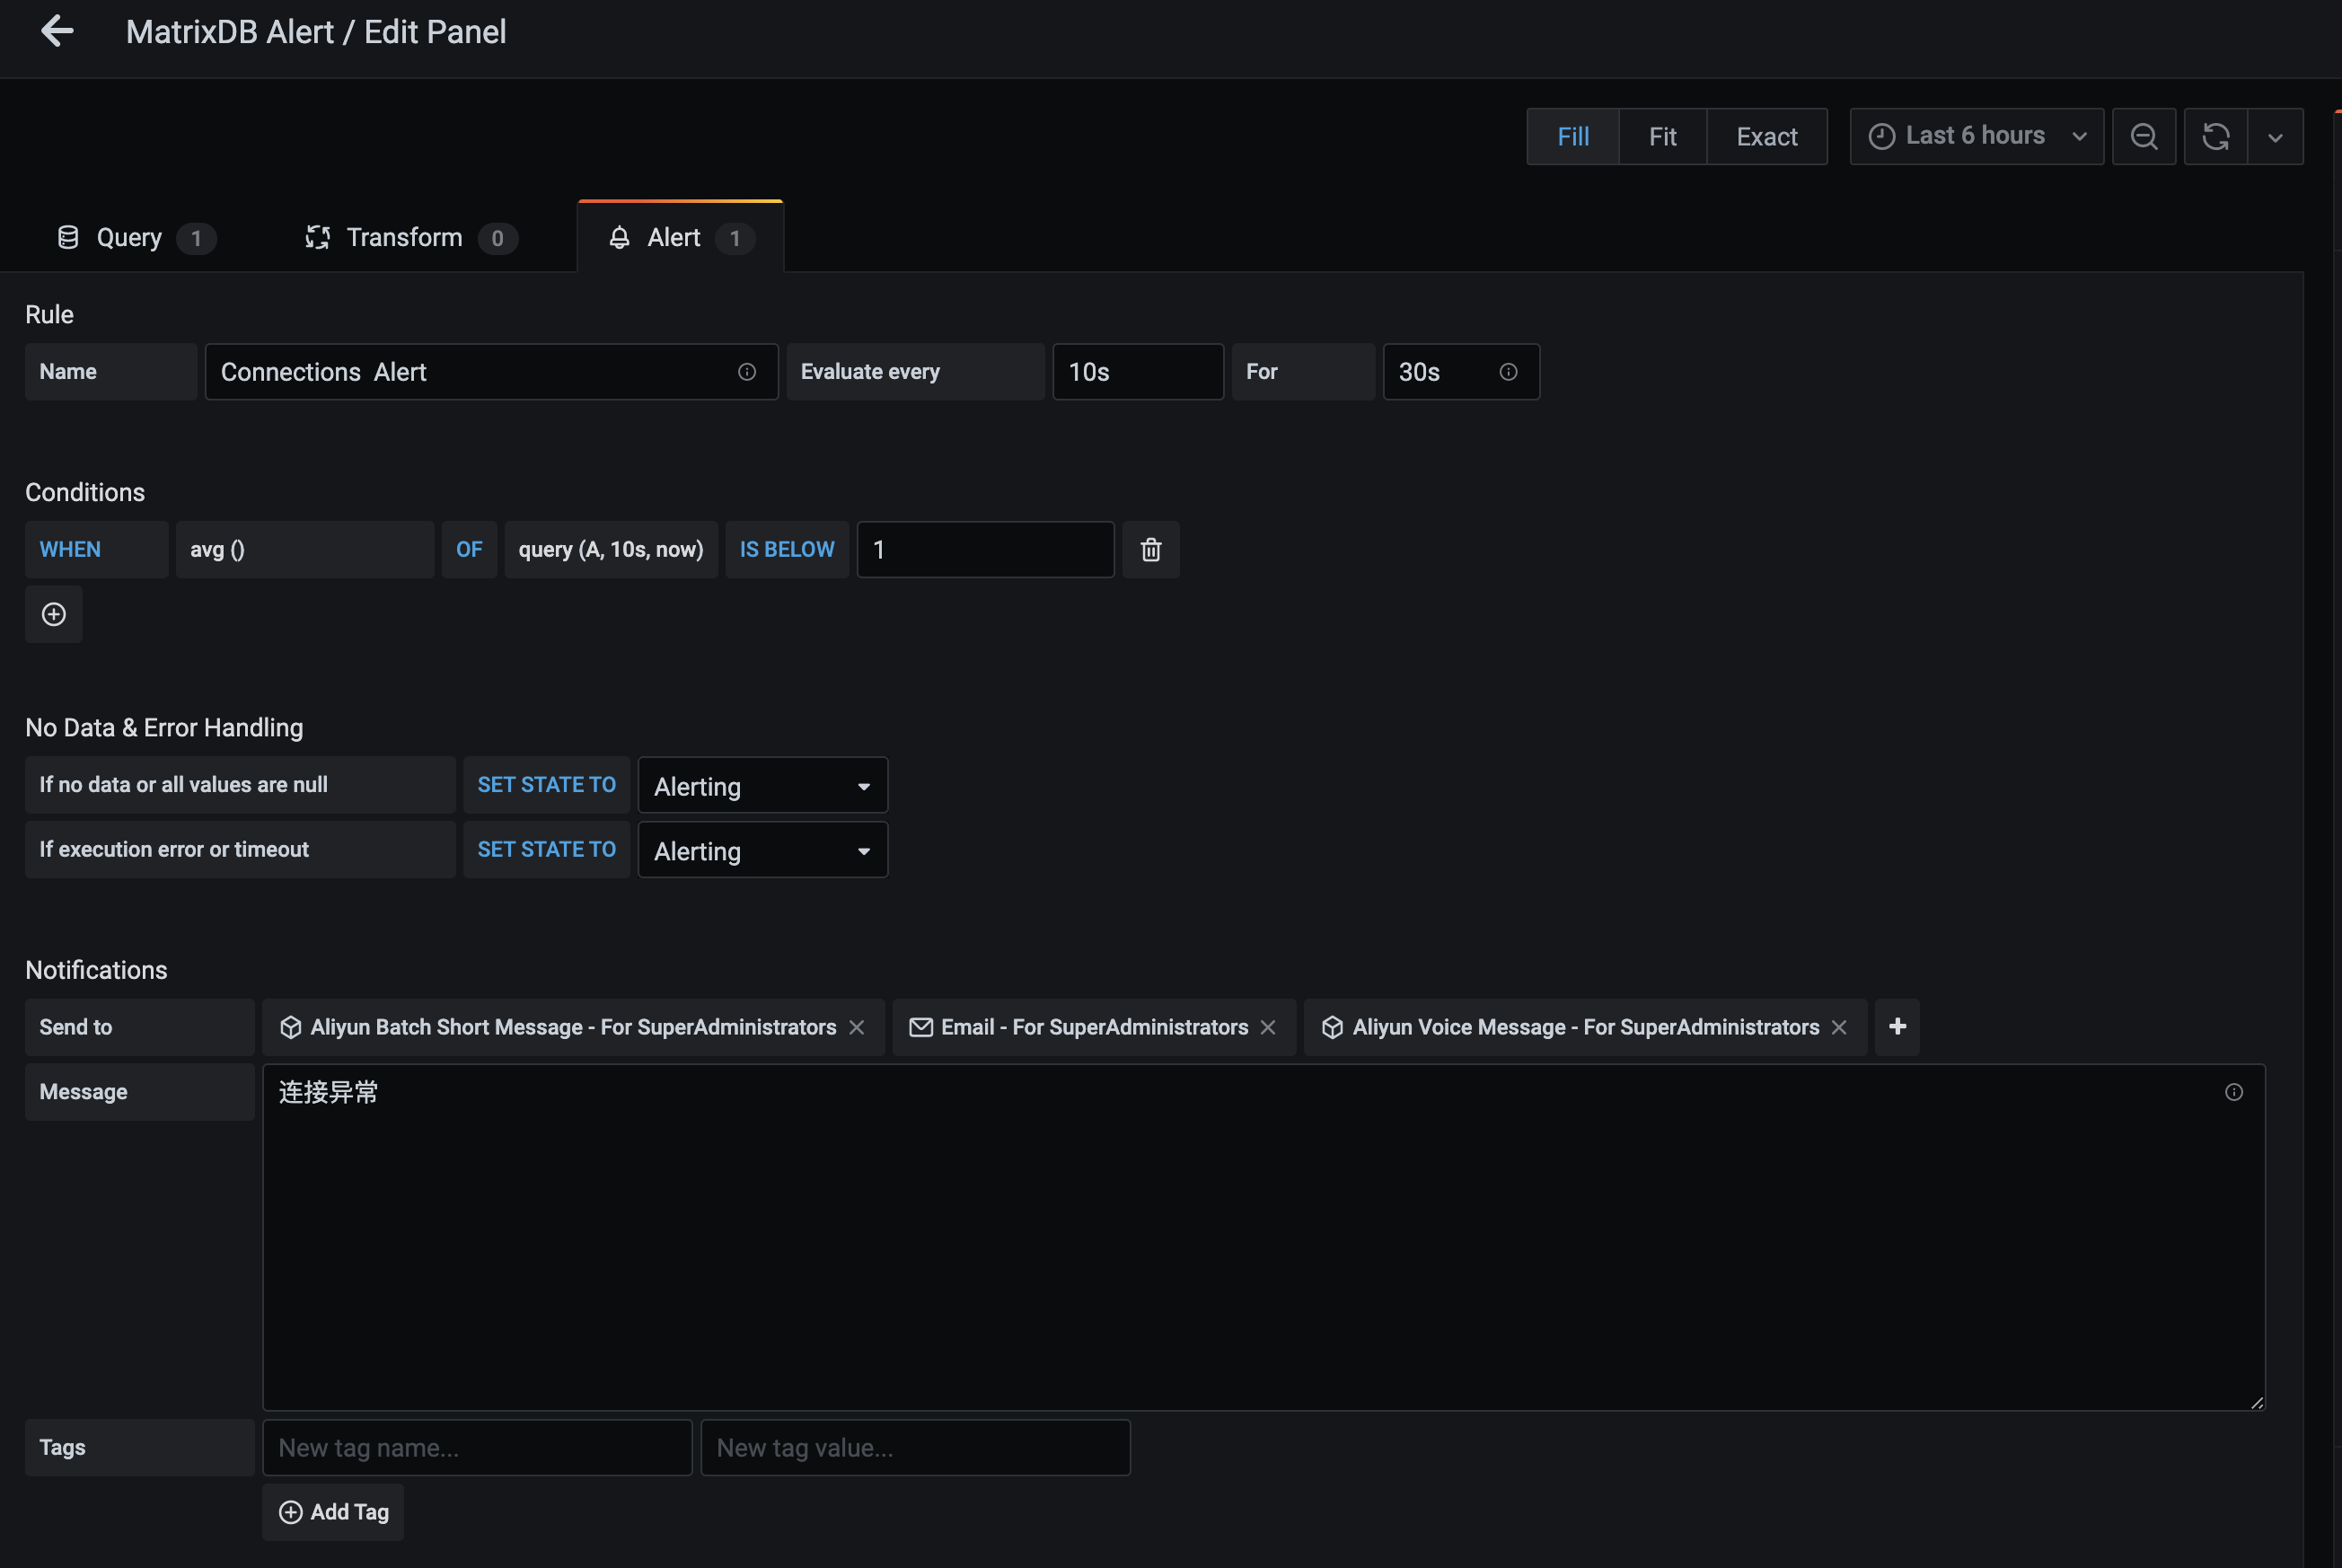
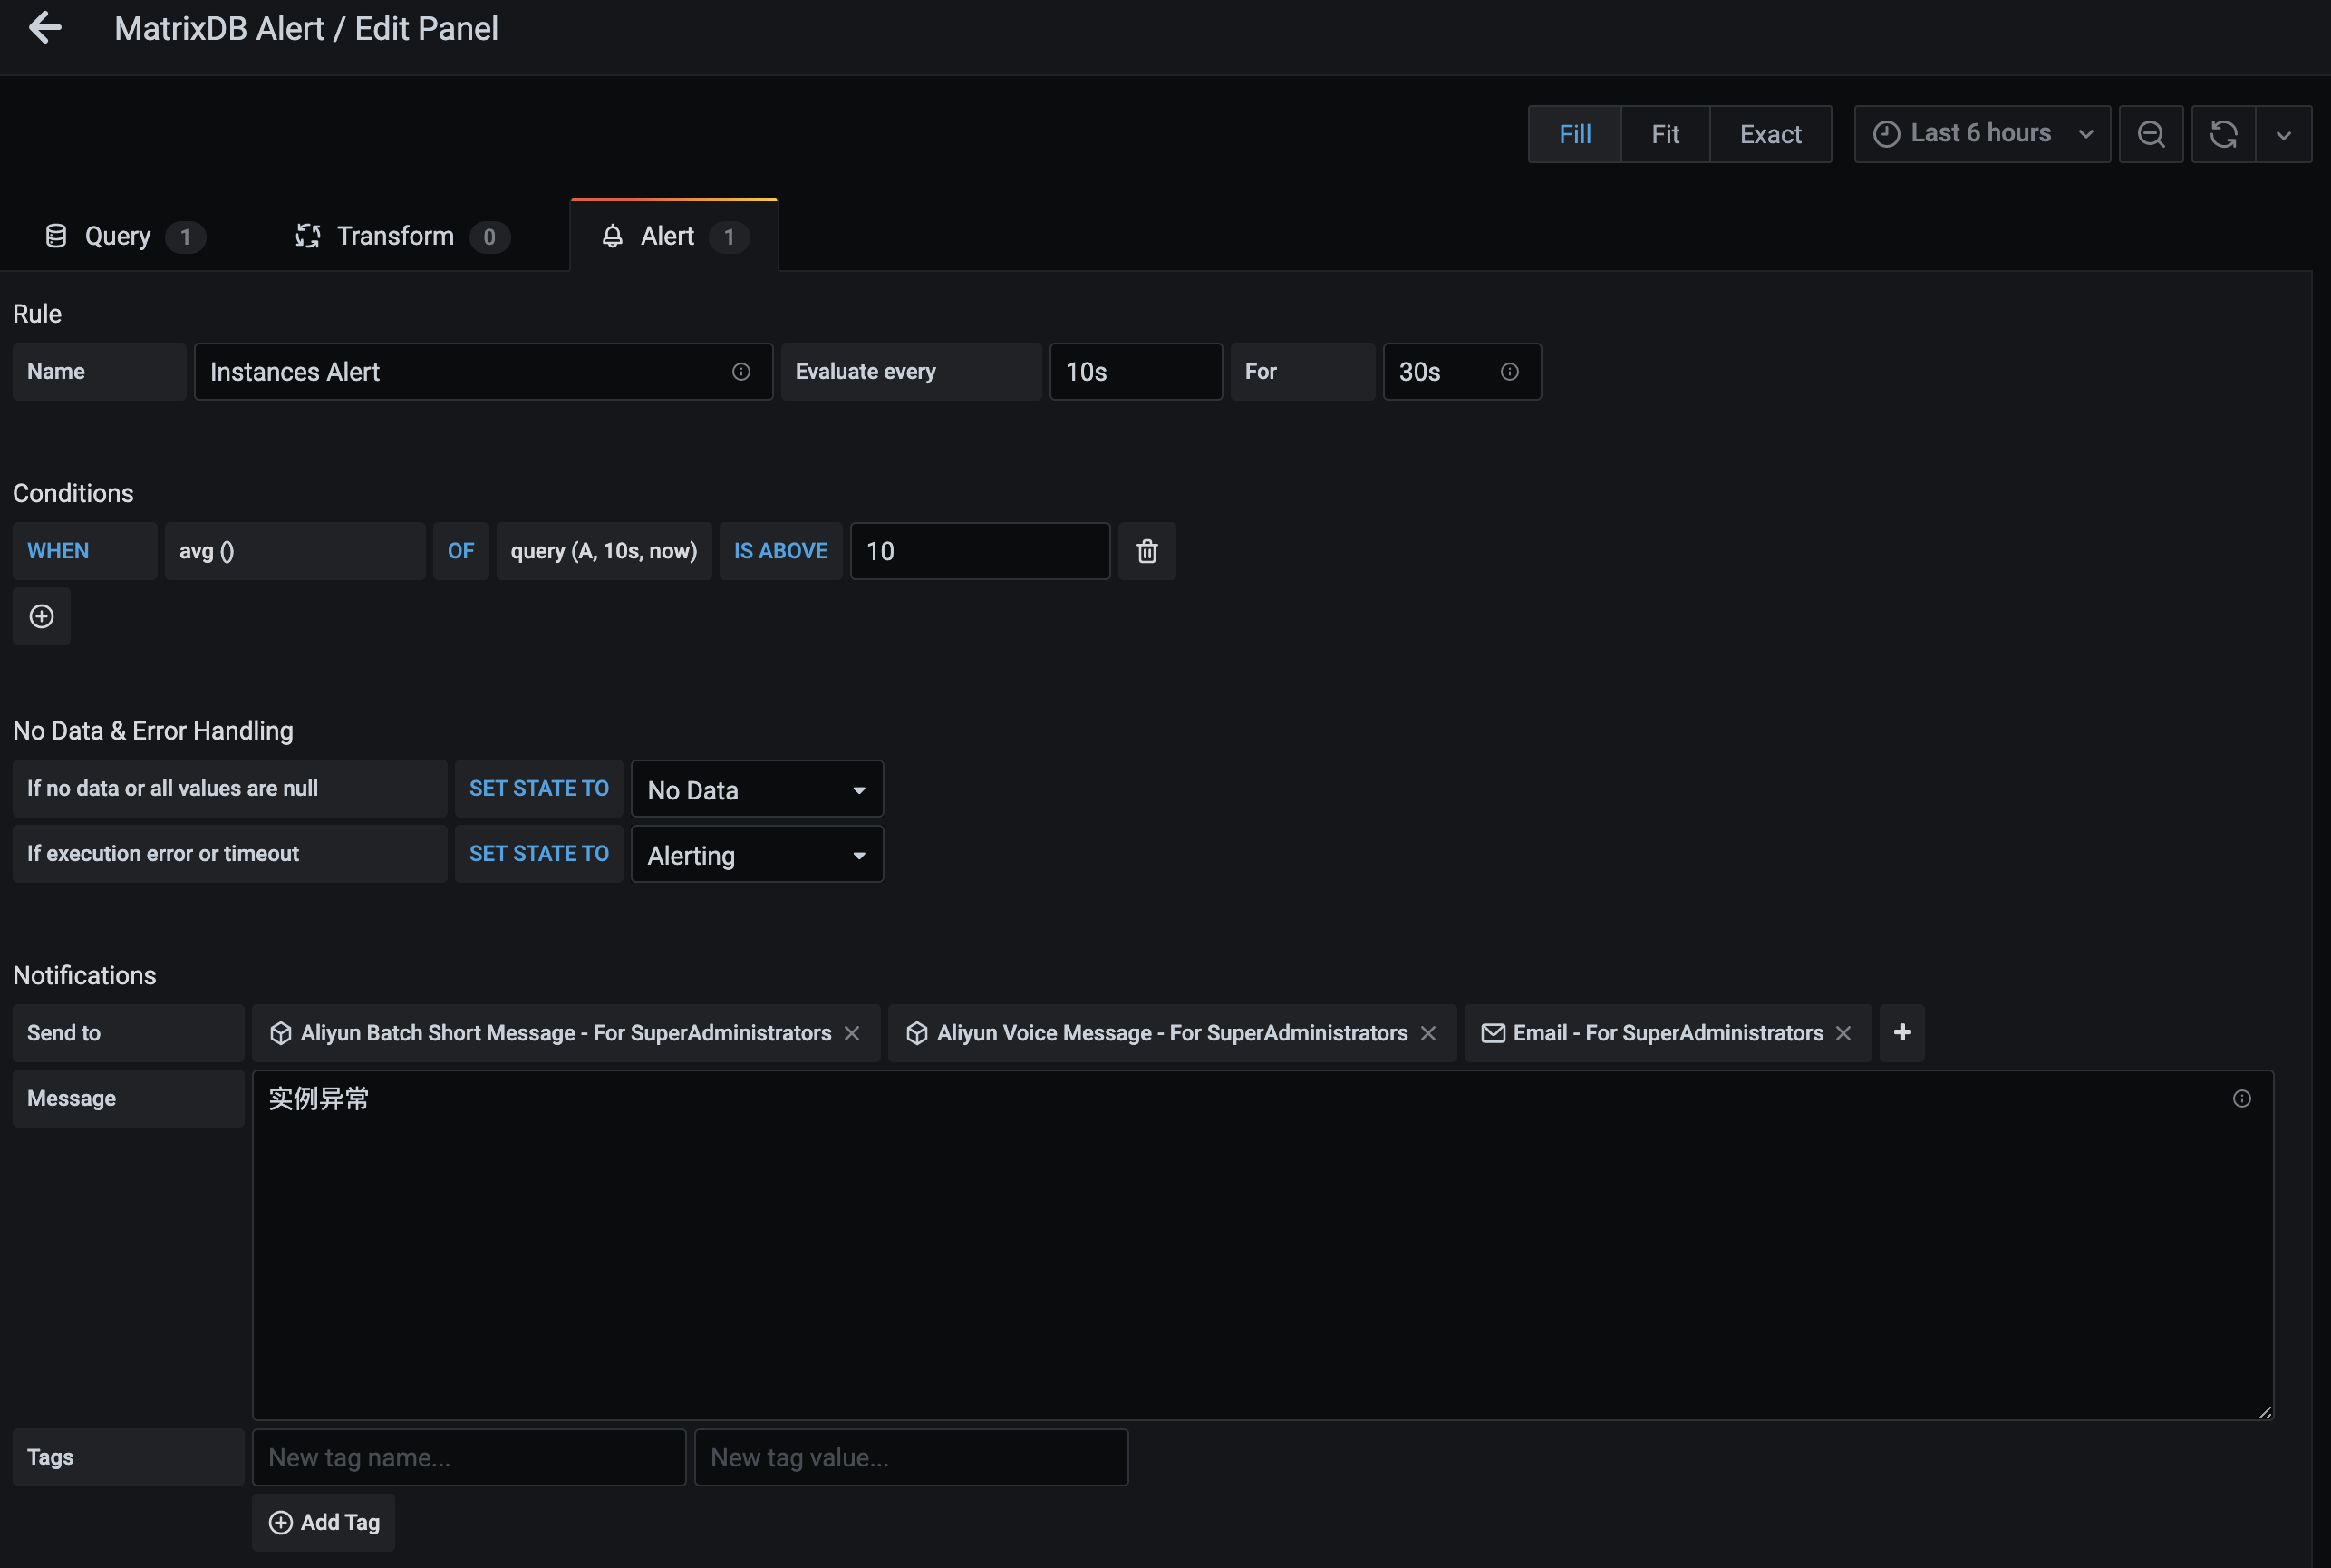
Scroll down to the "Notifications" section. Enter a concise alert message (4–6 words recommended). This message appears in emails and replaces the ${name} variable in SMS and voice templates. Keep it short due to message length limits. Select one or more notification channels (configured earlier) under "Send to".
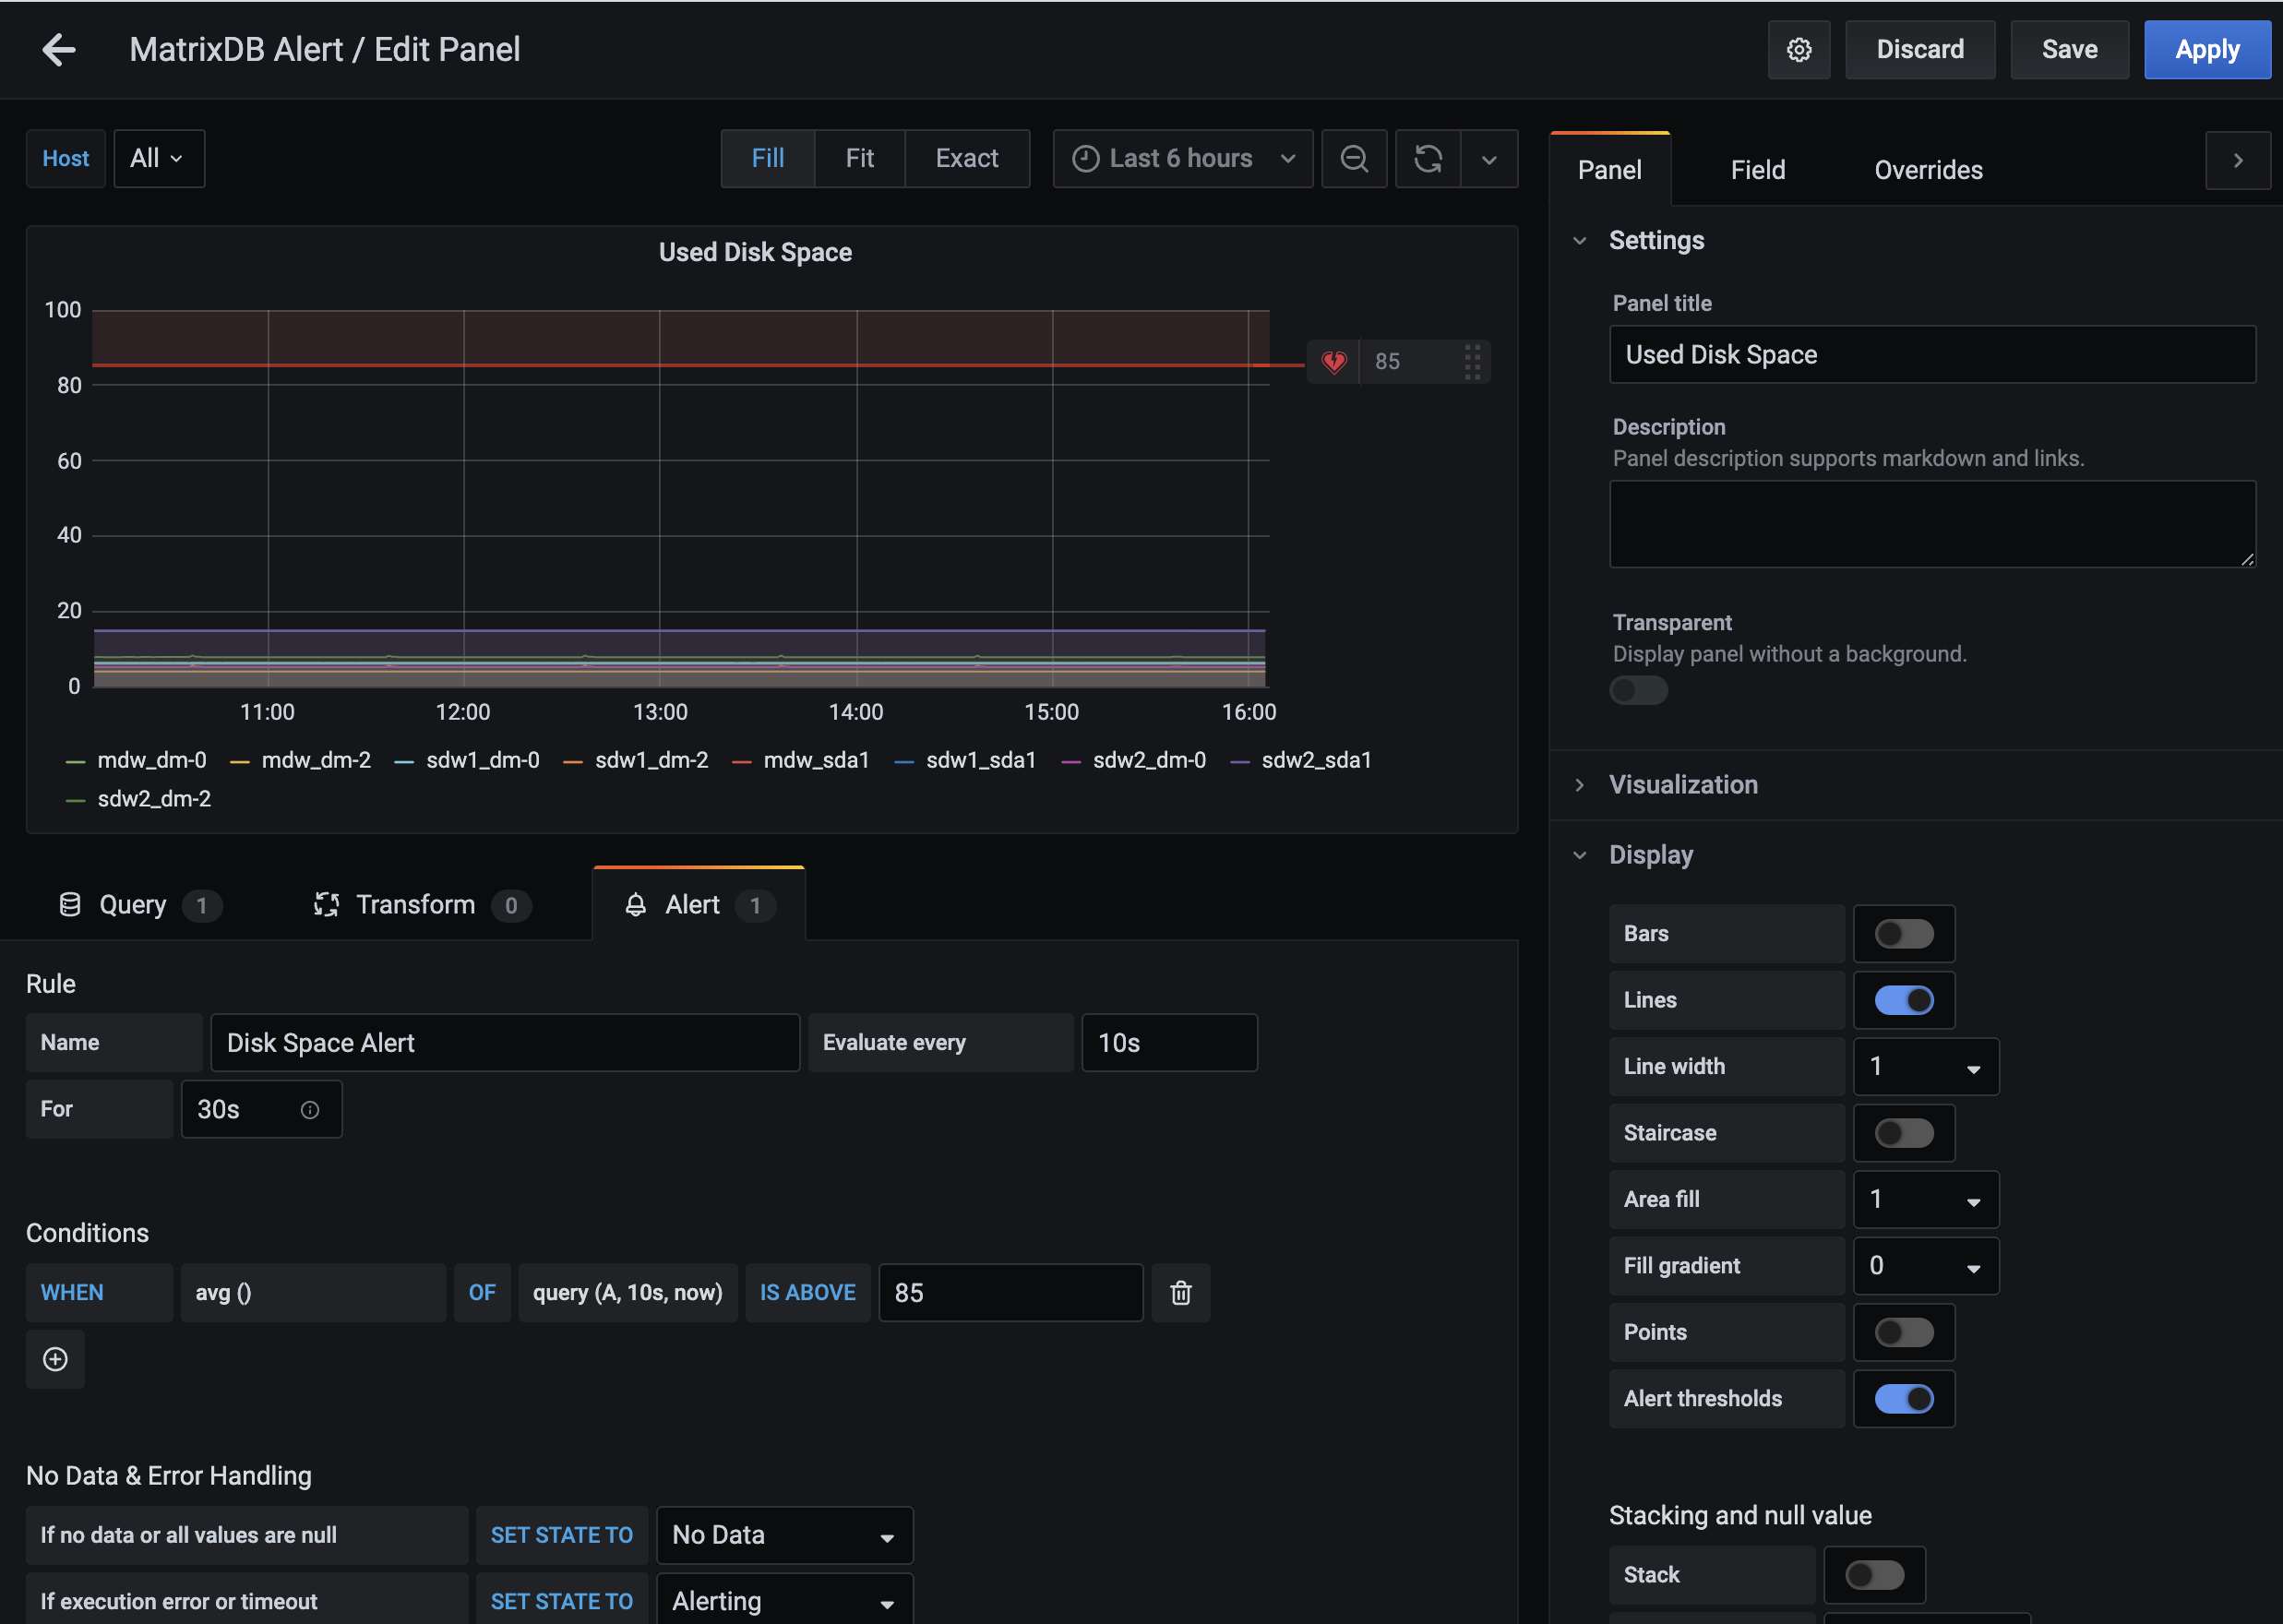
Time-series databases aggregate data over time intervals. "No Data" may occur if no data is collected during the interval—e.g., due to time skew (Grafana time ahead of system time by 5 minutes) or data collection failure. "No Data" conditions are handled via alerting.
As shown:
The red line in the "Used Disk Space" graph indicates the alert threshold. The shaded red area exceeds this threshold and indicates a critical condition. The default threshold is 85%, but you can customize the "IS ABOVE" value.
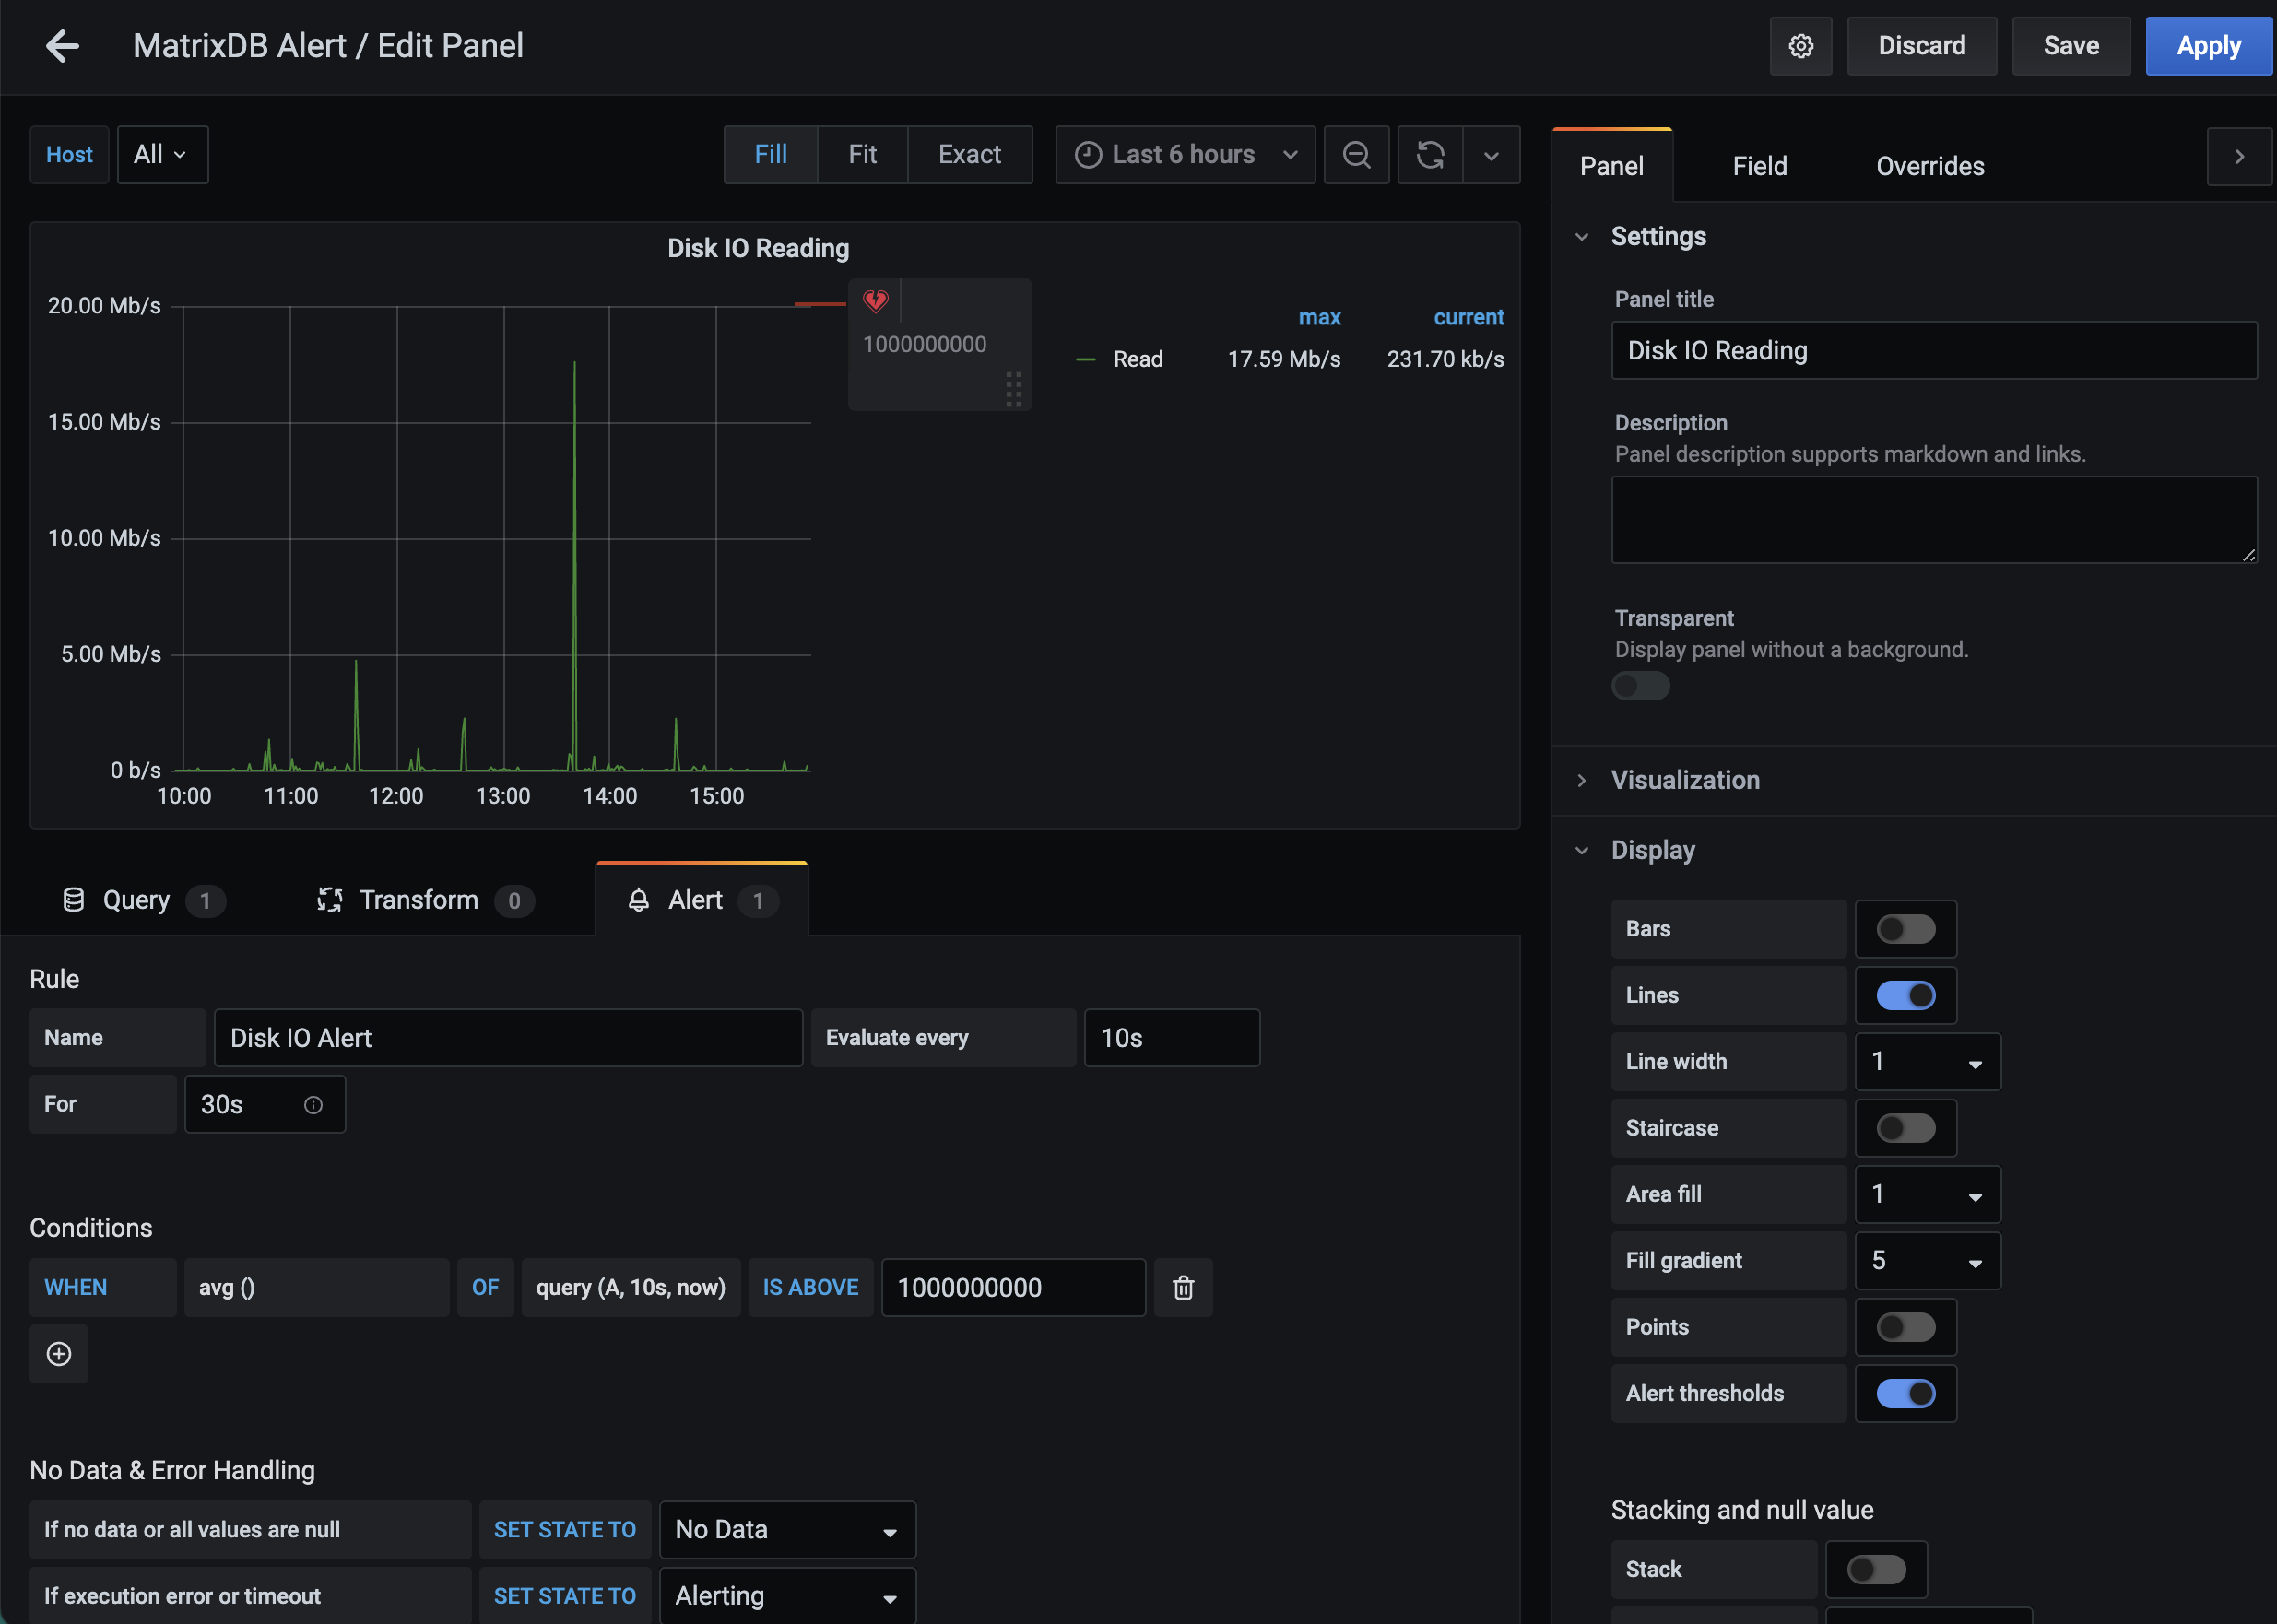
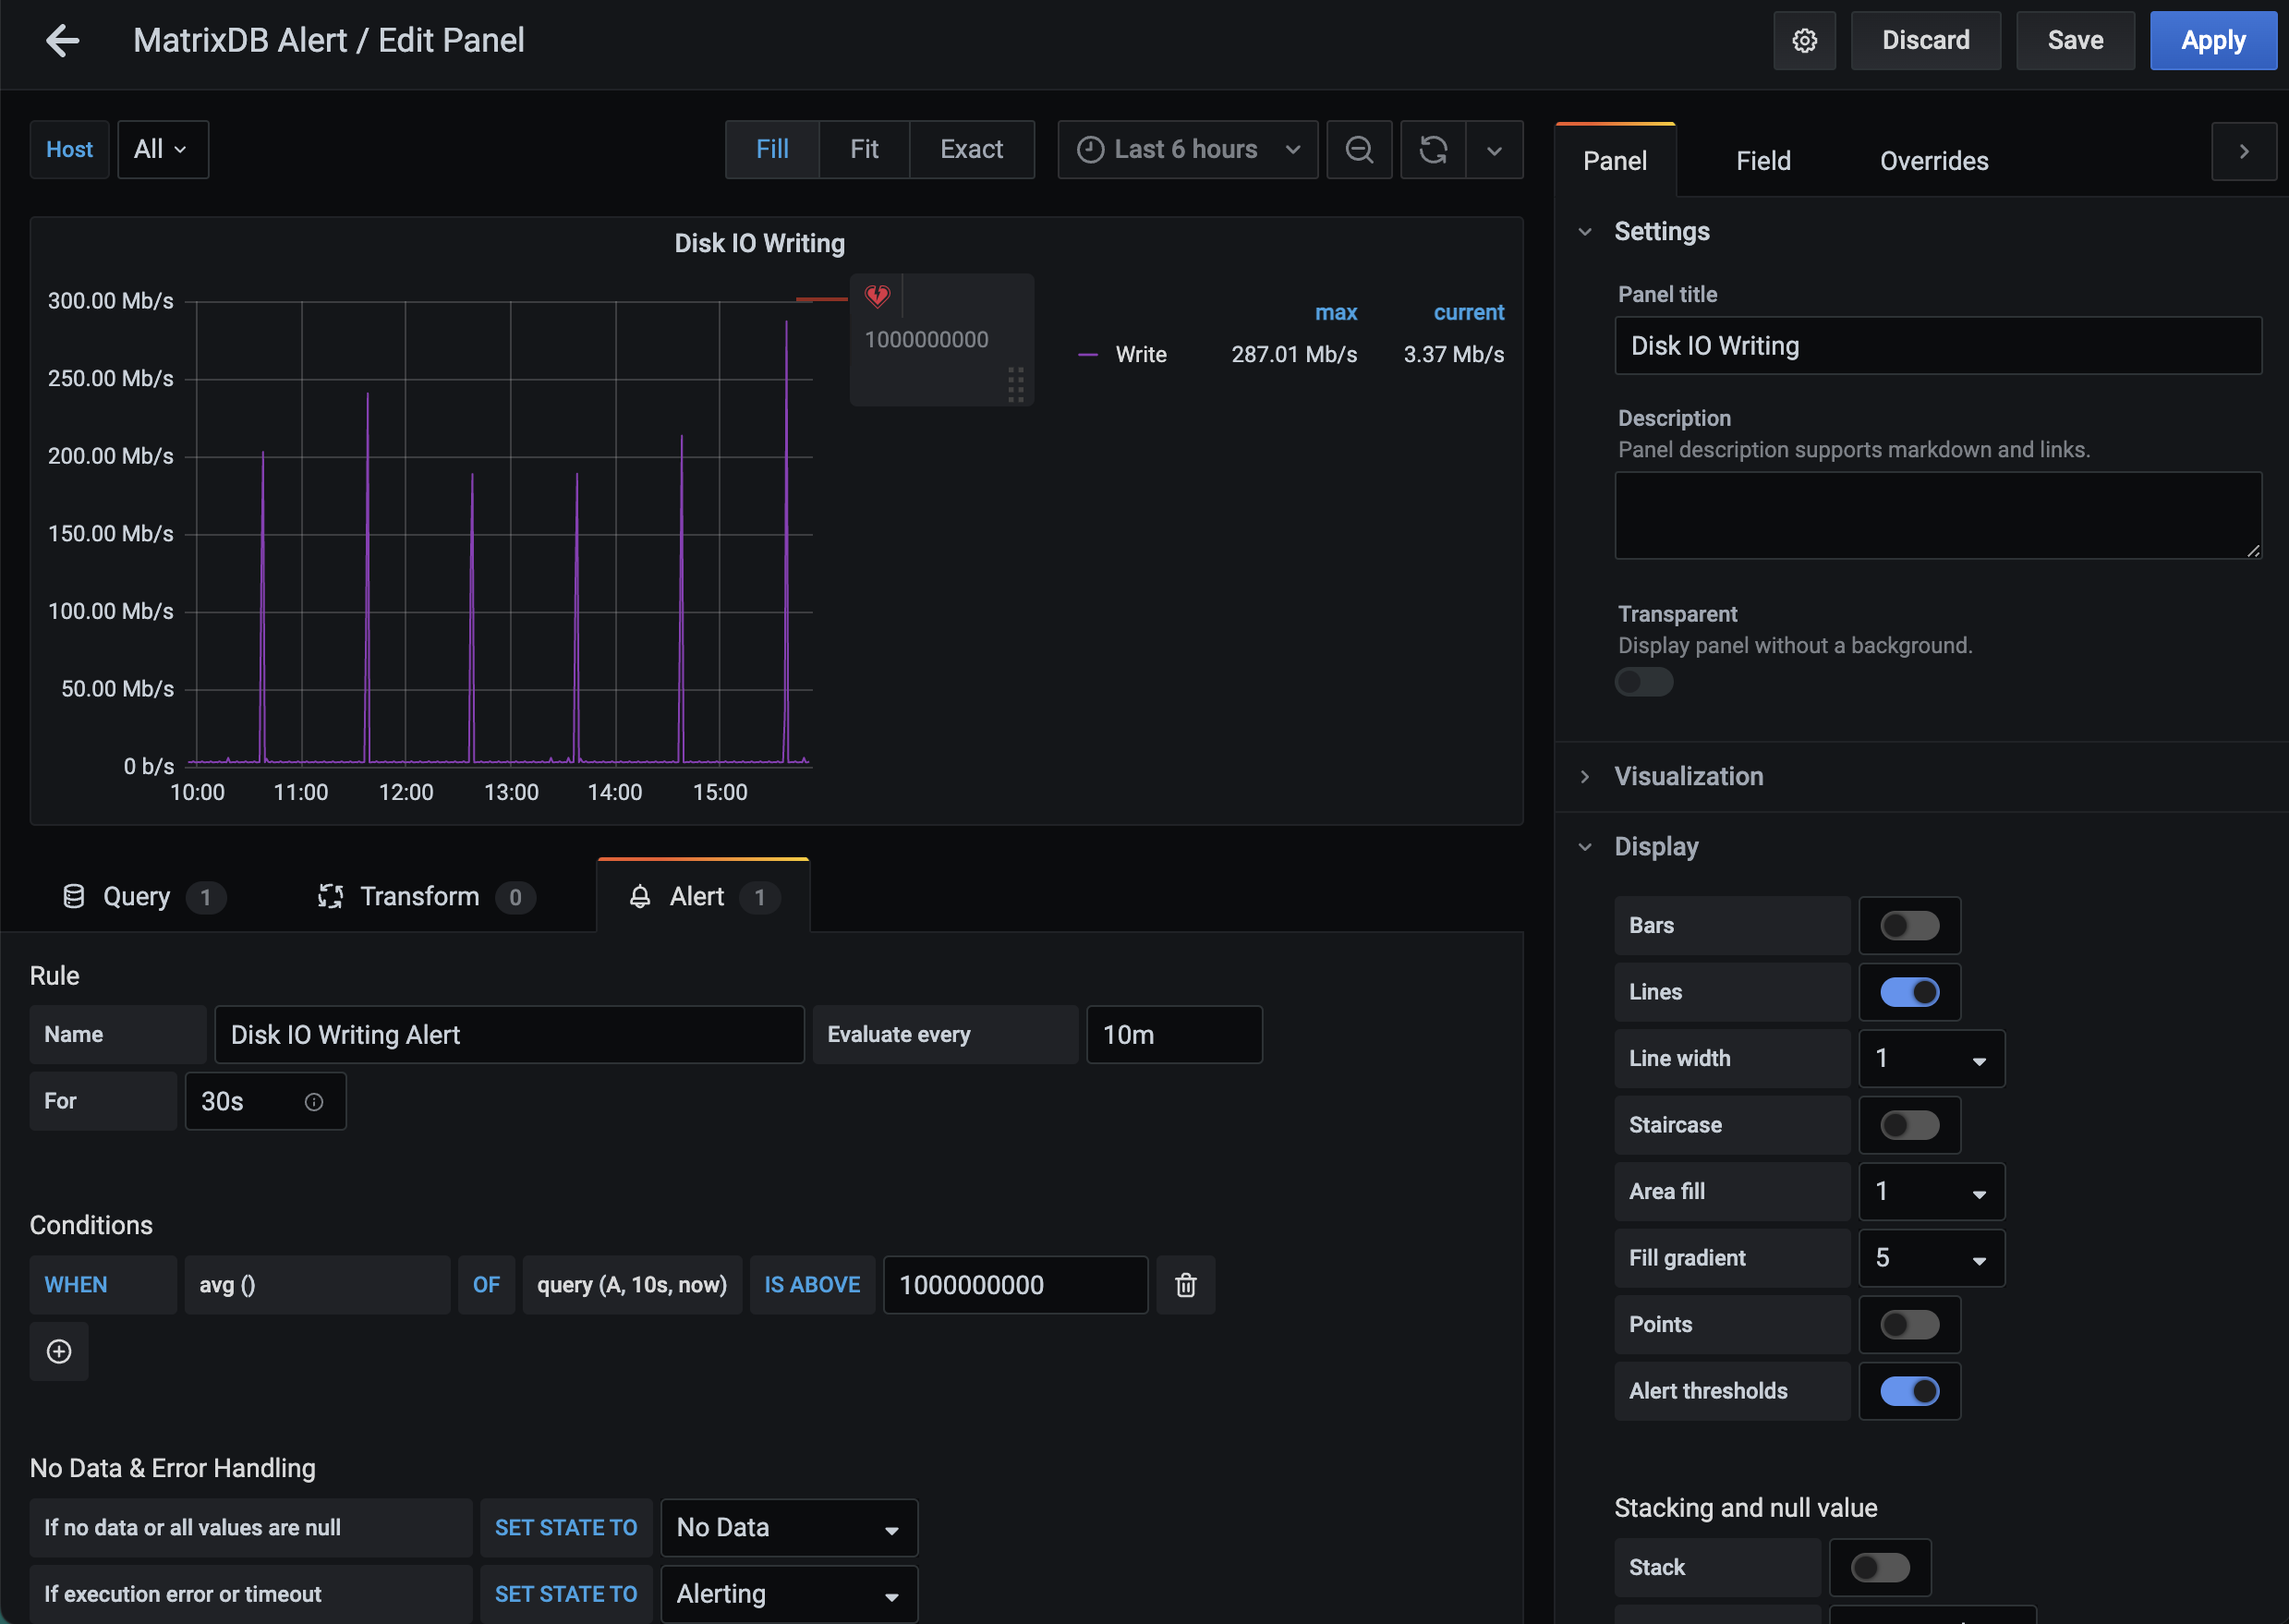
Disk I/O read and write alerts (Disk IO Reading, Disk IO Writing) are disabled by default, allowing you to define custom thresholds.
Note!
Click Save after making changes to apply your alert settings.
alert.yaml configuration file, run the following commands to apply changes:source /opt/ymatrix/matrixdb5/greenplum_path.sh
supervisorctl stop mxui
supervisorctl start mxui