MatrixDB also provides a self-developed exporter, which can be perfectly connected to the Prometheus monitoring ecosystem.
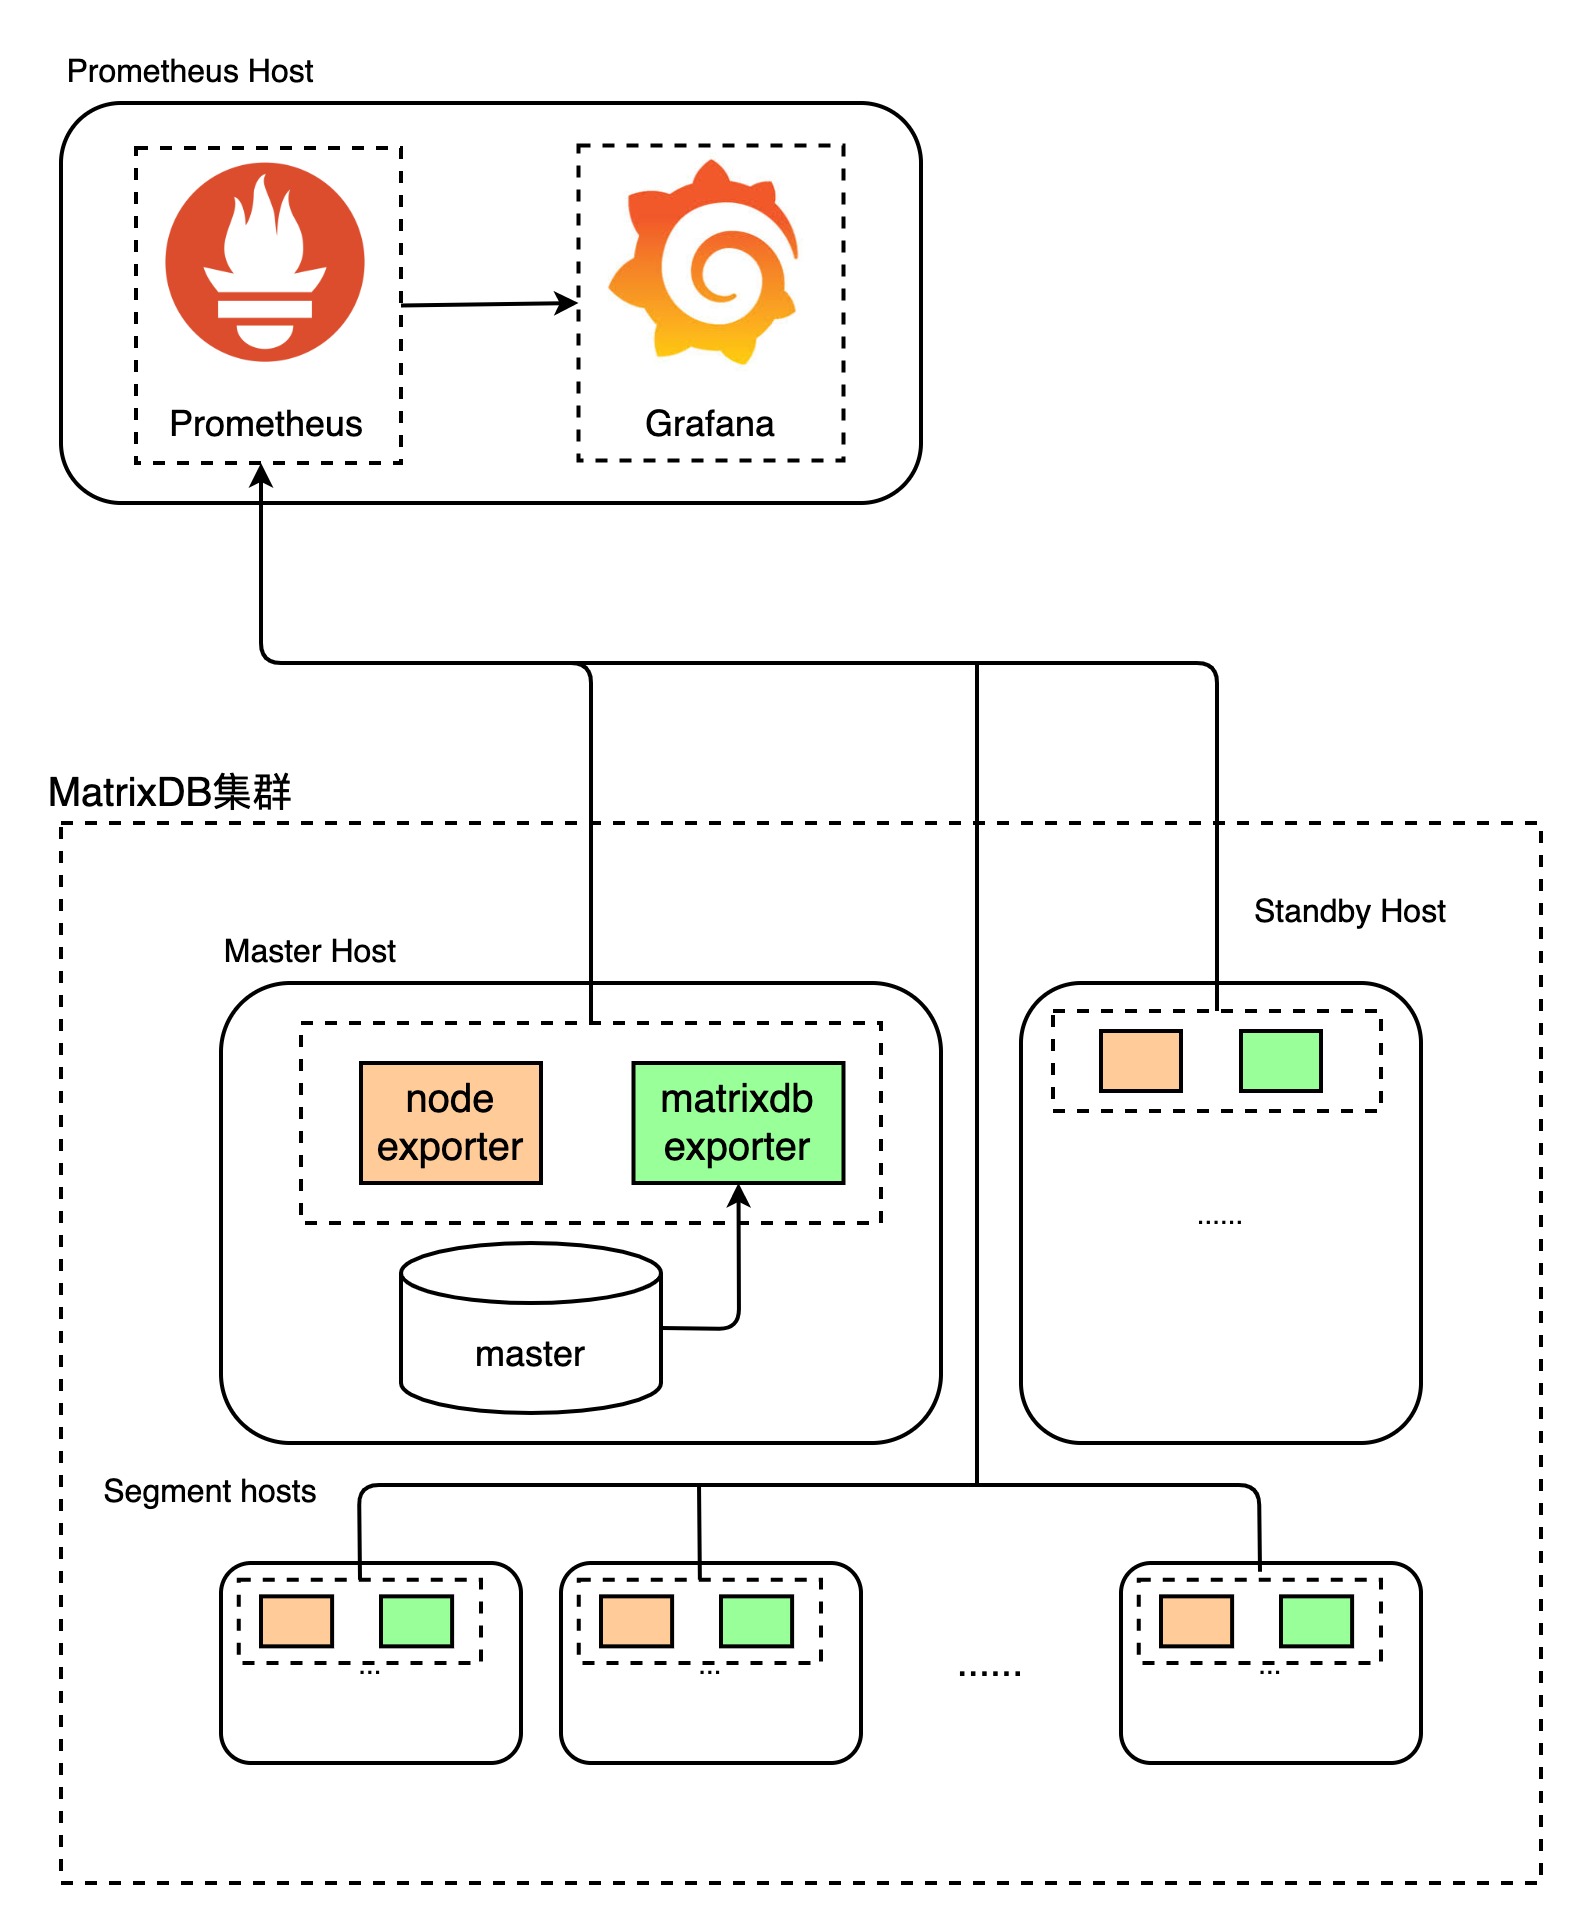
It should be noted that MatrixDB's exporter and corresponding Dashboard only contains monitoring of the database itself and do not include monitoring of the operating system indicators. Operating system-related metric monitoring requires additional exporter support, such as node_exporter. The module layout is as follows:
The MatrixDB exporter is included in the MatrixDB installation package and can be used when activated. Then install and deploy node_exporter, Grafana, Prometheus.
Create matrixmgr database
createdb matrixmgr;Connect to the matrixmgr database, create matrixts and matrixmgr extensions, and activate exporter
psql -d matrixmgr

matrixmgr=# CREATE EXTENSION matrixts;
matrixmgr=# CREATE EXTENSION matrixmgr;

matrixmgr=# SELECT mxmgr_init_exporter();
After success, you can observe that a new pattern called "exporter" appears under the matrixmgr database. Tables and views in this mode contains cluster monitoring and configuration information. Do not change the definitions and contents of these tables and views by yourself.
This command starts matrixdb_exporter on all machines in the cluster.
Note: If the cluster has started the old monitoring system, it is necessary to shut down the old monitoring system first, otherwise it will fail.
Close method: SELECT mxmgr_remove_all('local');
node_exporter is used to monitor operating system-related metrics. Download the latest version of node_exporter from the official website. Here we take 1.3.1 as an example (using root account operation).
# Download node_exporter
wget https://github.com/prometheus/node_exporter/releases/download/v1.3.1/node_exporter-1.3.1.linux-amd64.tar.gz

# Unzip the installation package
tar -xvf node_exporter-1.3.1.linux-amd64.tar.gz -C /usr/local

# Create a soft link
ln -s /usr/local/node_exporter-1.3.1.linux-amd64/ /usr/local/node_exporter

# Generate systemctl configuration file
cat << EOF > /usr/lib/systemd/system/node_exporter.service
[Service]
User=root
Group=root
ExecStart=/usr/local/node_exporter/node_exporter

[Install]
WantedBy=multi-user.target

[Unit]
Description=node_exporter
After=network.target

EOF

# Start node_exporter
systemctl start node_exporter
systemctl status node_exporter
systemctl enable node_exporter
Note: node_exporter needs to be deployed on all hosts of the cluster, so the above steps must be performed once on all hosts of the cluster.
Prepare a host that can access all hosts of the cluster, which can be a Master or Standby Master node, or a separate machine (all for Linux, MacOS, Windows, etc.).
Install the latest version of Prometheus. The official download and installation link is https://prometheus.io/download/.
The following commands describe the operation method using CentOS 7 as an example. For commands for other operating systems, please refer to the corresponding operating system usage guide. Download and install Prometheus (requires root permission)
# Download the installation package
wget https://github.com/prometheus/prometheus/releases/download/v2.36.1/prometheus-2.36.1.linux-amd64.tar.gz
# Unzip to /usr/local and create a soft link
tar -xf ./prometheus-2.36.1.linux-amd64.tar.gz -C /usr/local
ln -s /usr/local/prometheus-2.36.1.linux-amd64/ /usr/local/prometheus
# Create a prometheus account
useradd -s /sbin/nologin -M prometheus
# Create a data directory
mkdir /data/prometheus -p
# Modify the user and group to which the directory belongs
chown -R prometheus:prometheus /usr/local/prometheus/
chown -R prometheus:prometheus /data/prometheus/
# Configure systemctl
cat << EOF > /etc/systemd/system/prometheus.service
 [Unit]
 Description=Prometheus
 Documentation=https://prometheus.io/
 After=network.target

 [Service]
 Type=simple
 User=prometheus
 ExecStart=/usr/local/prometheus/prometheus --config.file=/usr/local/prometheus/prometheus.yml --storage.tsdb.path=/data/prometheus
 Restart=on-failure

 [Install]
 WantedBy=multi-user.target

EOF

# Modify prometheus configuration file
# Add ip and port of matrixdb and node exporter in scrape_configs
# (matrixdb_exporter default port 9273, node_exporter default port 9100):
# It should also be noted that the monitoring diagrams of matrixdb and mxgate are used for cluster filtering through matrixdb_cluster variable.
# So you need to add the relabel_configs configuration and replace the job tag with matrixdb_cluster.
# Fill in the cluster name in replacement
# You can refer to the following configuration:
scrape_configs:
  - job_name: "matrixdb_exporter"
    relabel_configs:
      - source_labels: ['job']
        regex: .*
        target_label: matrixdb_cluster
        replacement: cluster1
        action : replace
    static_configs:
      - targets: ["localhost:9273"]
  - job_name: "node_exporter"
    static_configs:
      - targets: ["localhost:9100"]

# When the cluster contains multiple hosts, the IP port of each host needs to be added to the targets array
# For example:
scrape_configs:
  - job_name: "matrixdb_exporter"
    relabel_configs:
      - source_labels: ['job']
        regex: .*
        target_label: matrixdb_cluster
        replacement: cluster1
        action : replace
    static_configs:
    - targets: ["192.168.0.1:9273", "192.168.0.2:9273", "192.168.0.3:9273"]
  - job_name: "node_exporter"
    static_configs:
    - targets: ["192.168.0.1:9100", "192.168.0.2:9100", "192.168.0.3:9100"]

# Note: Pay attention to indentation when editing yaml files, otherwise syntax errors will occur, resulting in failure to start.

# Start prometheus
systemctl start prometheus
systemctl status prometheus
systemctl enable prometheus
After startup, you can access the WebUI through the UI interface provided by Prometheus and check the running status, http://IP:9090/
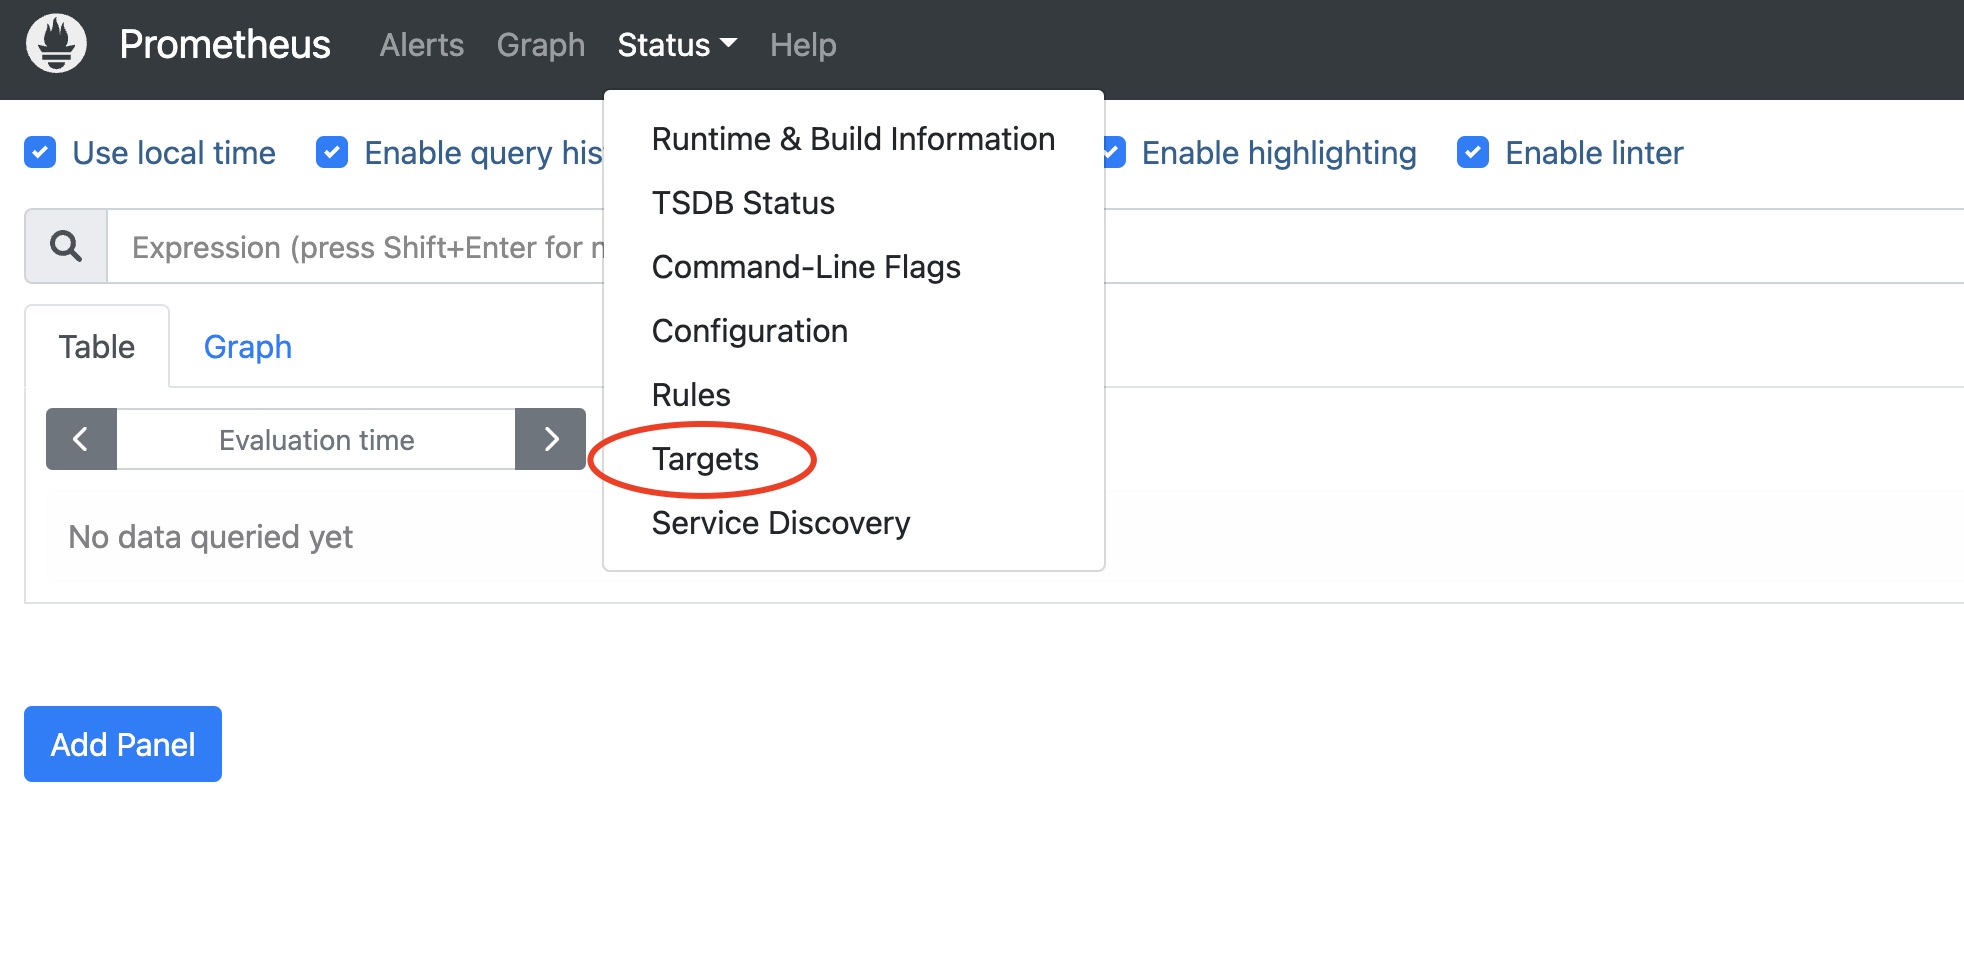
Select Status->Targets in the Prometheus main panel
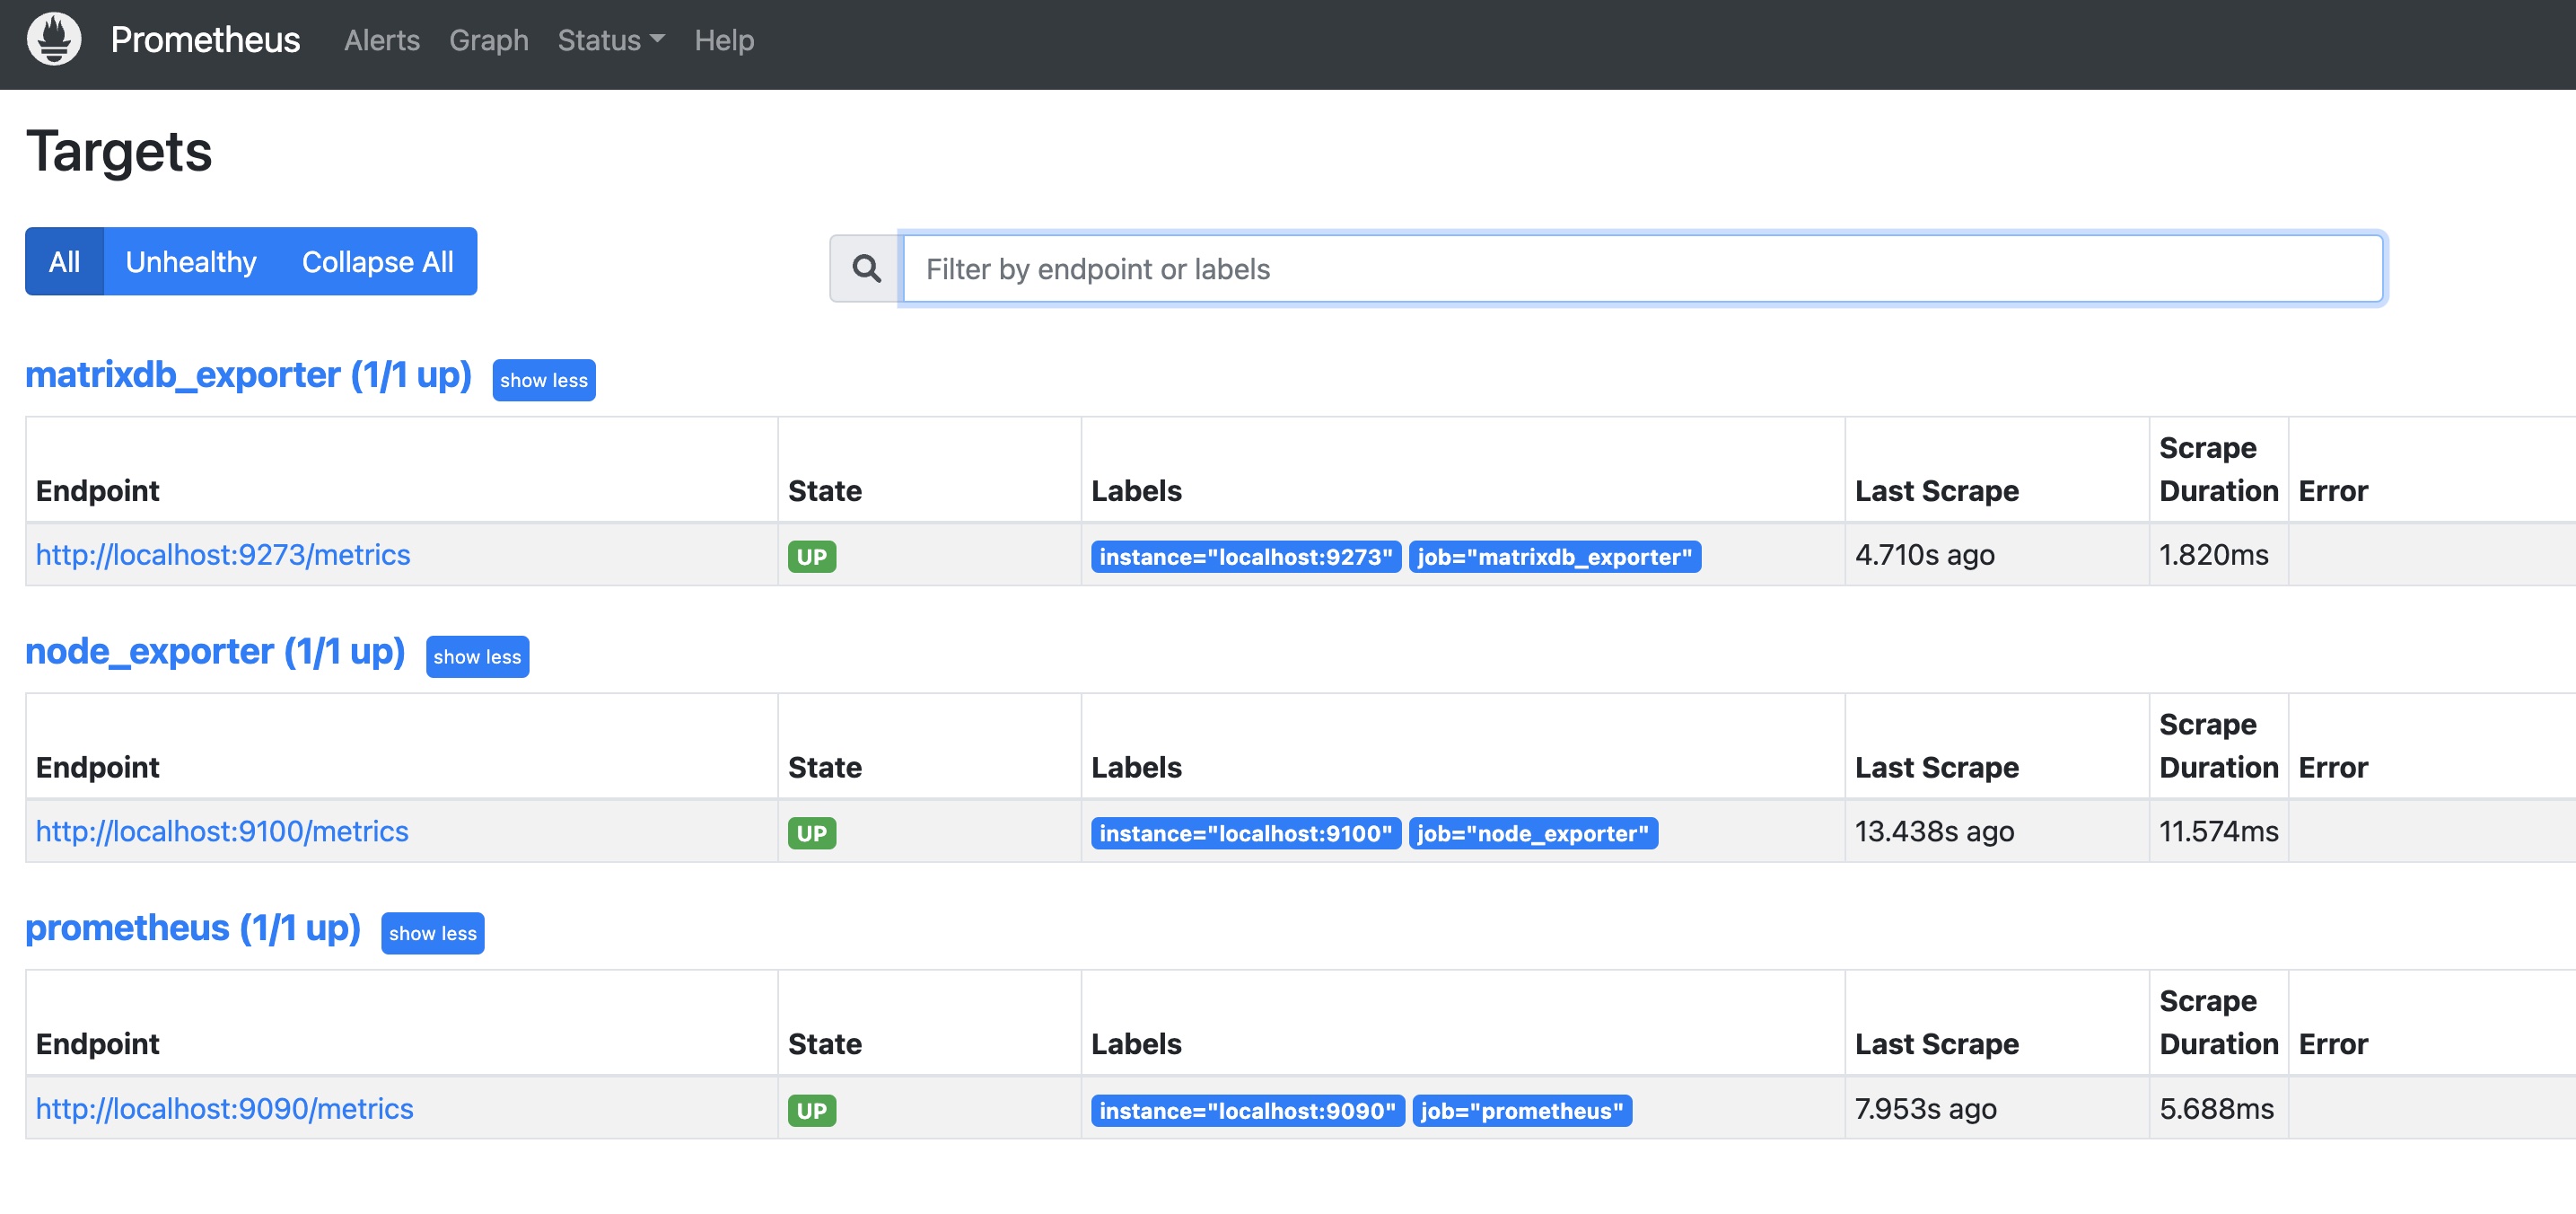
You will see that the newly configured matrixdb_exporter, node_exporter, and prometheus' own exporter status are all UP, indicating that the monitoring deployment is successful.
Prometheus is used to store monitoring data, and Grafana pulls monitoring data from Prometheus and displays it. Just like installing Prometheus, prepare a machine that can access Prometheus (Grafana and Prometheus can be installed on the same machine).
It should be noted that the Grafana version cannot be lower than 8.0.0, and the latest version is recommended. The official download and installation link is https://grafana.com/grafana/download.
The following commands describe the operation method using CentOS 7 as an example. For commands for other operating systems, please refer to the corresponding operating system usage guide (requires the root account to operate). Download and install Grafana
wget https://dl.grafana.com/enterprise/release/grafana-enterprise-8.5.5-1.x86_64.rpm
yum install grafana-enterprise-8.5.5-1.x86_64.rpm
Start Grafana
sudo systemctl daemon-reload
sudo systemctl start grafana-server
sudo systemctl status grafana-server
sudo systemctl enable grafana-server
After the installation is complete, use the browser to access the host's port 3000:
http://<安装节点的IP或者域名>:3000You can see the Grafana homepage. Log in with the default username and password (admin/admin). To ensure security, please change your password yourself.
After the installation and deployment of exporter, Prometheus, and Grafana, the dashboard is loaded to display the monitoring chart.
Each dashboard depends on a data source, so first you need to add a data source:
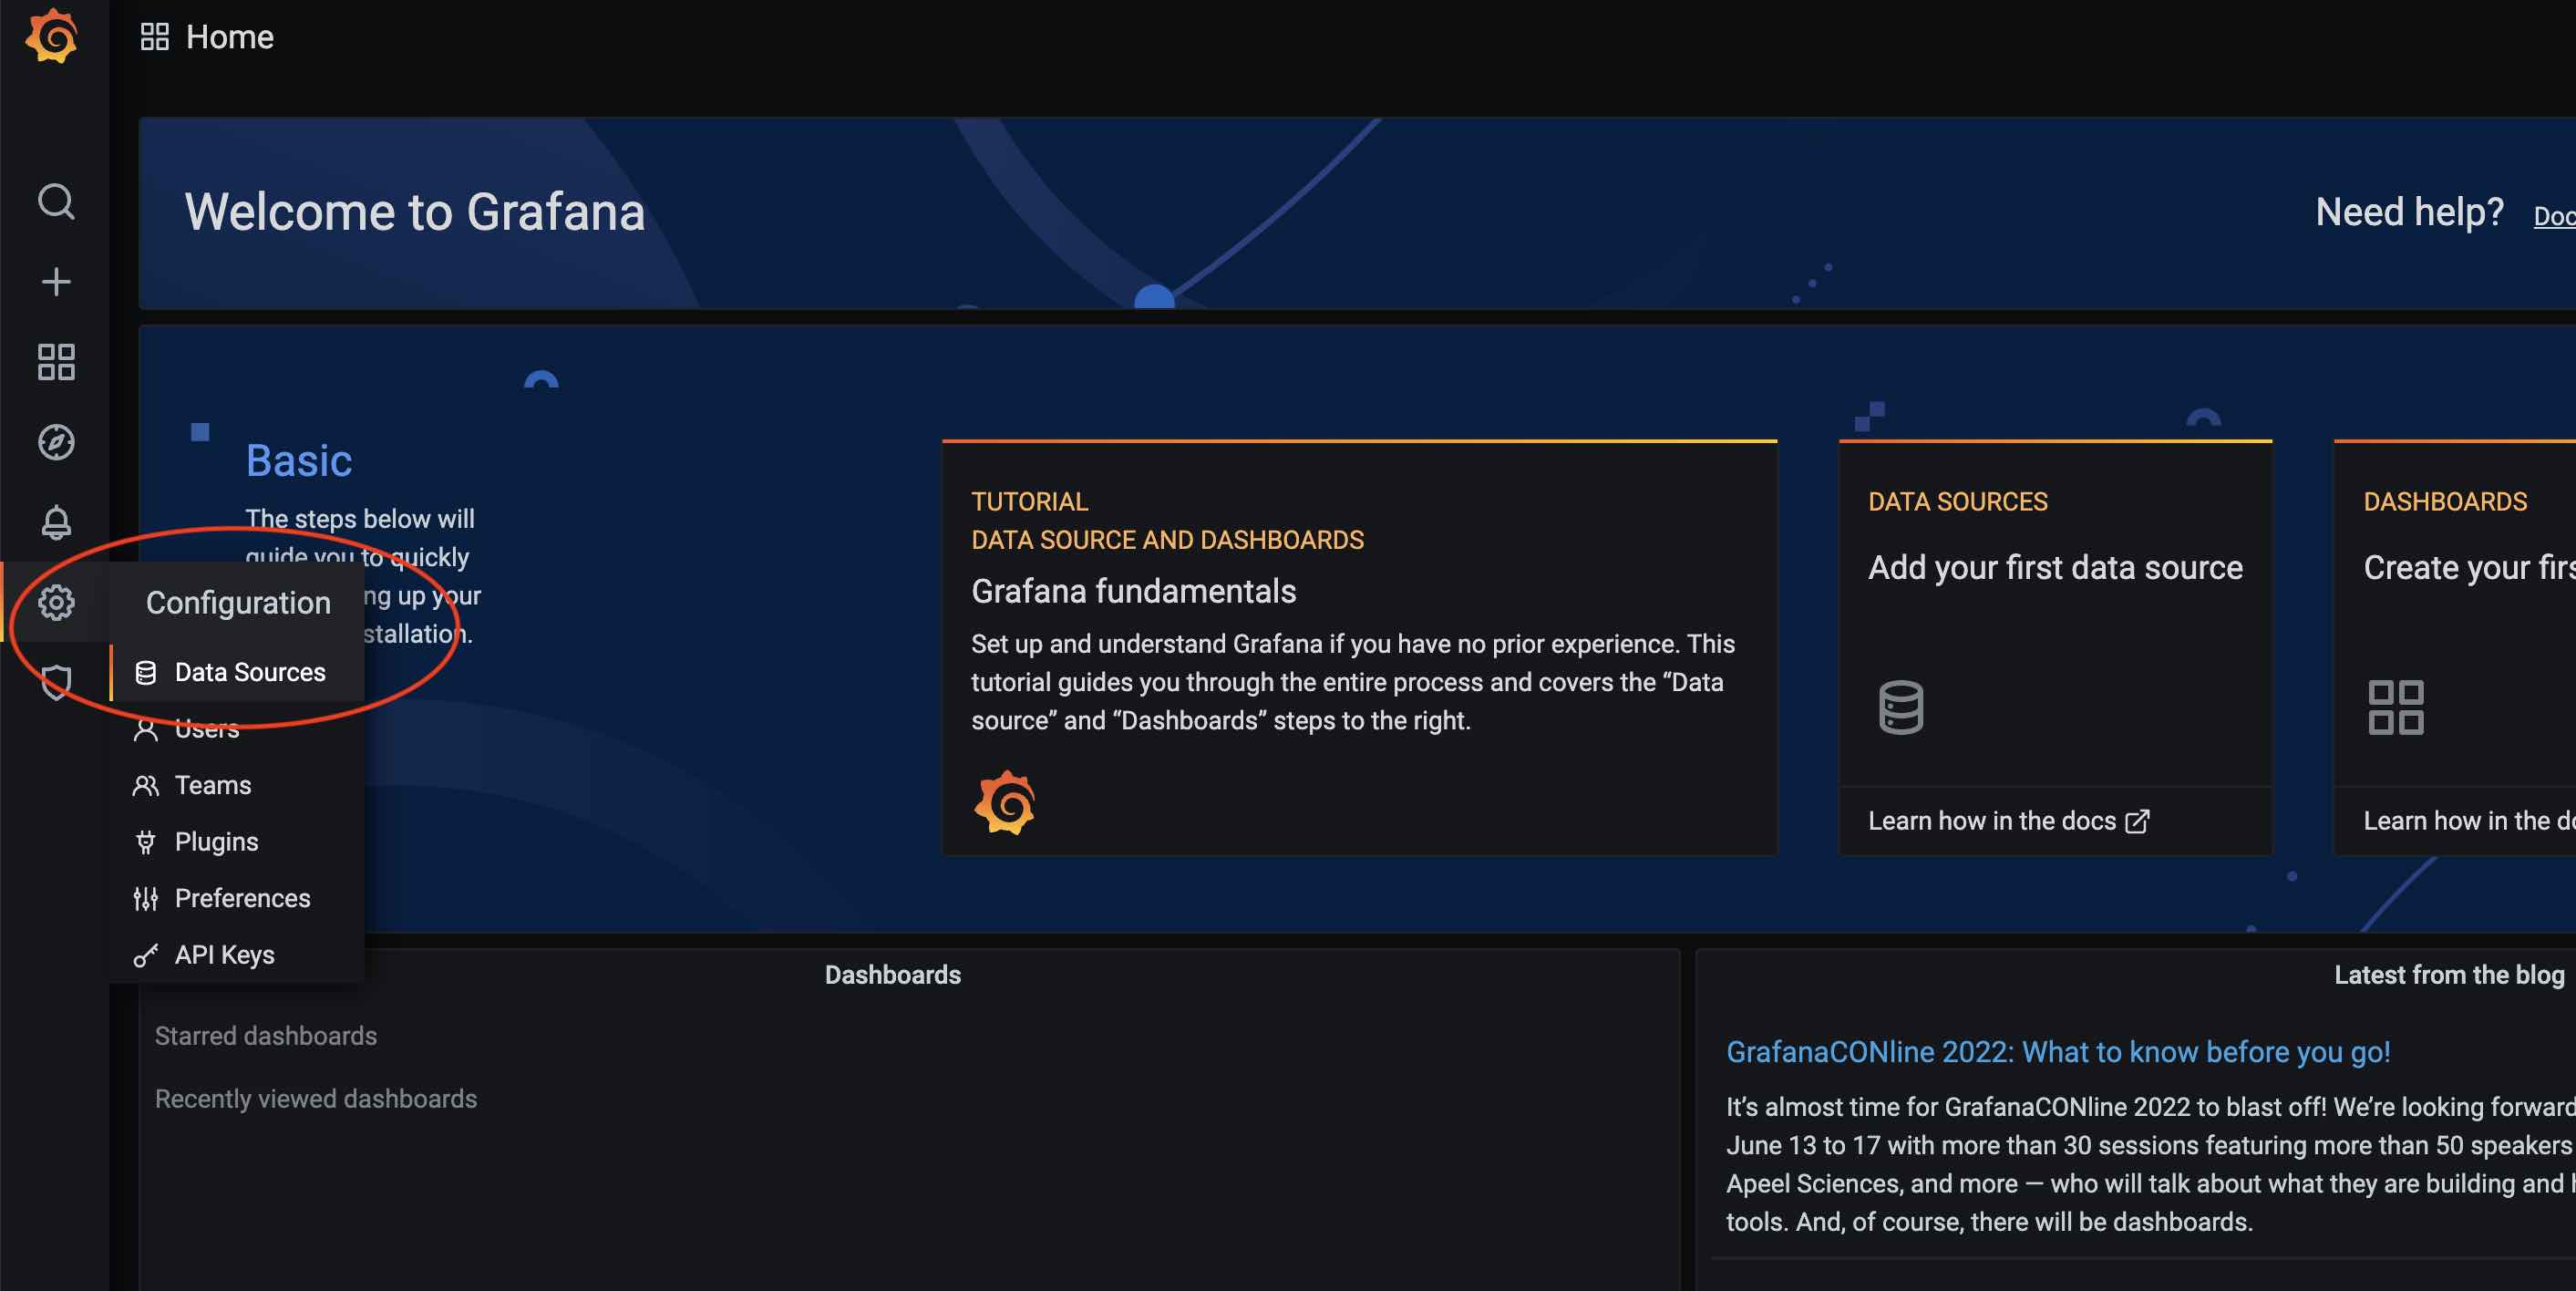
Click the Settings button on the Grafana main interface and select Data Sources:
Then click Add data source:

Select Prometheus in the database category:
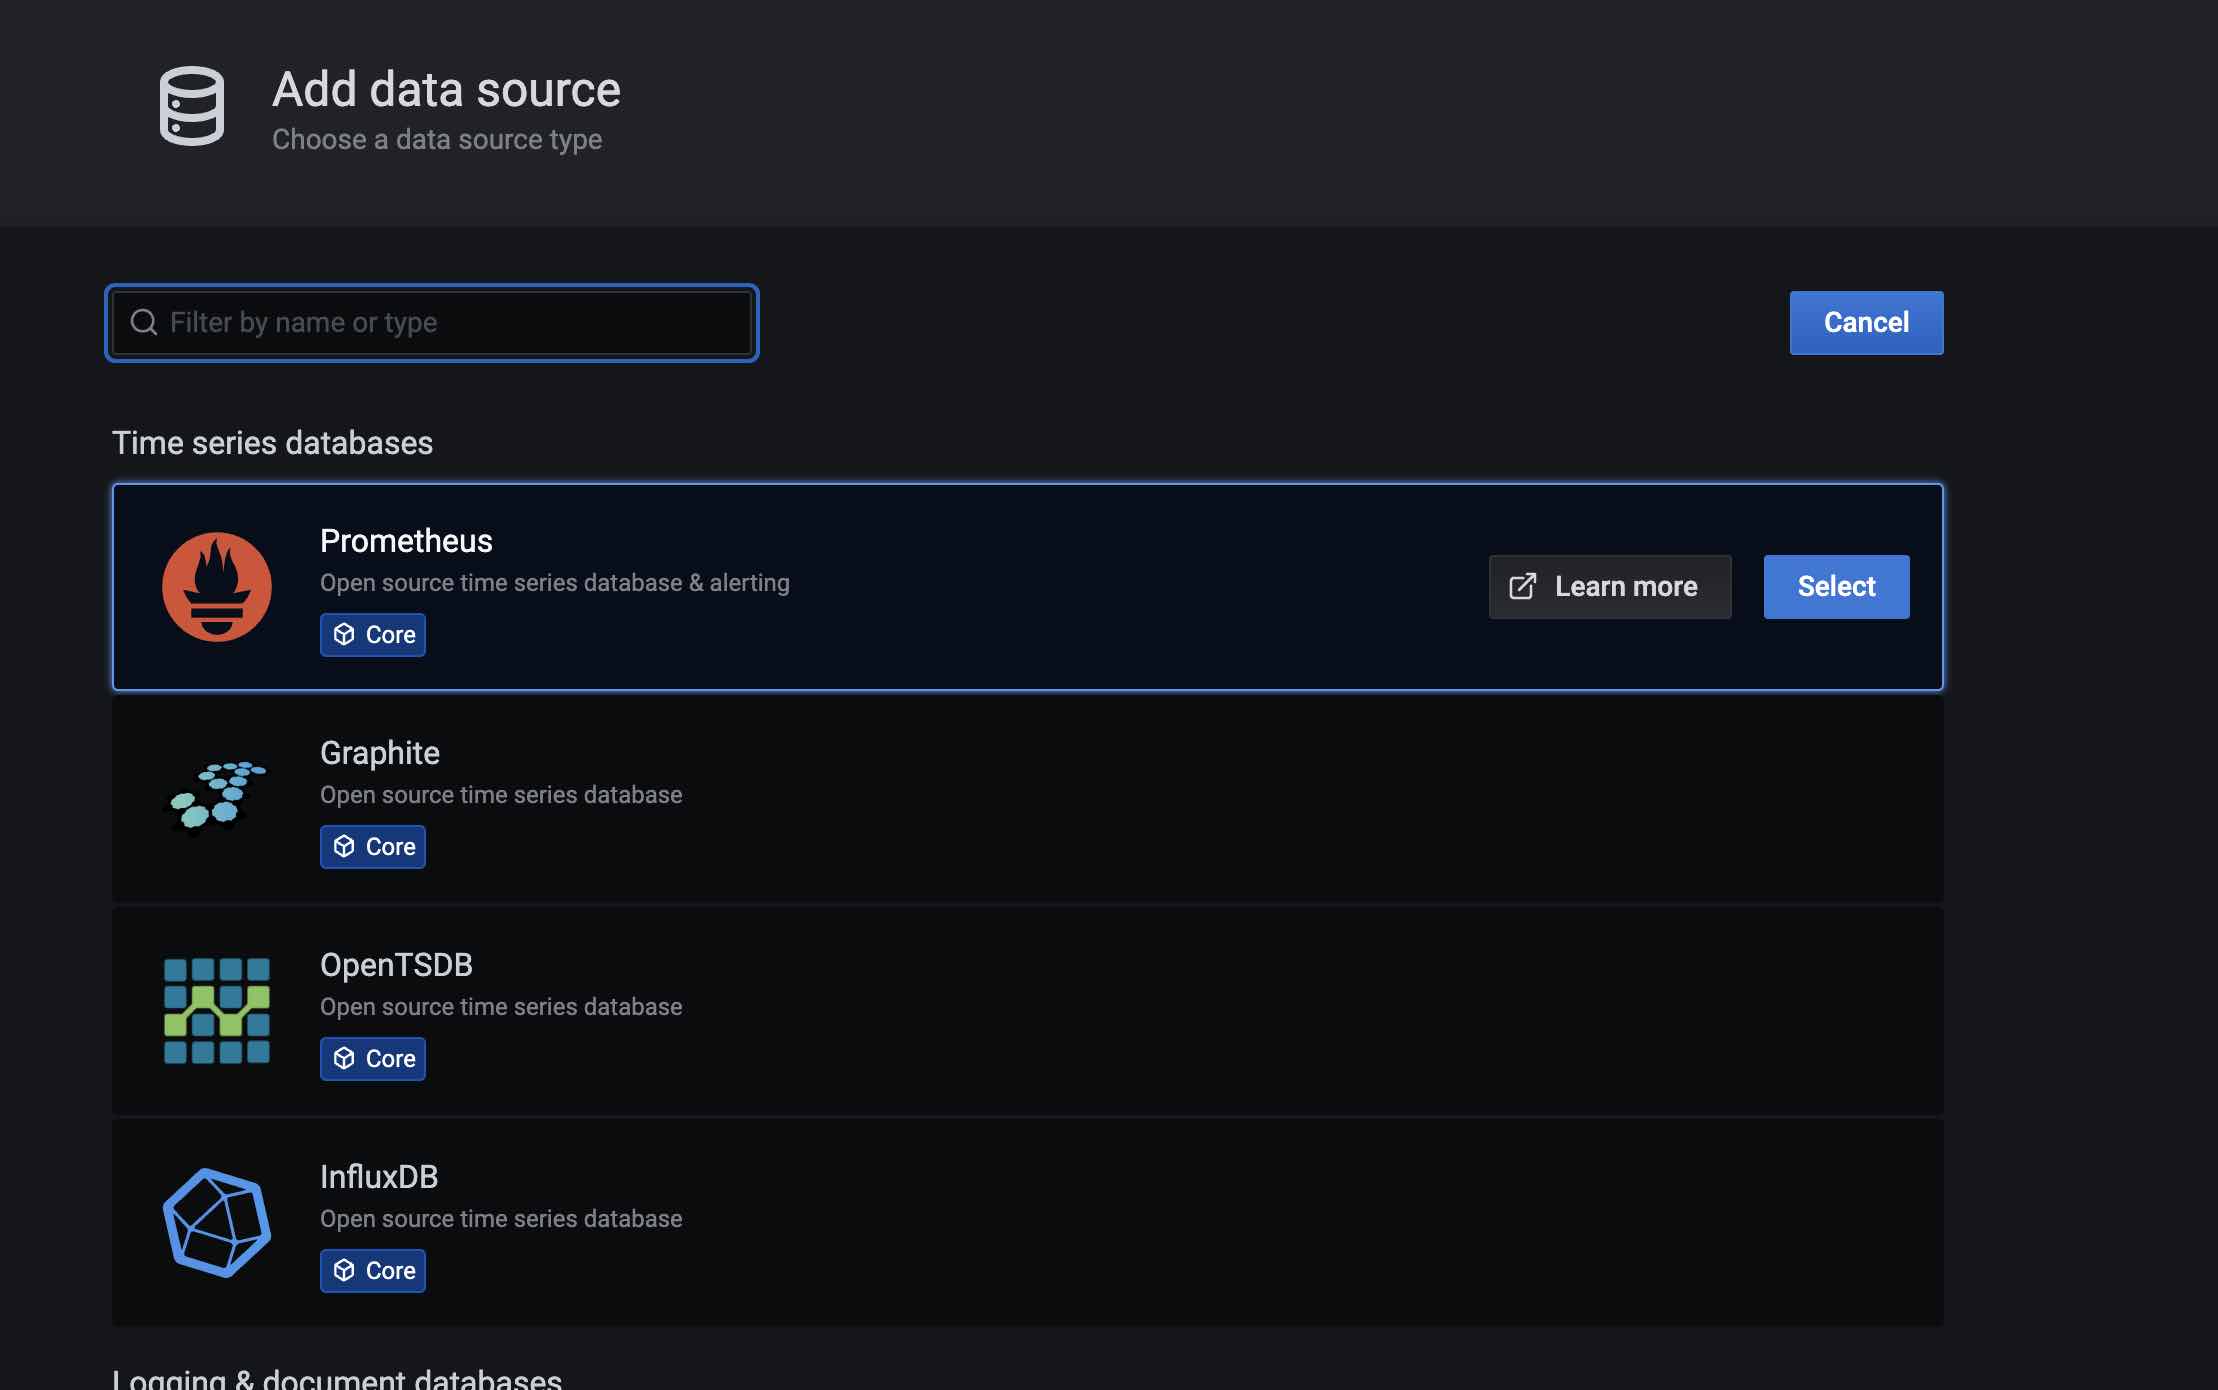
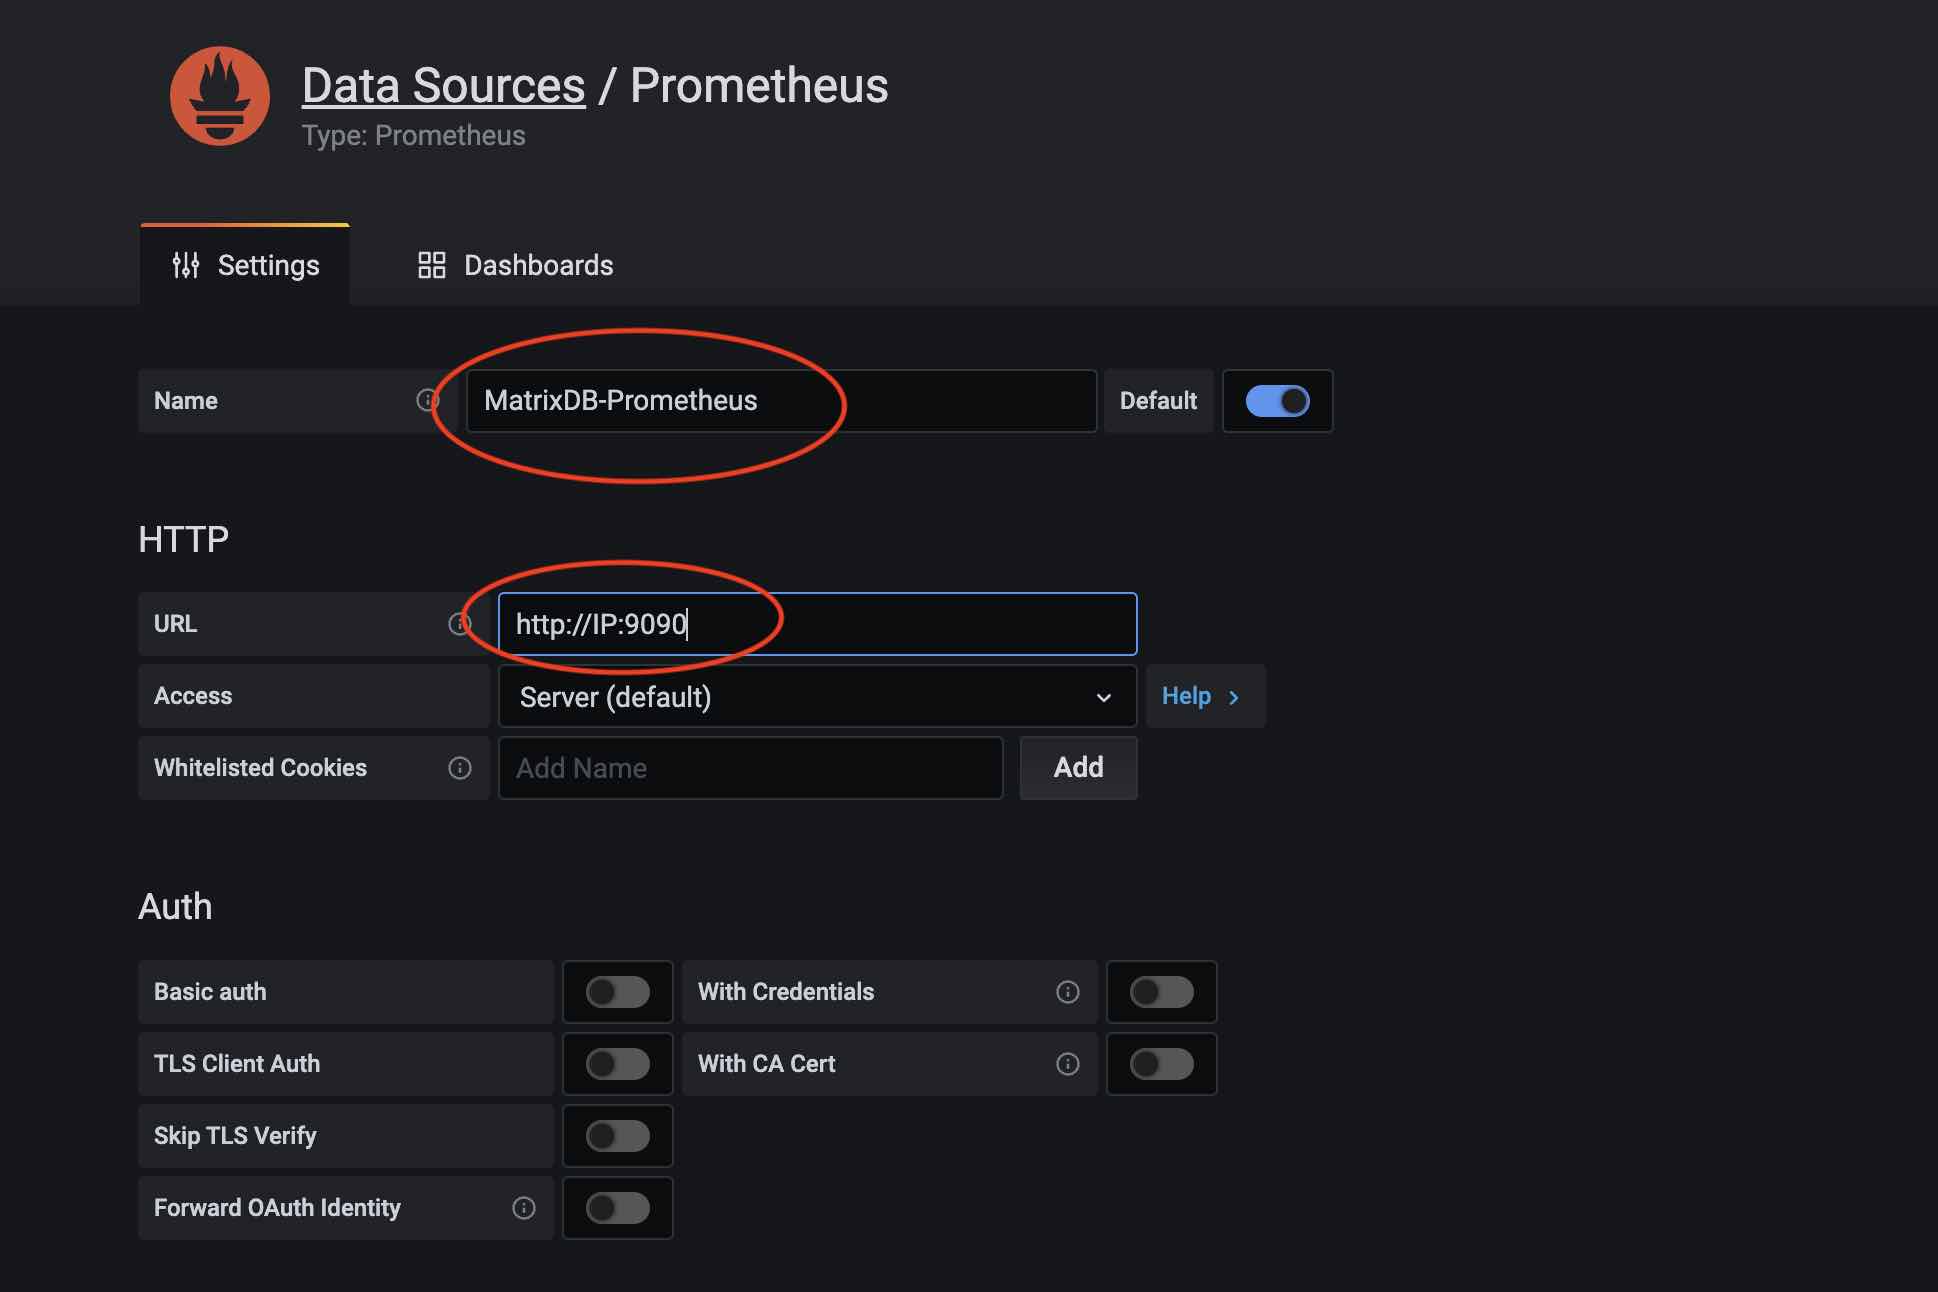
Give the data source a name in the data source name, such as: MatrixDB-Prometheus; then fill in the IP and port of Prometheus in the URL:
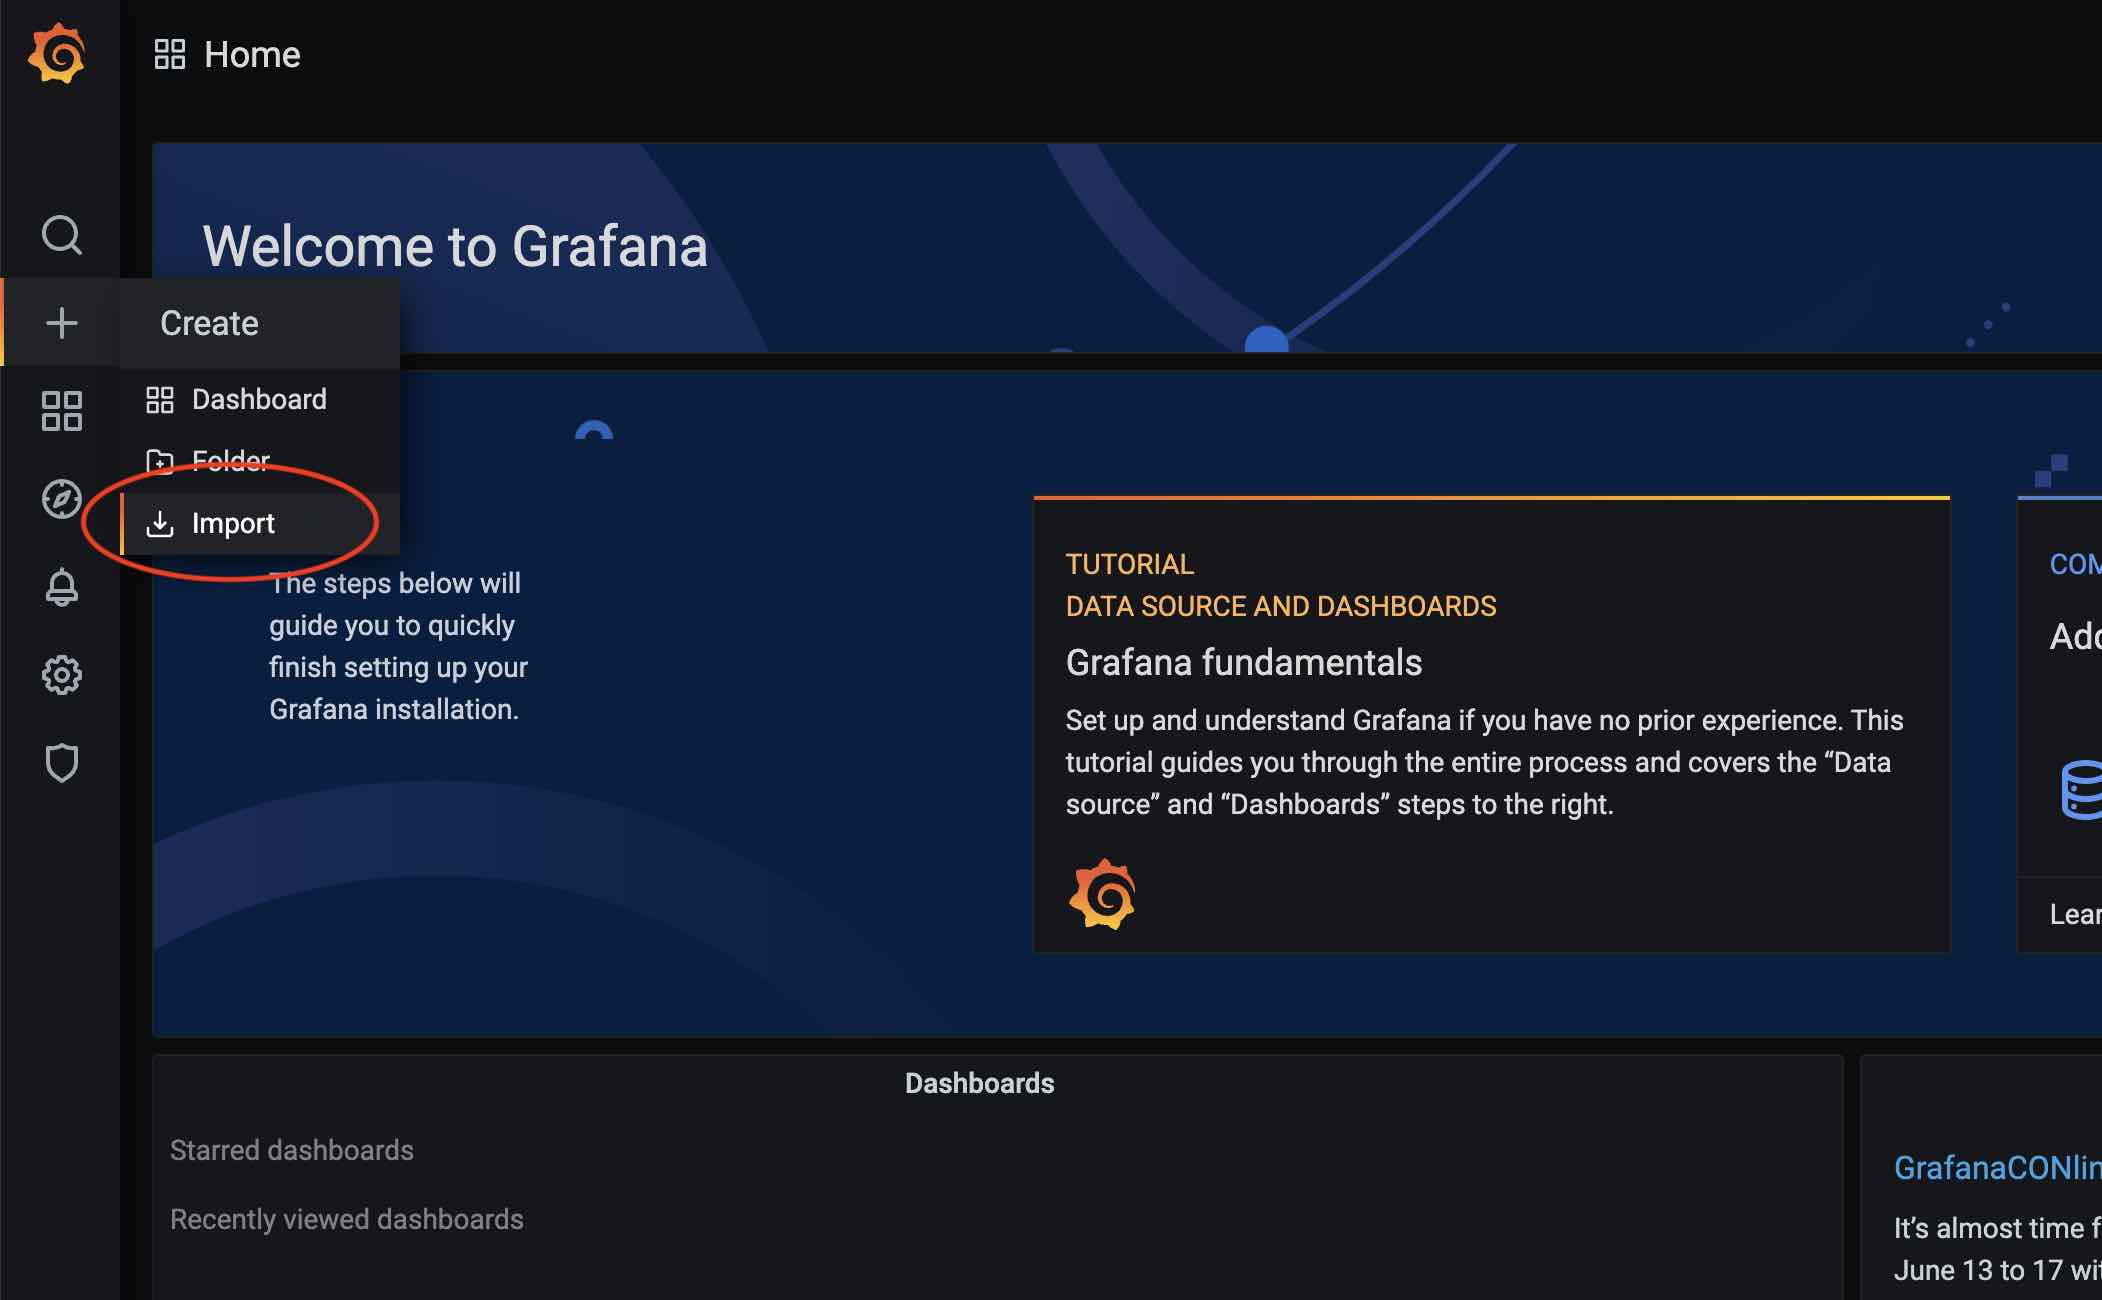
After the data source is added, the Dashboard is loaded below. Click the plus button on the grafana main panel and select Import:
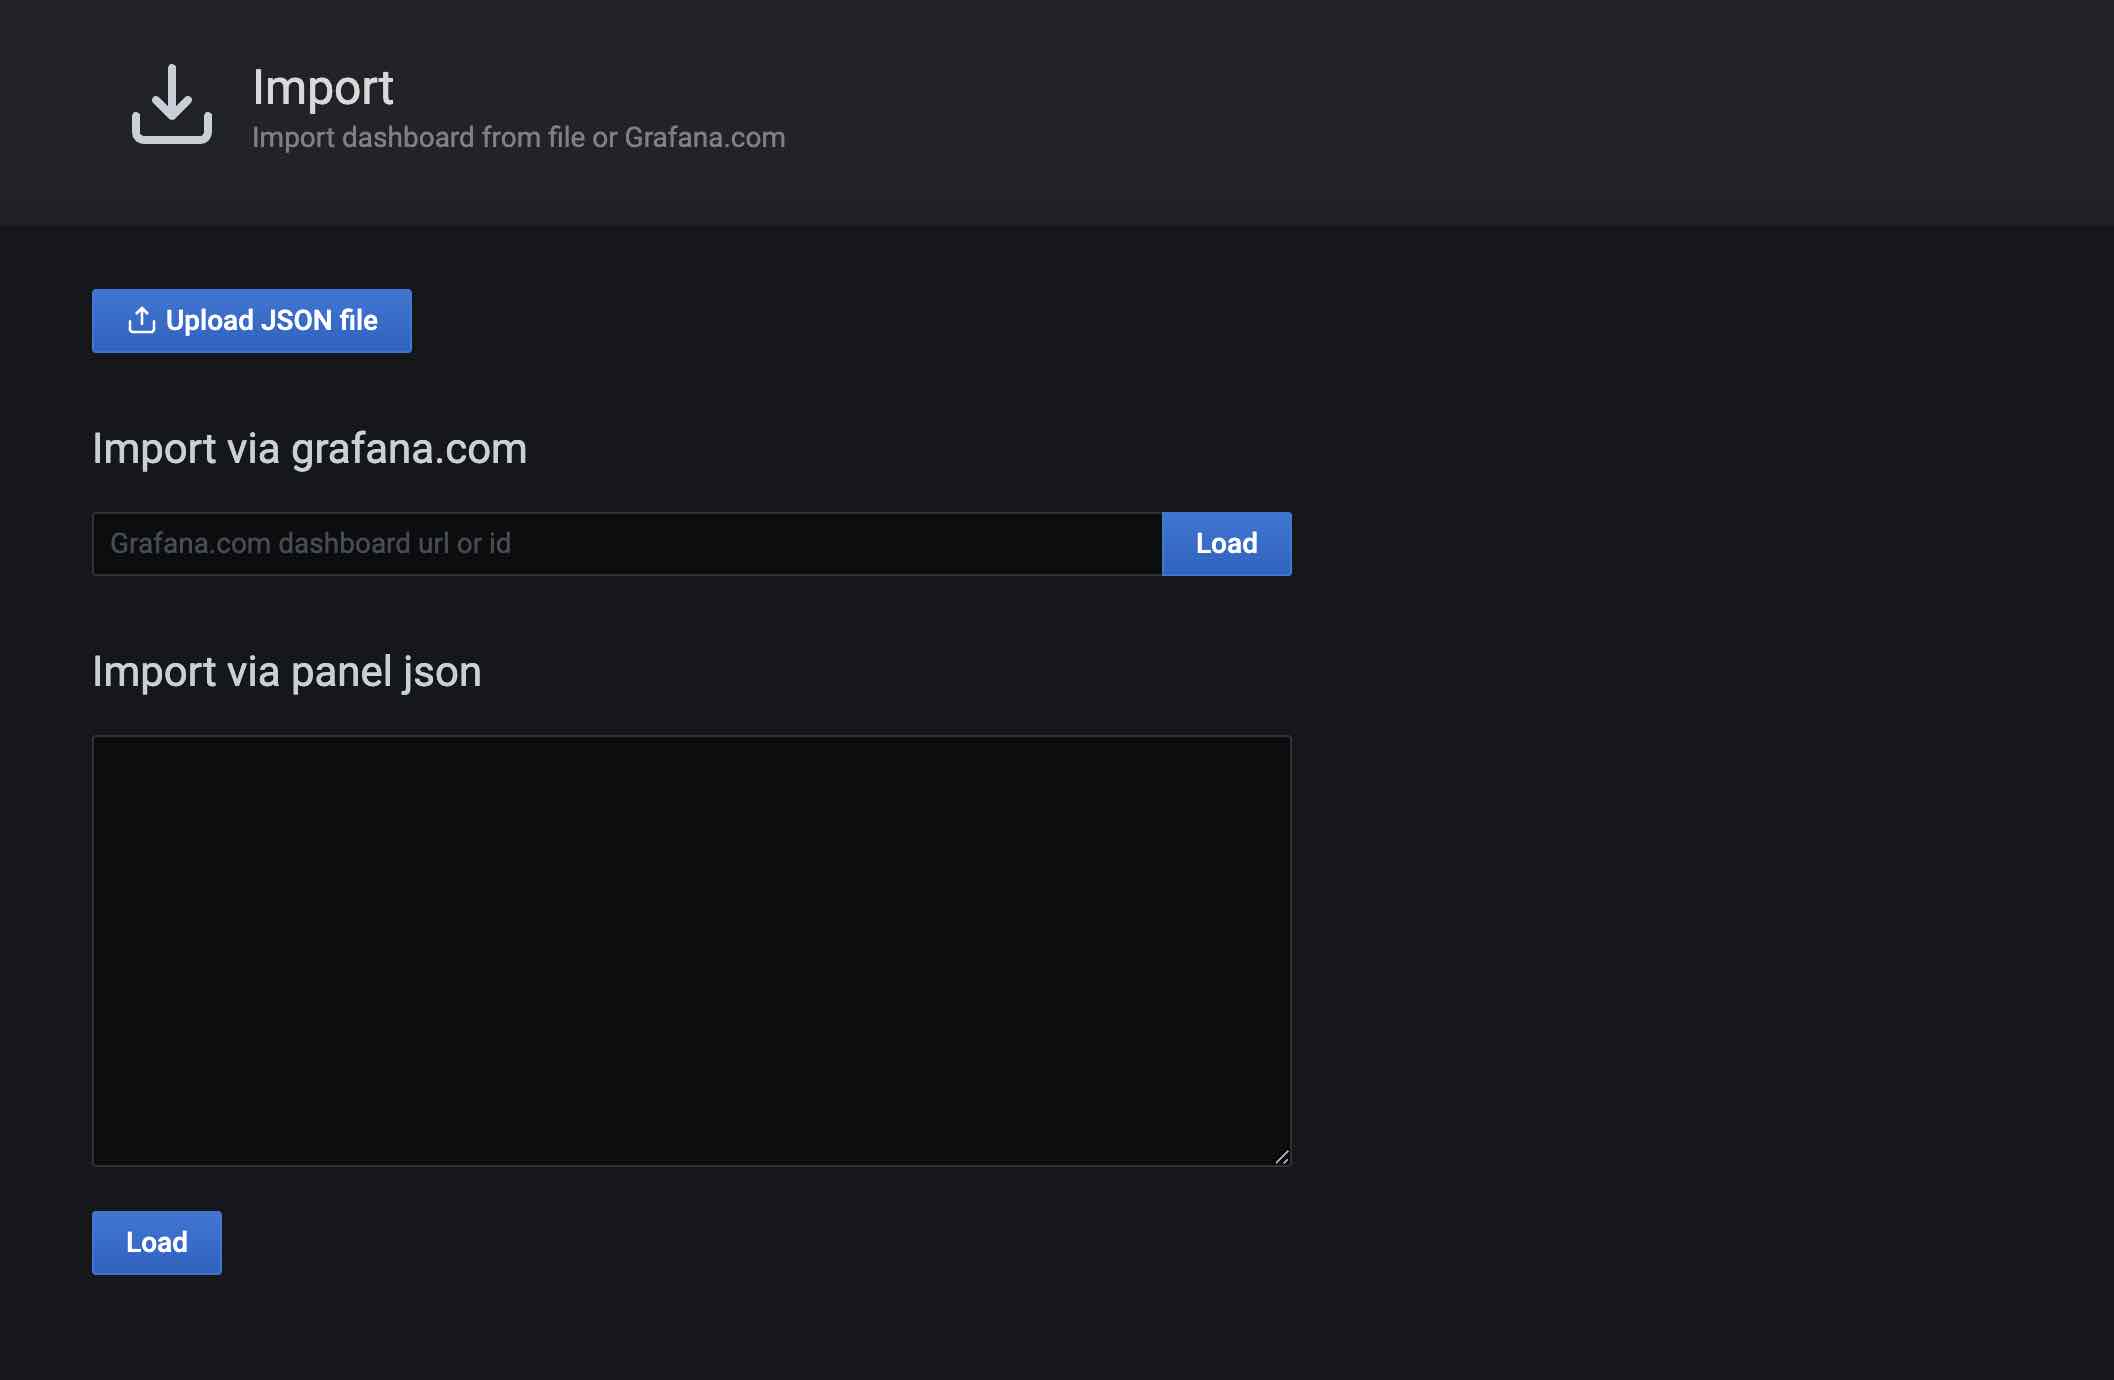
There are several ways to import: official URL or ID, paste Json into a text box, load from a file. Here we choose to load from the file, and the matrixdb's prometheus dashboard is in the installation directory $GPHOME/share/doc/postgresql/extension/PrometheusDashboard.json to load the file:
When loading the file, you need to select the Prometheus data source, and here you select the source you just created.
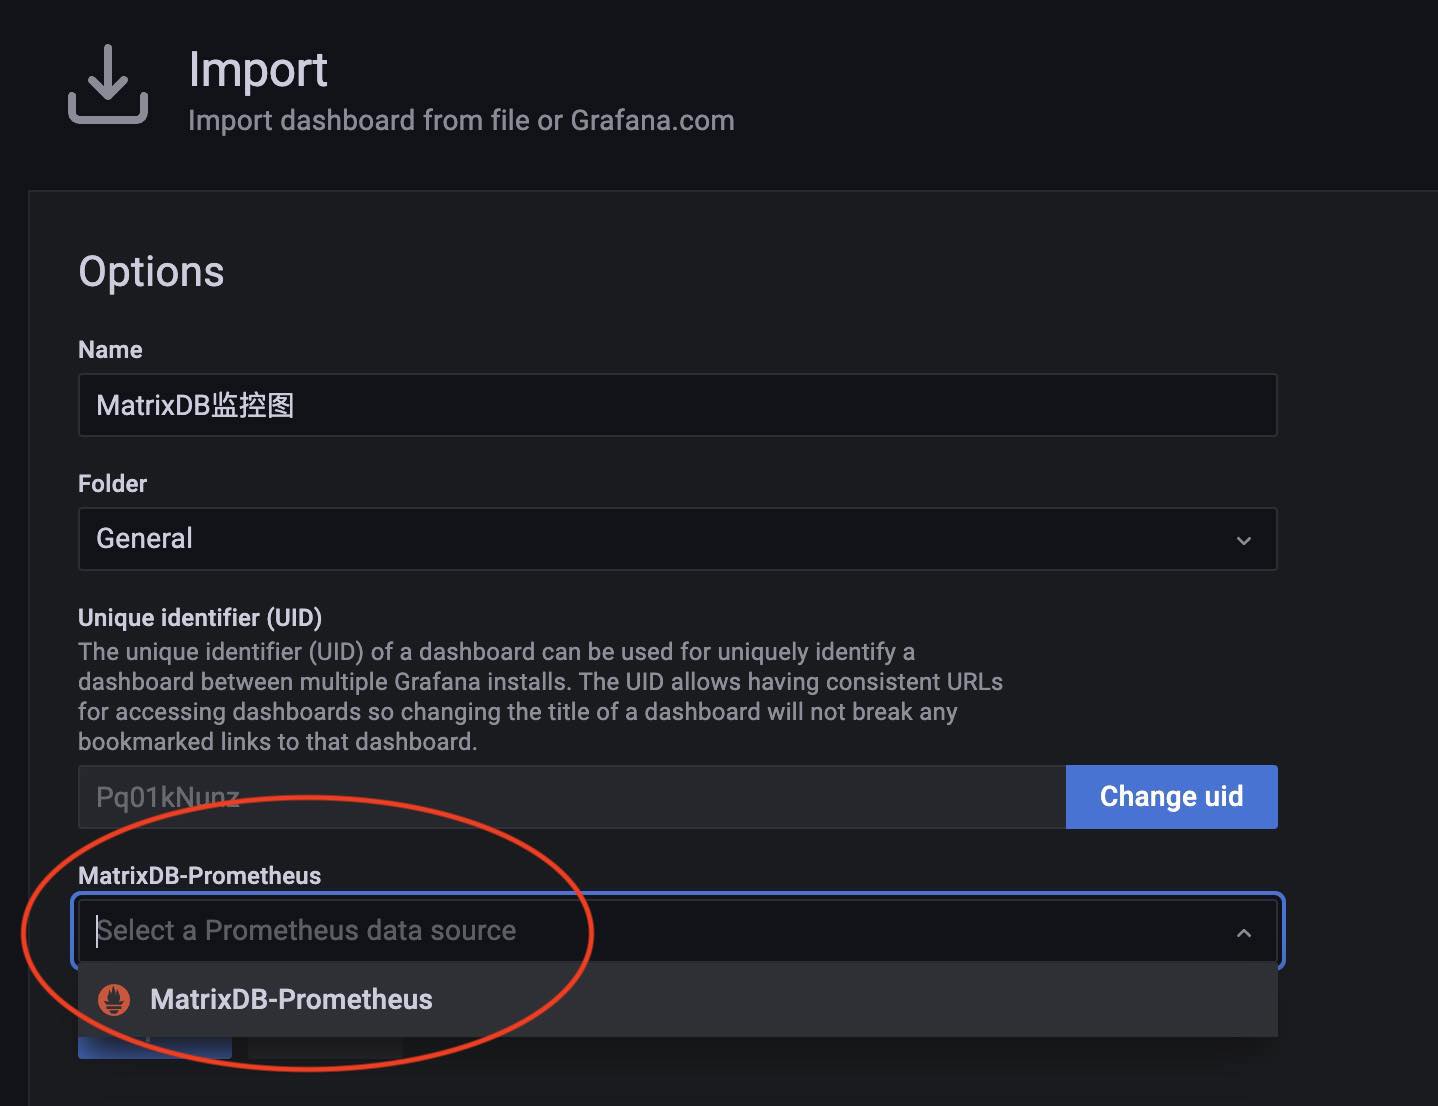
Then, you can see the panel that just loaded in the panel list.
For detailed interpretation of panel monitoring, please refer to [MatrixDB monitoring parameter interpretation] (/doc/4.6/monitor/dashboard_parameter_db)
The above steps demonstrate how to add the Prometheus dashboard for MatrixDB. The following is how to deploy the node_exporter dashboard as well.
Loading node_exporter dashboard: Because the corresponding dashboard has been published in the official website of grafana, https://grafana.com/grafana/dashboards/15202-node-exporter, just fill in the ID to load.
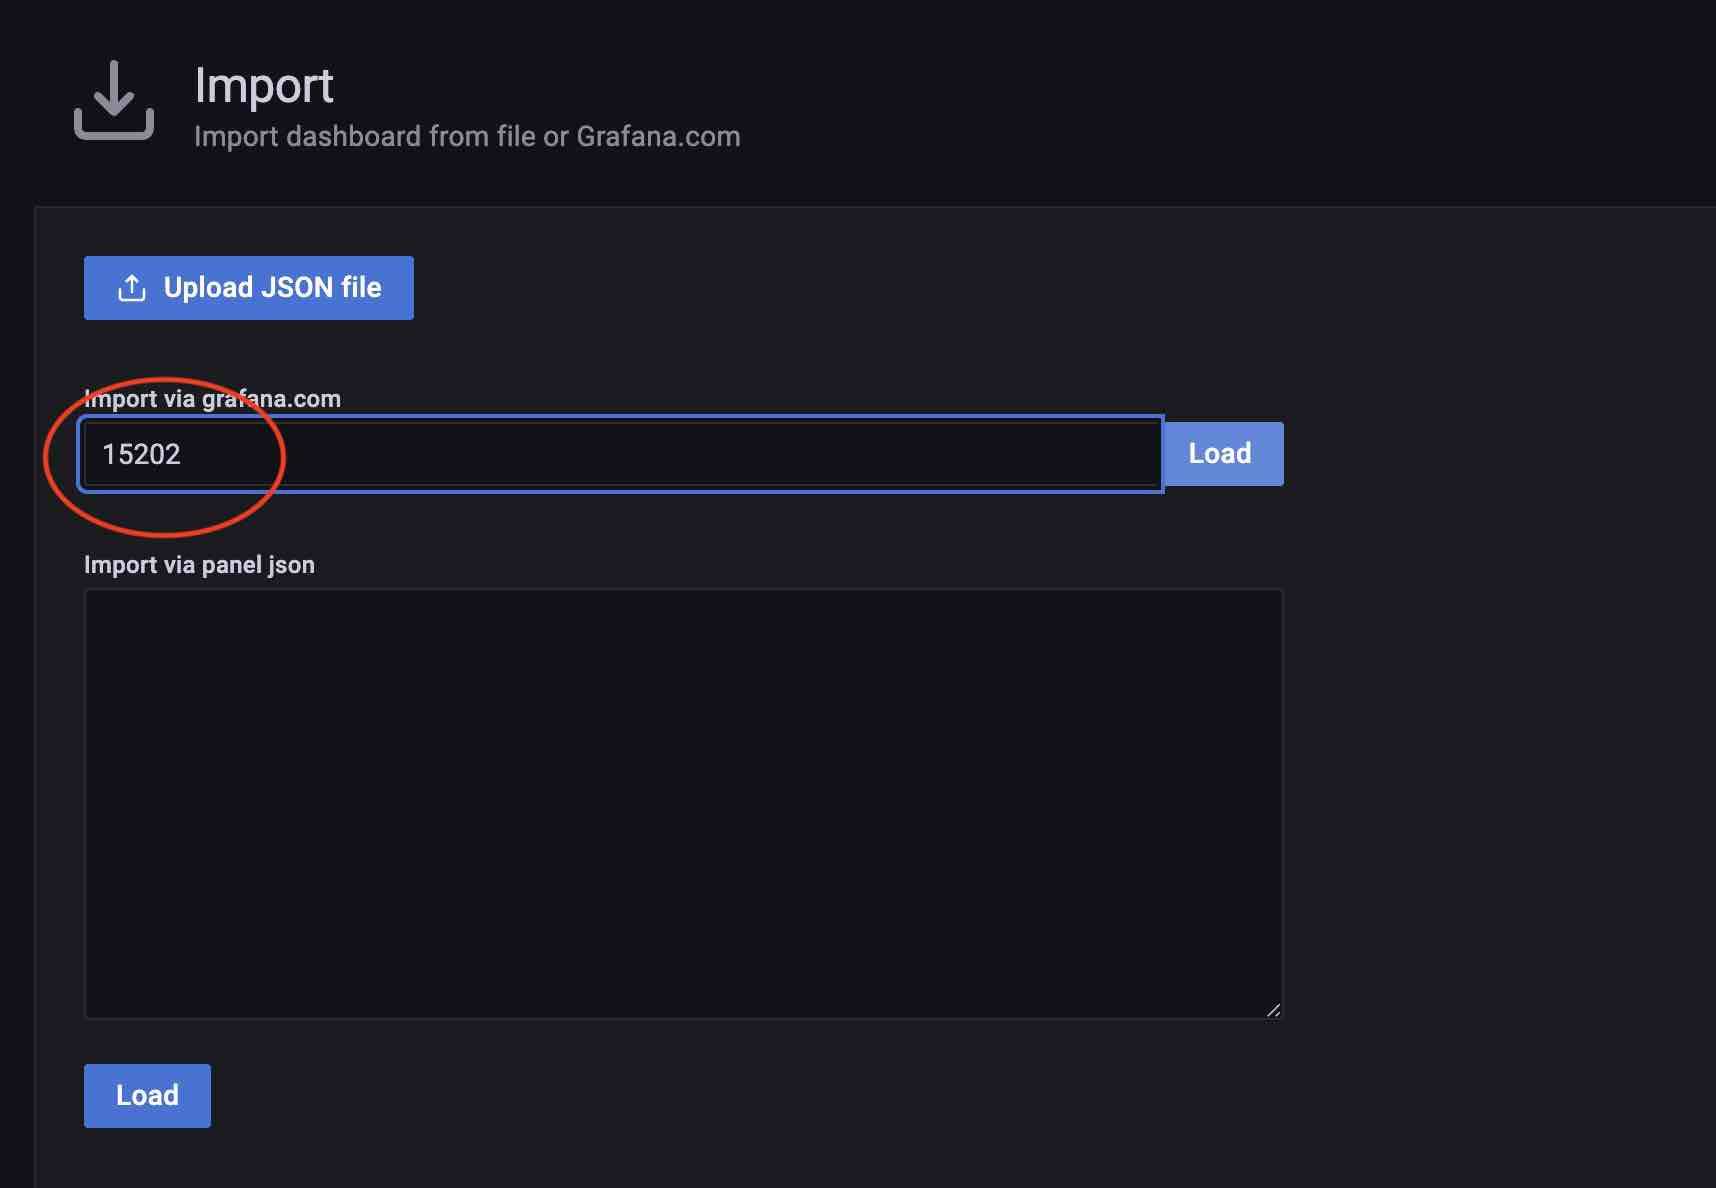
During the loading process, you need to select the data source and select the MatrixDB-Prometheus source you just added. If the node_exporter has a separate Prometheus cluster, you need to add the data source separately.

After cluster state acquisition is activated, each host will run the acquisition service and the relevant logs are saved in the /var/log/matrixdb directory.
If you restart MatrixDB, or restart the server and then start MatrixDB, the MatrixDB exporter will also start automatically without manual intervention.
To close the matrixdb exporter service, you can connect to the matrixmgr database and execute the mxmgr_remove_exporter command:
psql -d matrixmgr

matrixmgr=# SELECT mxmgr_remove_exporter();
To activate data acquisition again, connect to the matrixmgr database and execute the mxmgr_deploy_exporter command:
matrixmgr=# SELECT mxmgr_deploy_exporter();Note: mxmgr_remove_exporter will only close the matrixdb exporter.
node_exporter, grafana, prometheus needs to be closed separately.
The old monitoring system has been upgraded to a new monitoring that connects to the Prometheus ecosystem.
First complete the Prometheus installation and deployment and upgrade Grafana to the latest version:
# Turn off the old monitor first
psql -d matrixmgr
matrixmgr=# SELECT mxmgr_remove_all('local');

# Initialize and start a new monitoring
matrixmgr=# SELECT mxmgr_init_exporter();
Note: New and old monitoring can also be deployed at the same time, that is, new monitoring can be started without shutting down the old monitoring, but it is a bit redundant.
As a high-performance data access component, MatrixGate is also compatible with the Prometheus monitoring ecosystem. Normally, MatrixDB monitoring data and MatrixGate monitoring data are stored in the same Prometheus system, and the following operation steps are also assumptions.
Like MatrixDB exporter, deploying gate exporter also requires creating a matrixmgr database with matrixts and matrixmgr extensions. Here it is assumed that it has been created.
Then call mxmgr_init_gate_exporter to initialize and start:
matrixmgr=# SELECT mxmgr_init_gate_exporter();After success, you can observe that a new pattern called "gate_exporter" appears under the matrixmgr database. Tables and views in this mode contains gate monitoring and configuration information. Do not change the definitions and contents of these tables and views by yourself.
This command starts gate_exporter on the master host.
To close gate_exporter, execute mxmgr_remove_gate_exporter:
matrixmgr=# SELECT mxmgr_remove_gate_exporter();If you start again, execute mxmgr_deploy_gate_exporter:
matrixmgr=# SELECT mxmgr_deploy_gate_exporter();Just like loading the MatrixDB monitoring panel, the MatrixGate panel file is $GPHOME/share/doc/postgresql/extension/MxgateDashboard.json, and just load the file.
For detailed interpretation of panel monitoring, please refer to [MatrixGate monitoring parameter interpretation] (/doc/4.6/monitor/dashboard_parameter_mxgate)