YMatrix
Quick Start
Connecting
Benchmarks
Deployment
Data Usage
Data Ingestion
Data Migration
Data Query
Manage Clusters
Upgrade
Global Maintenance
Expansion
Monitoring
Security
Best Practice
Technical Principles
Data Type
Storage Engine
Execution Engine
Streaming Engine(Domino)
MARS3 Index
Extension
Advanced Features
Advanced Query
Federal Query
Grafana
Backup and Restore
Disaster Recovery
Graph Database
Introduction
Clauses
Functions
Advanced
Guide
Performance Tuning
Troubleshooting
Tools
Configuration Parameters
SQL Reference
This document describes how to use the YMatrix graphical interface to analyze and manage active and blocked queries in the database.
While YMatrix supports business operations, it often executes a large number of queries. To facilitate daily monitoring of query execution status, the Query Monitoring feature provides real-time information about active and blocked queries. This helps you manage and analyze slow queries and query blocking scenarios, improving database service efficiency.
A slow query is an SQL statement whose execution time exceeds a specified threshold. Slow queries are major contributors to database performance degradation and are key targets for optimizing database access. The Query Monitoring page displays current slow queries that meet specified conditions, helping you manage and analyze them to improve database efficiency.
First, log in to the graphical interface. Enter the IP address (by default, the Master's IP) and port number of the machine where MatrixGate is running into your browser:
http://<IP>:8240
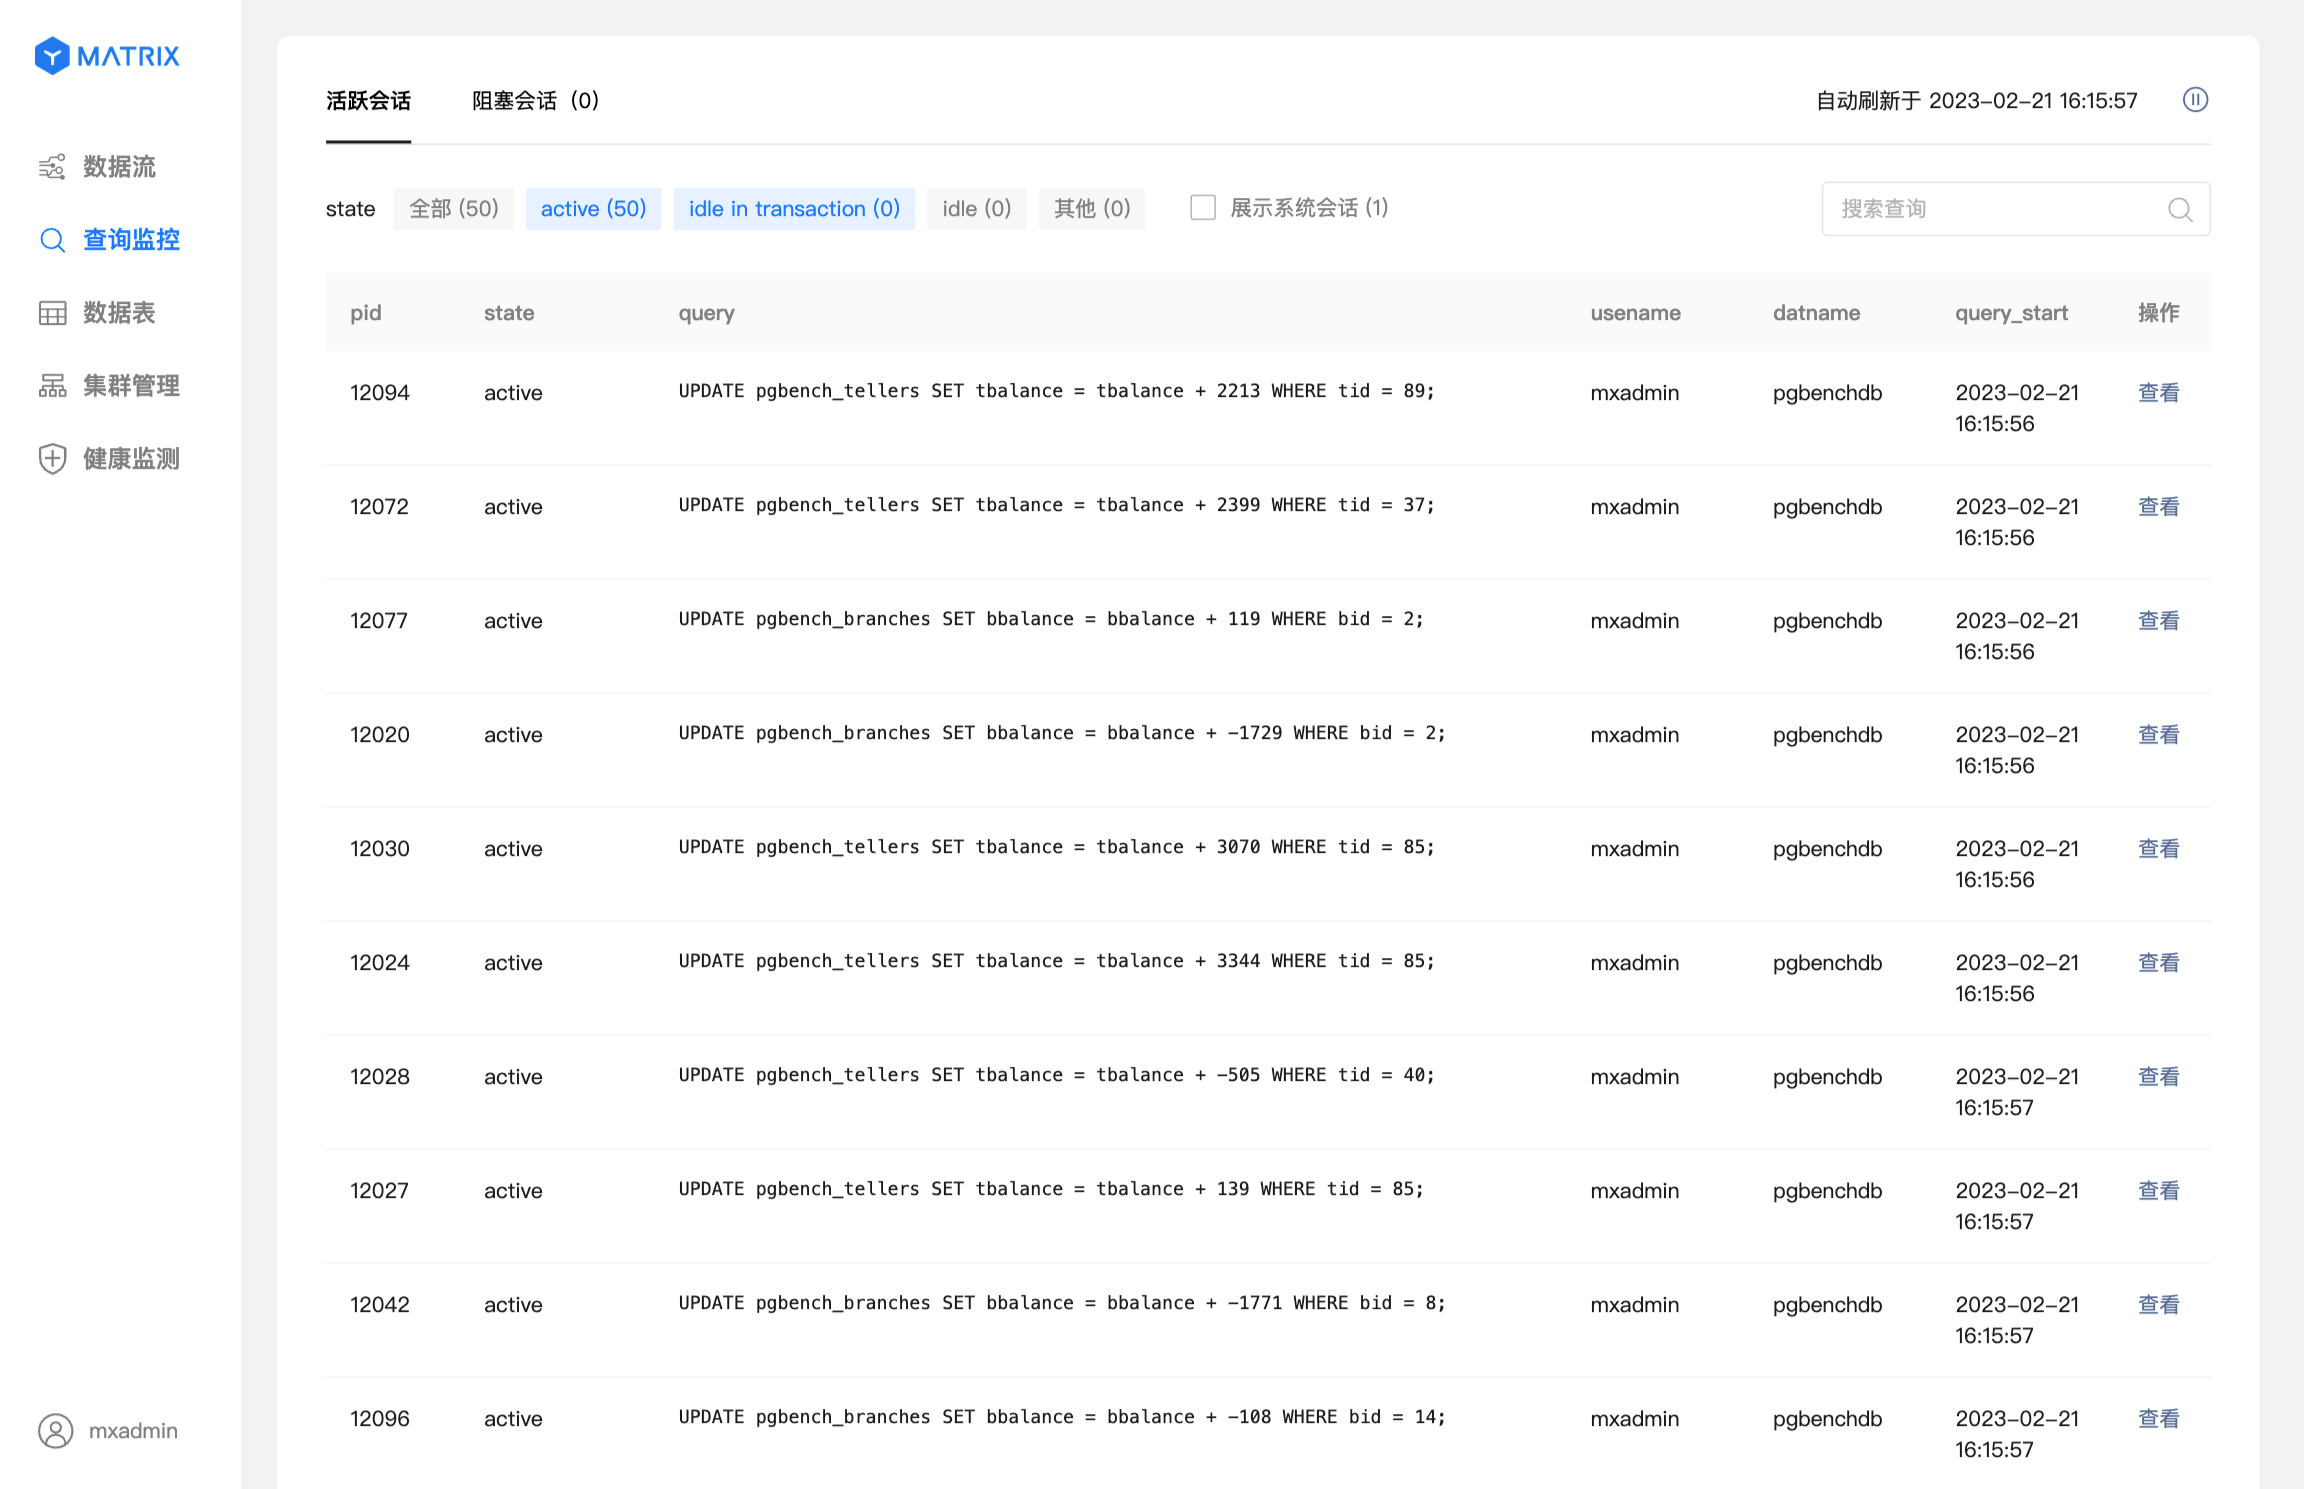
After logging in, click Query Monitoring in the left navigation panel to access the Active Sessions page.
pg_stat_activity. By default, results are sorted in descending order by query_start time. The list refreshes automatically every 10 seconds. To examine a specific entry in detail, you can pause auto-refresh to prevent the session you are viewing from being filtered out. To reduce system load caused by frequent refreshes, auto-refresh will be suspended when you exit the Query Monitoring page.active + idle in transaction states by default. You can click any state in the state column to filter the list. Each state block shows the count of 状态+ 处于该状态的会话数量.Explanation of
idle in transaction
This state indicates that the query has completed execution, but its transaction has not yet been committed or rolled back. Although queries in this state do not consume CPU or I/O resources, they occupy connection and concurrency resources. Additionally, all locks held by queries within the transaction remain active until the transaction is committed or rolled back. During this time, most queries involving tables affected by the transaction will be blocked, degrading service response times.
If a transaction remains in theidle in transactionstate for an extended period (e.g., over one hour), it is recommended to commit or roll back the transaction promptly.
Click the View button on the right side of the target session to open the query details page. This page displays all field information of the query from the pg_stat_activity table and supports terminating the session.

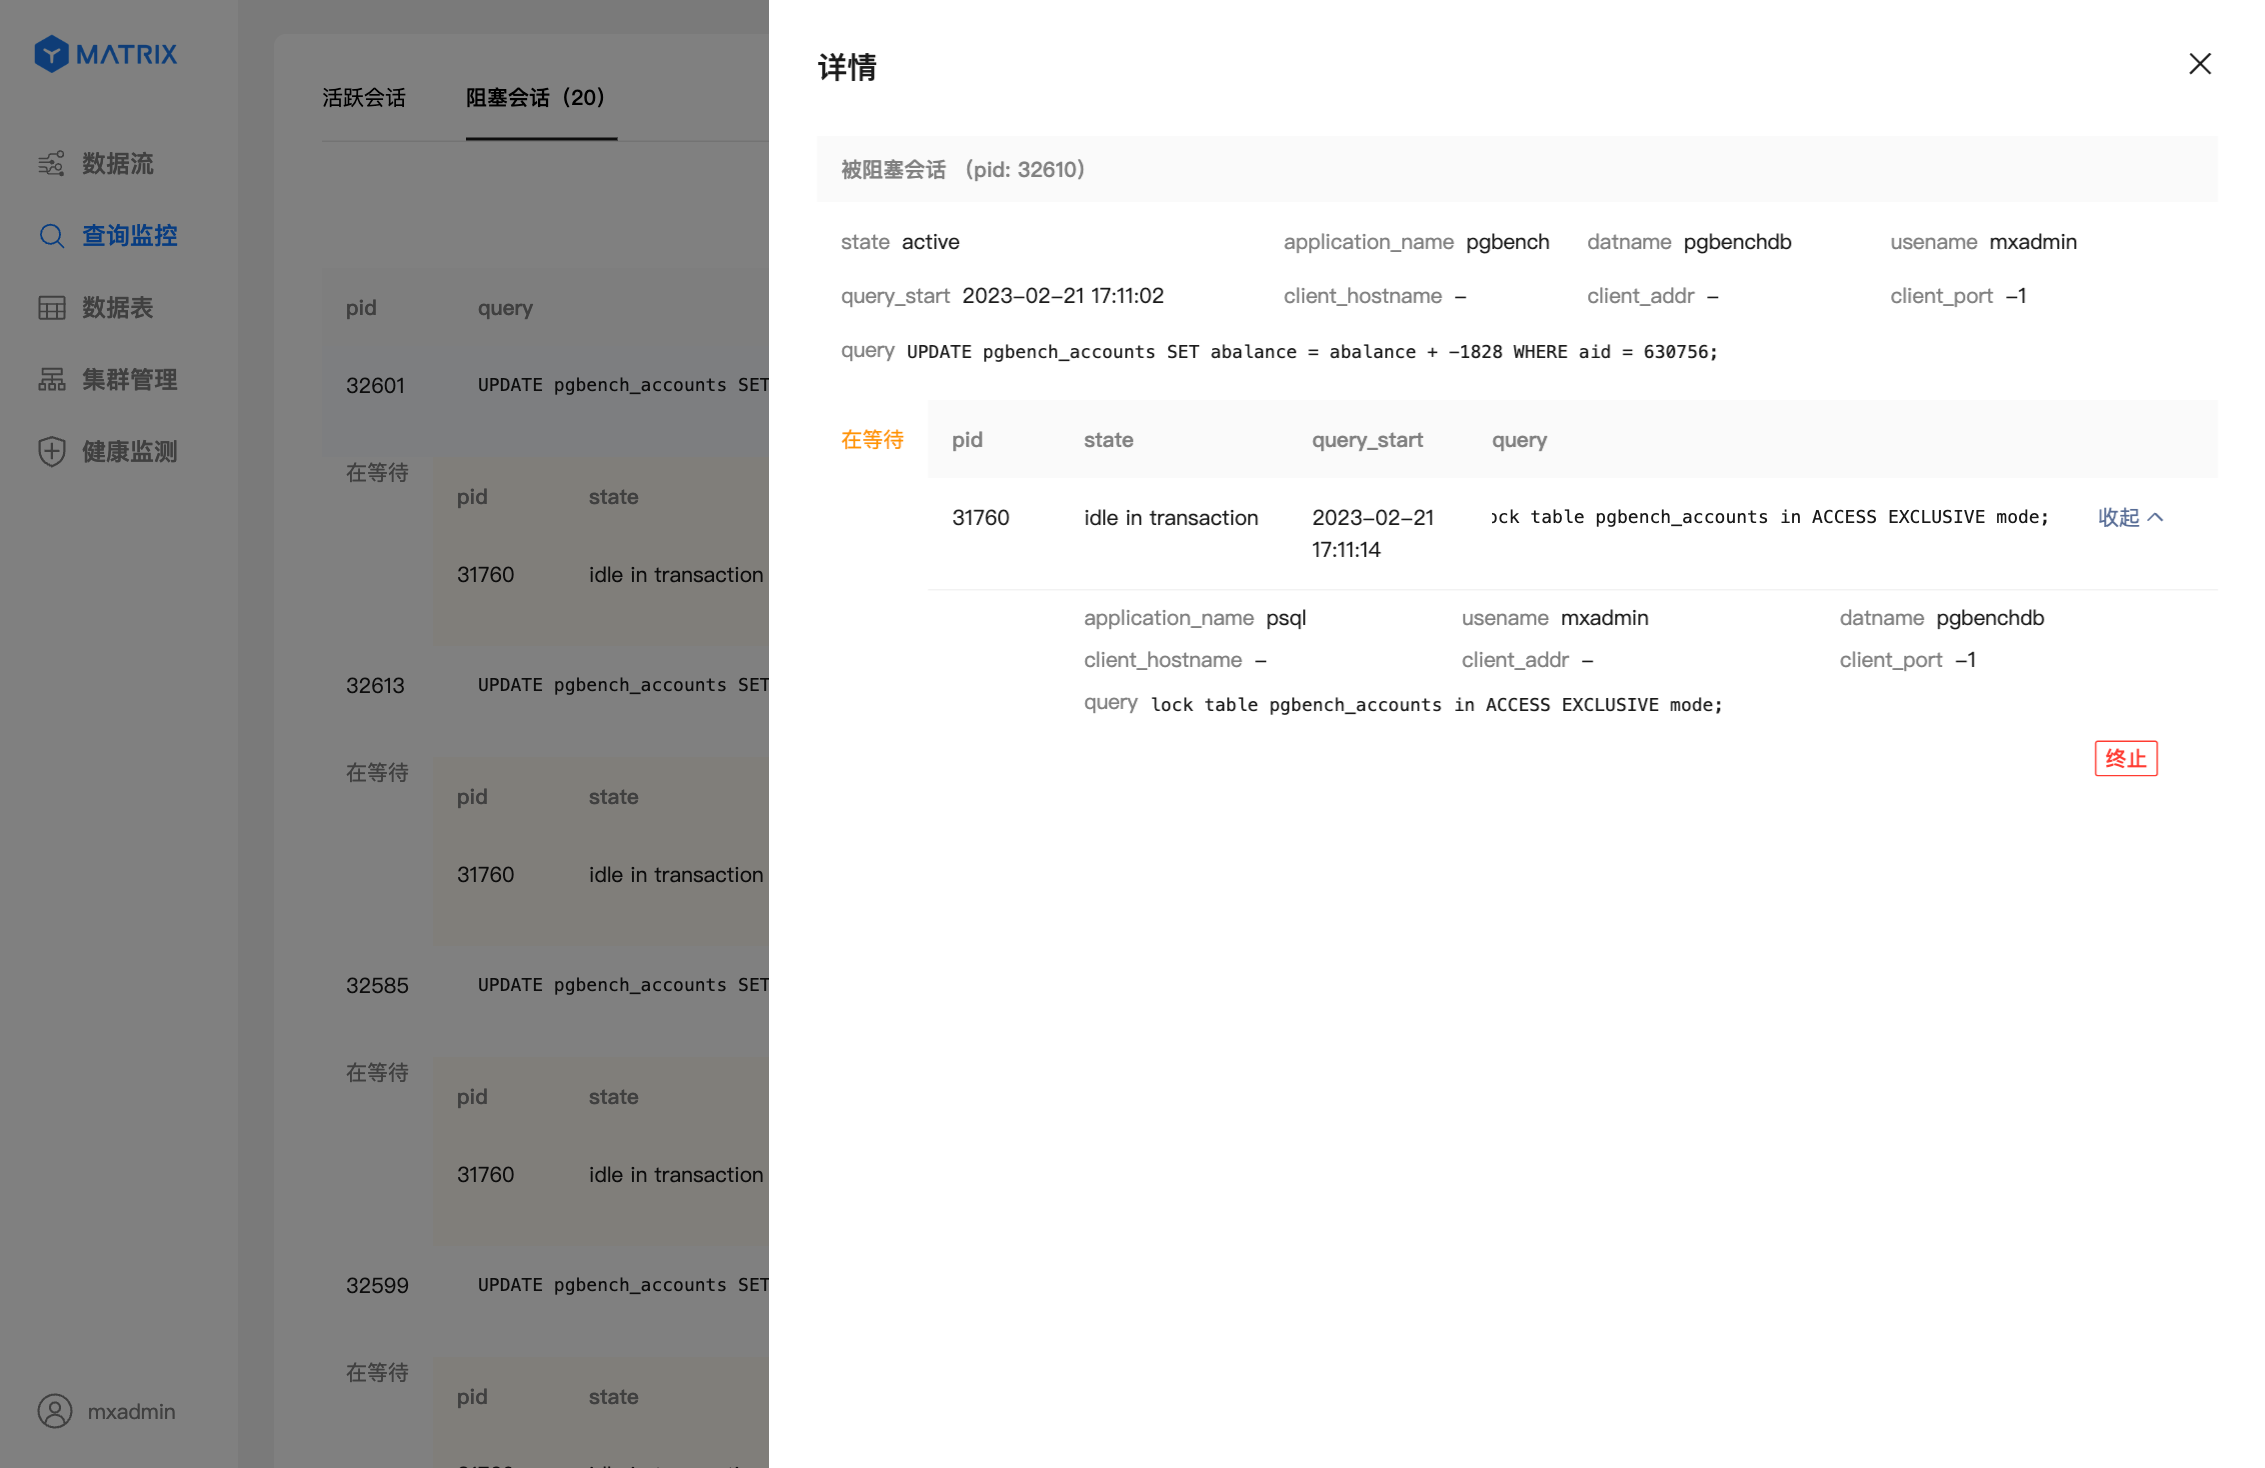
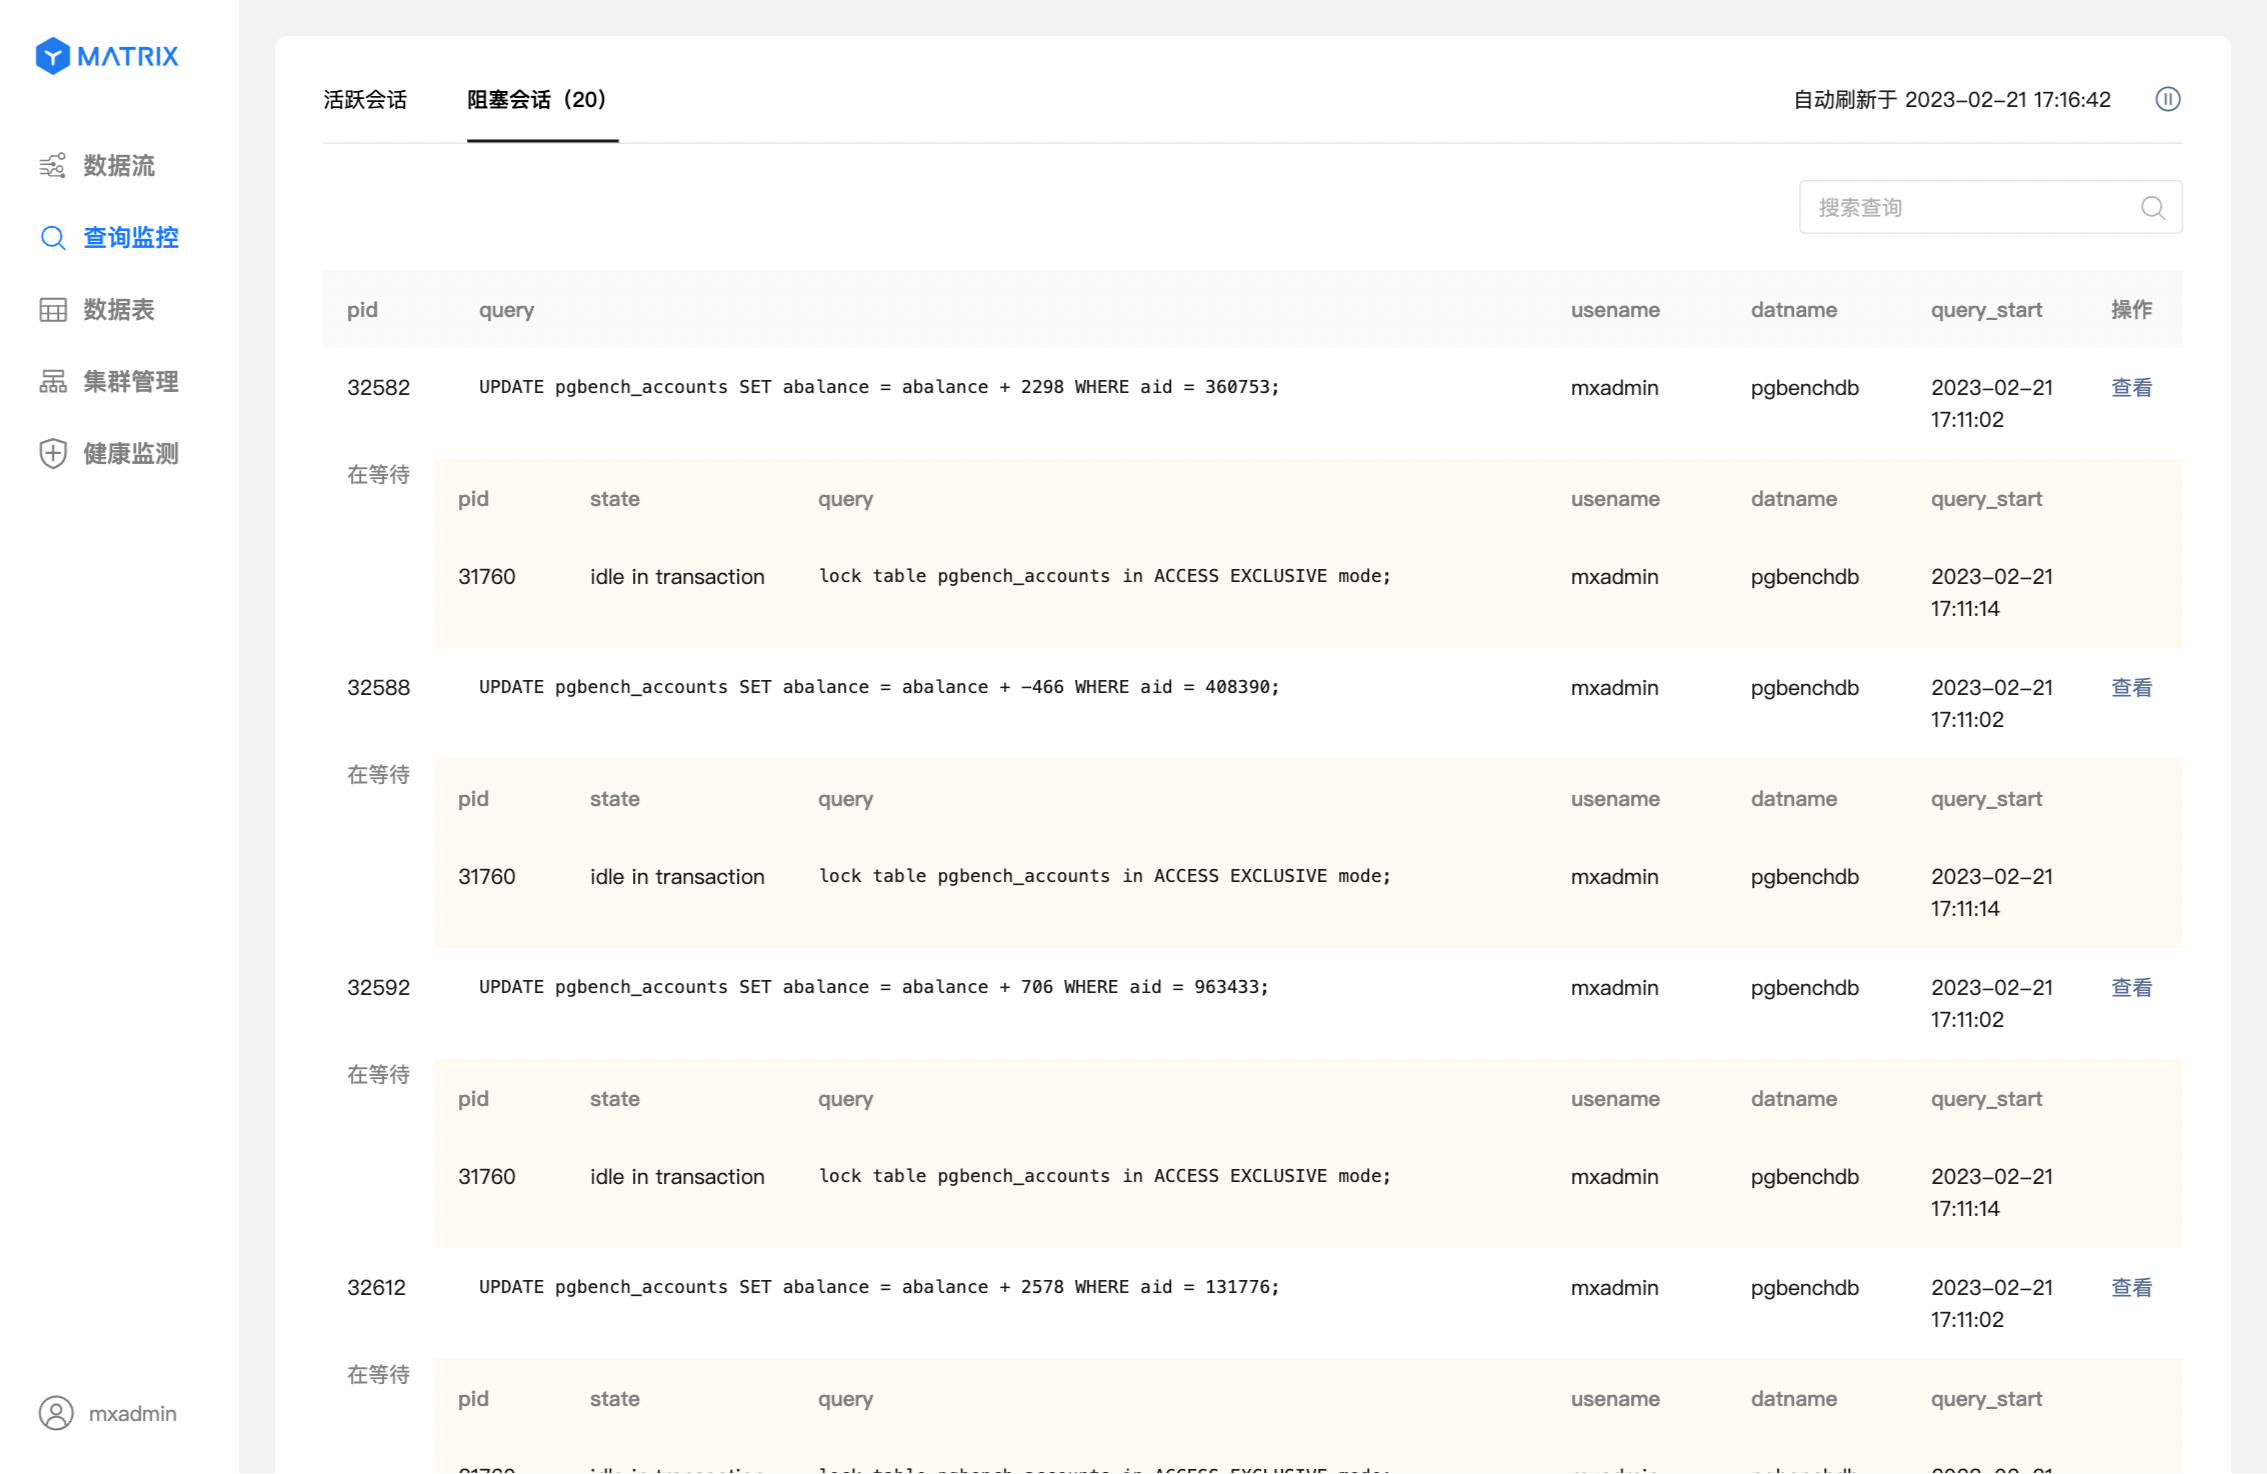
Click Blocked Sessions to switch to the blocked session list. This page shows current session blocking relationships in the database, sorted in descending order by blocking duration—longer-standing blocking relationships appear at the top. The list refreshes automatically every 10 seconds. To examine a specific blocking relationship in detail, you can pause auto-refresh to avoid losing the current view. Auto-refresh is suspended when you leave the Query Monitoring page to reduce system load.
Click the View button on the right side of the target blocking relationship to open the query details page, which supports terminating the session.