YMatrix
Quick Start
Connecting
Benchmarks
Deployment
Data Usage
Data Ingestion
Data Migration
Data Query
Manage Clusters
Upgrade
Global Maintenance
Expansion
Monitoring
Security
Best Practice
Technical Principles
Data Type
Storage Engine
Execution Engine
Streaming Engine(Domino)
MARS3 Index
Extension
Advanced Features
Advanced Query
Federal Query
Grafana
Backup and Restore
Disaster Recovery
Graph Database
Introduction
Clauses
Functions
Advanced
Guide
Performance Tuning
Troubleshooting
Tools
Configuration Parameters
SQL Reference
YMatrix provides a native graphical monitoring tool based on Grafana. This document describes the steps to deploy and manage the monitoring components. YMatrix includes a default monitoring dashboard that displays the following information. Users can also create custom dashboards in Grafana using the collected system data.
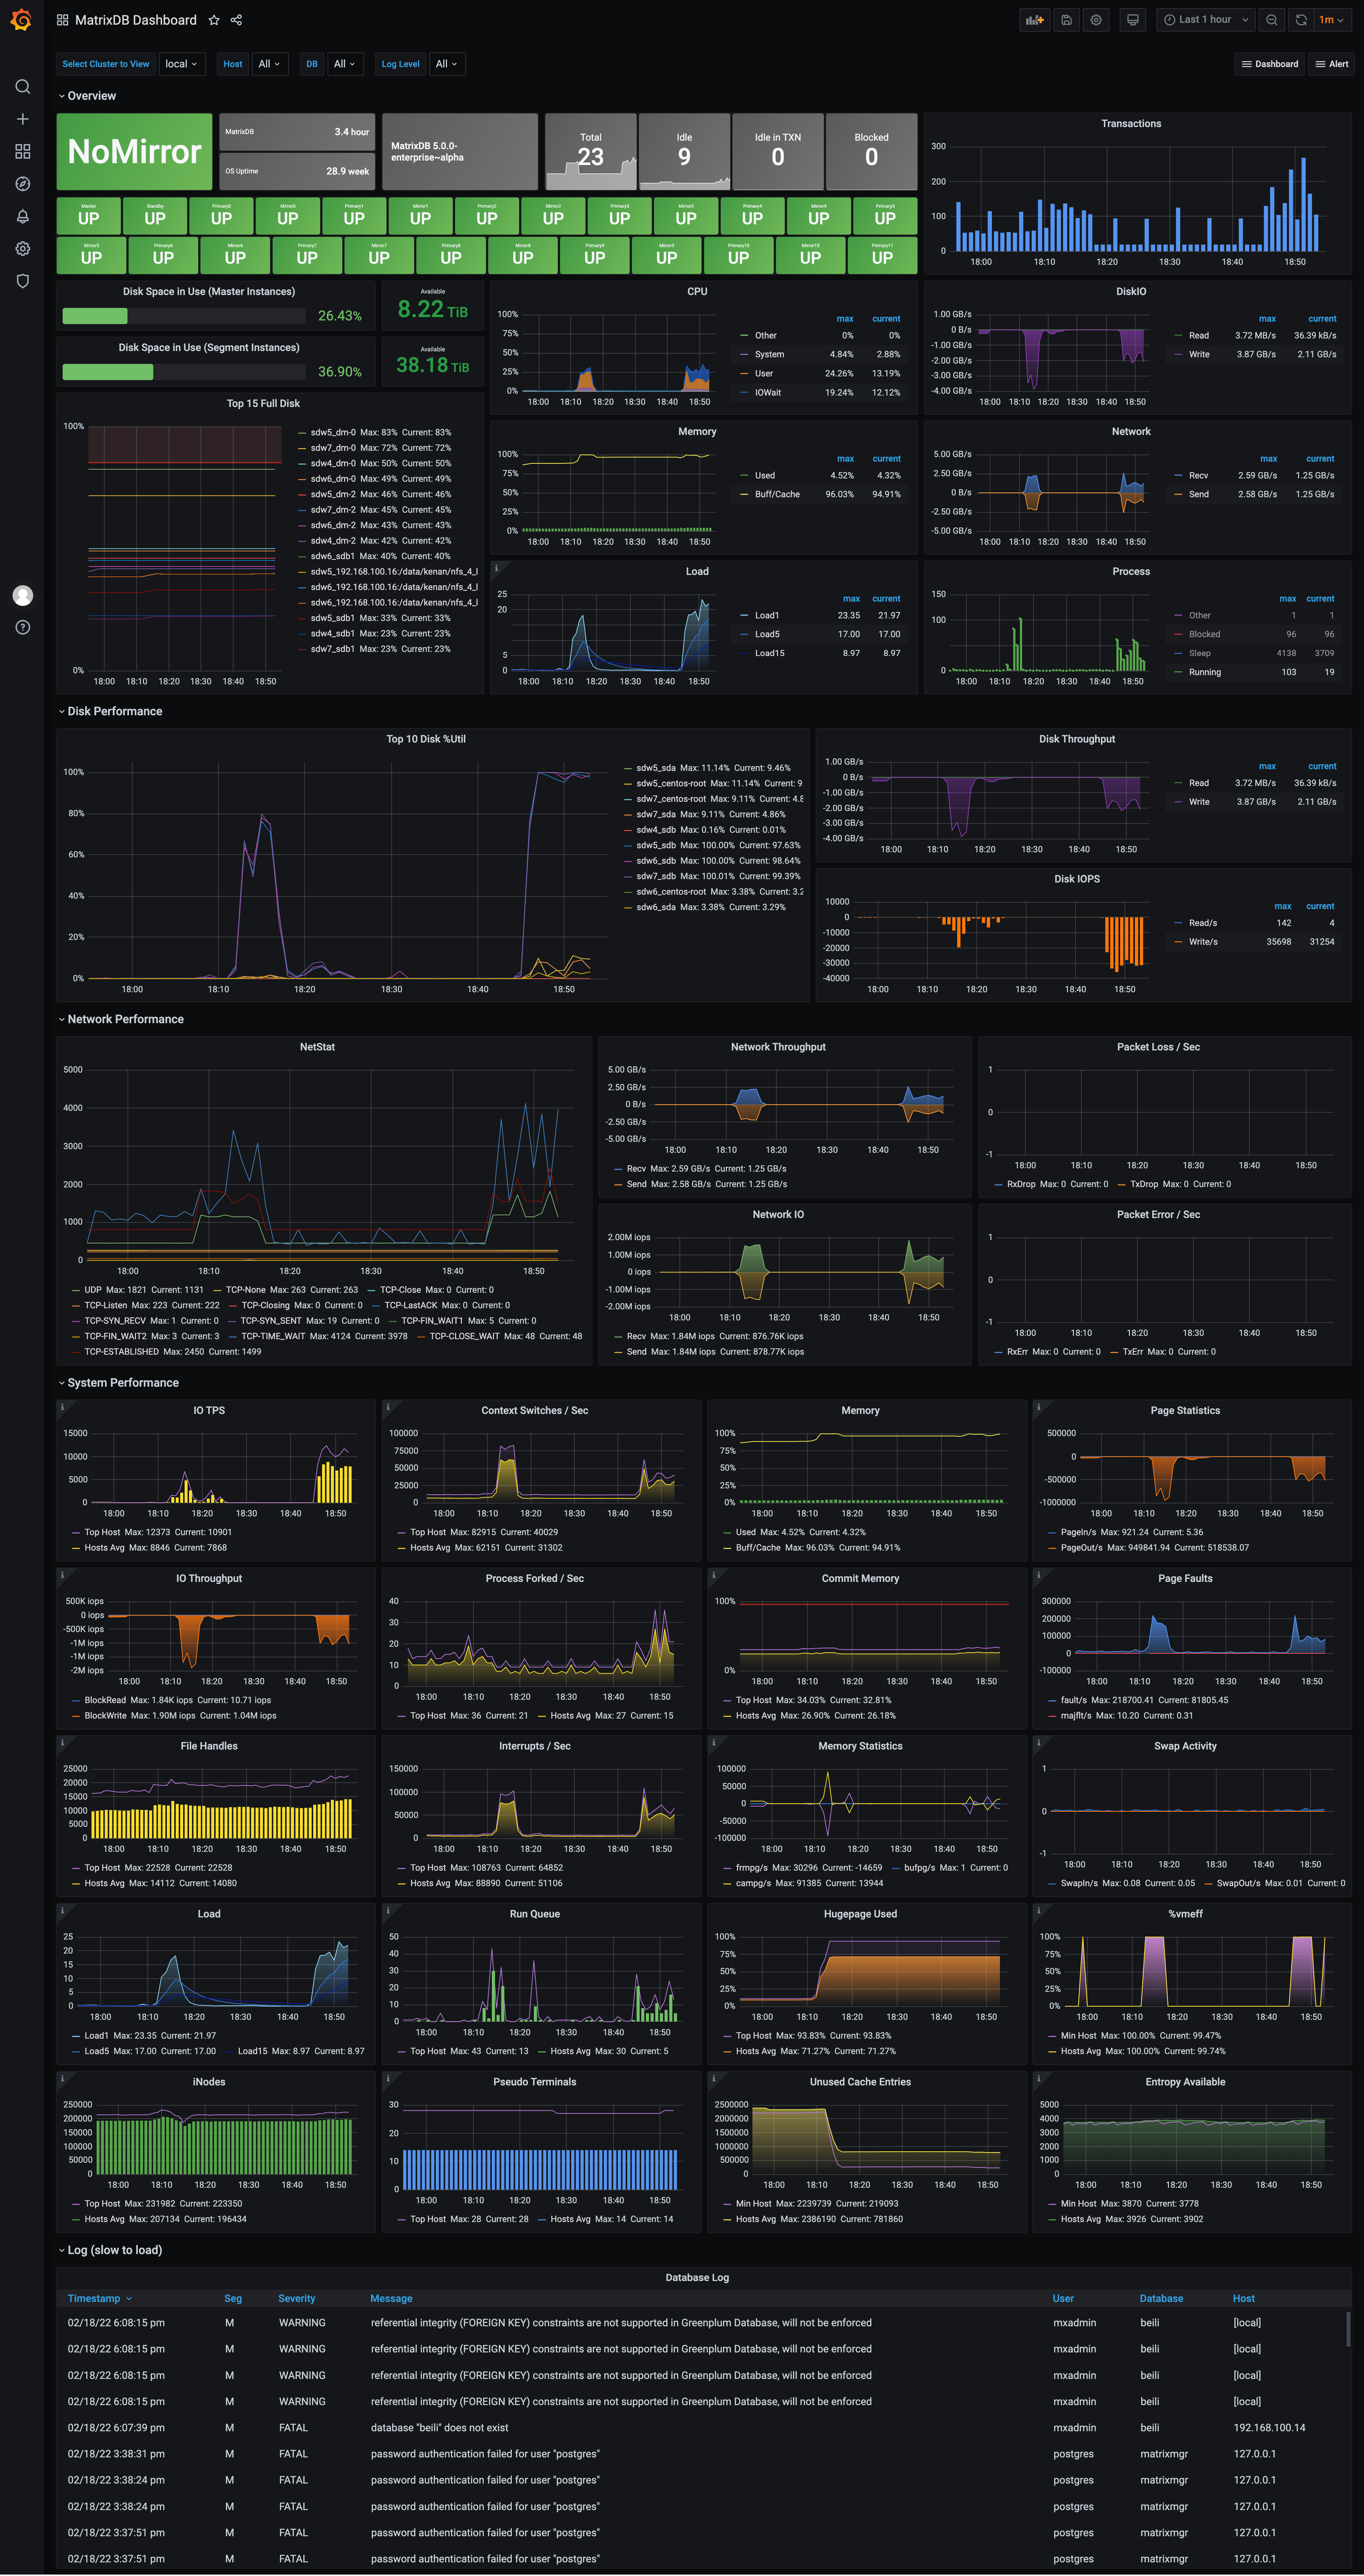
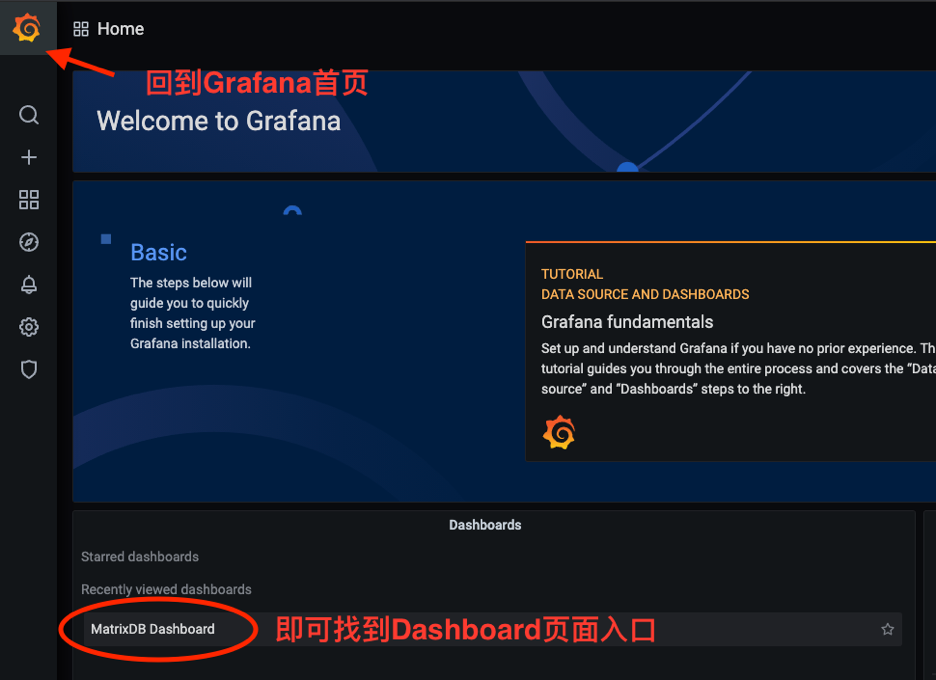
After deployment, the monitoring interface appears as shown below. Starting from version 4.4, the monitoring is split into two dashboards: MatrixDB Dashboard and MatrixDB Database.
MatrixDB Dashboard:
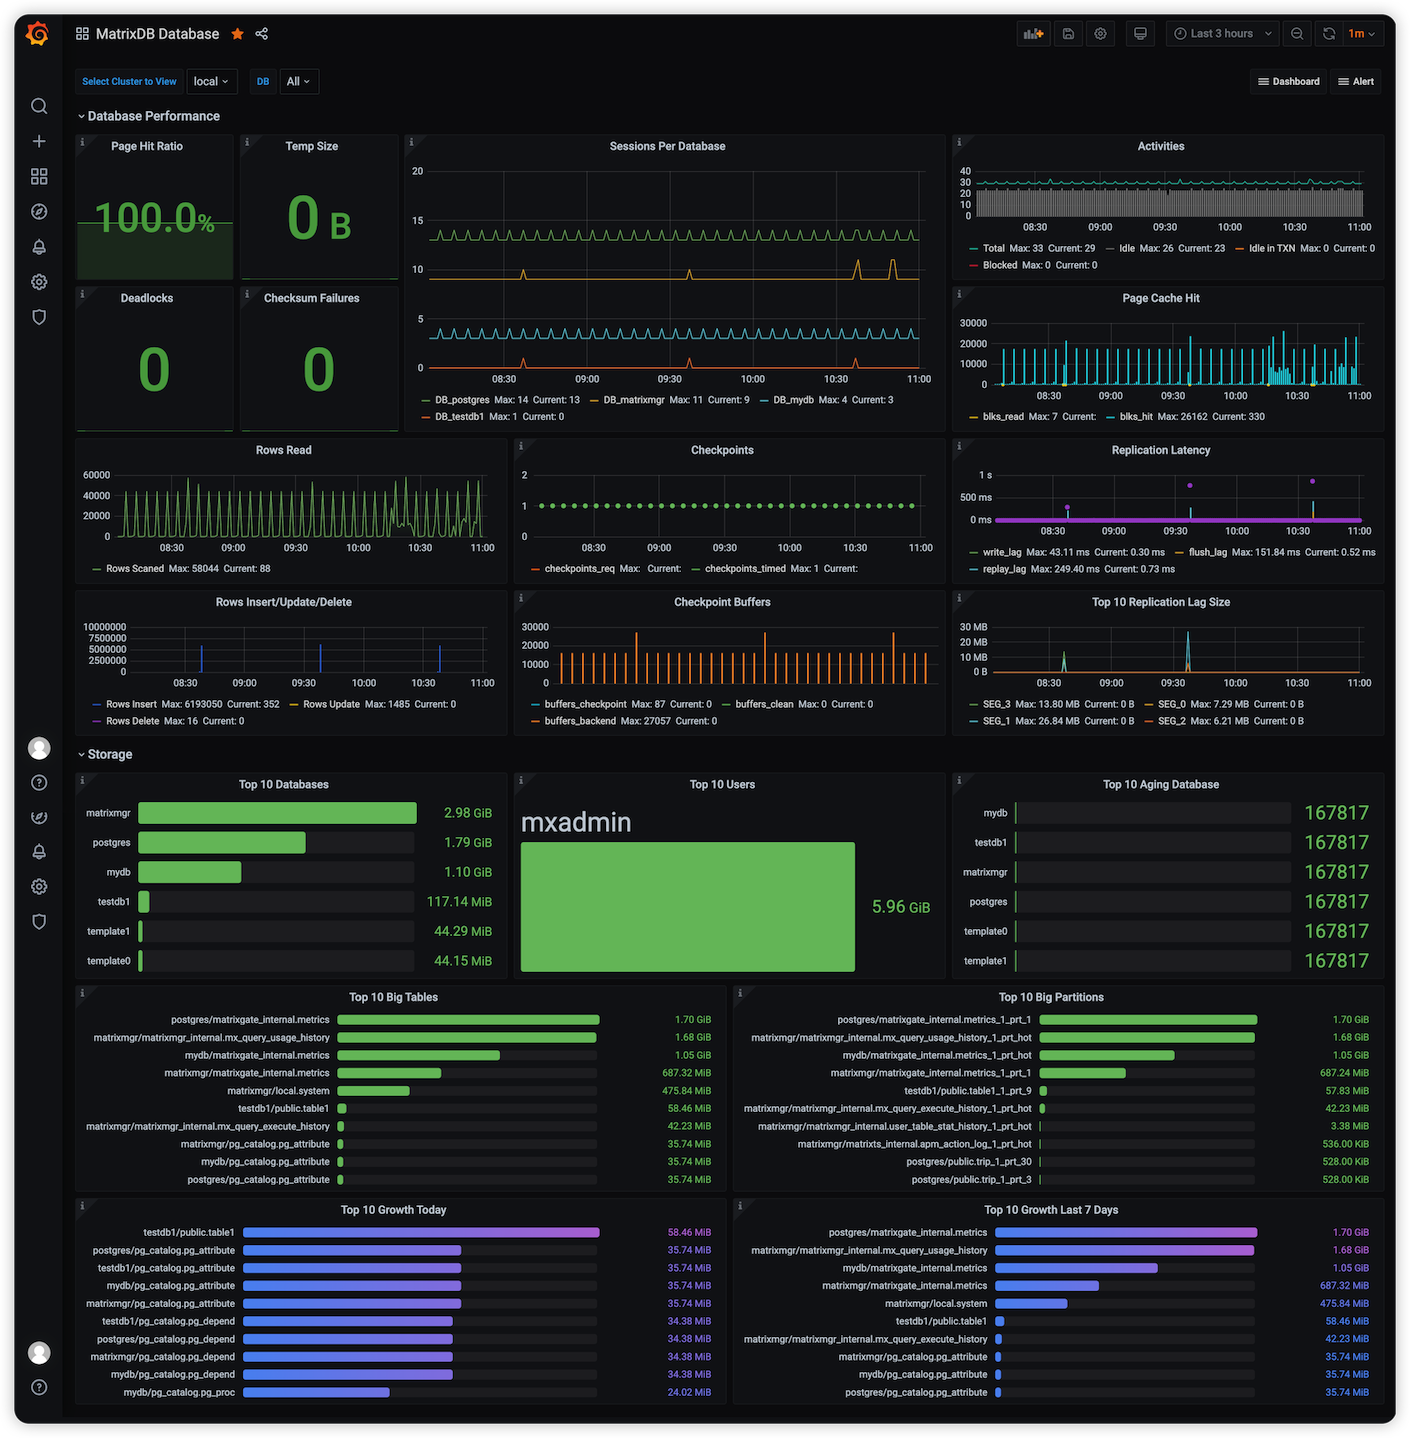
MatrixDB Database:
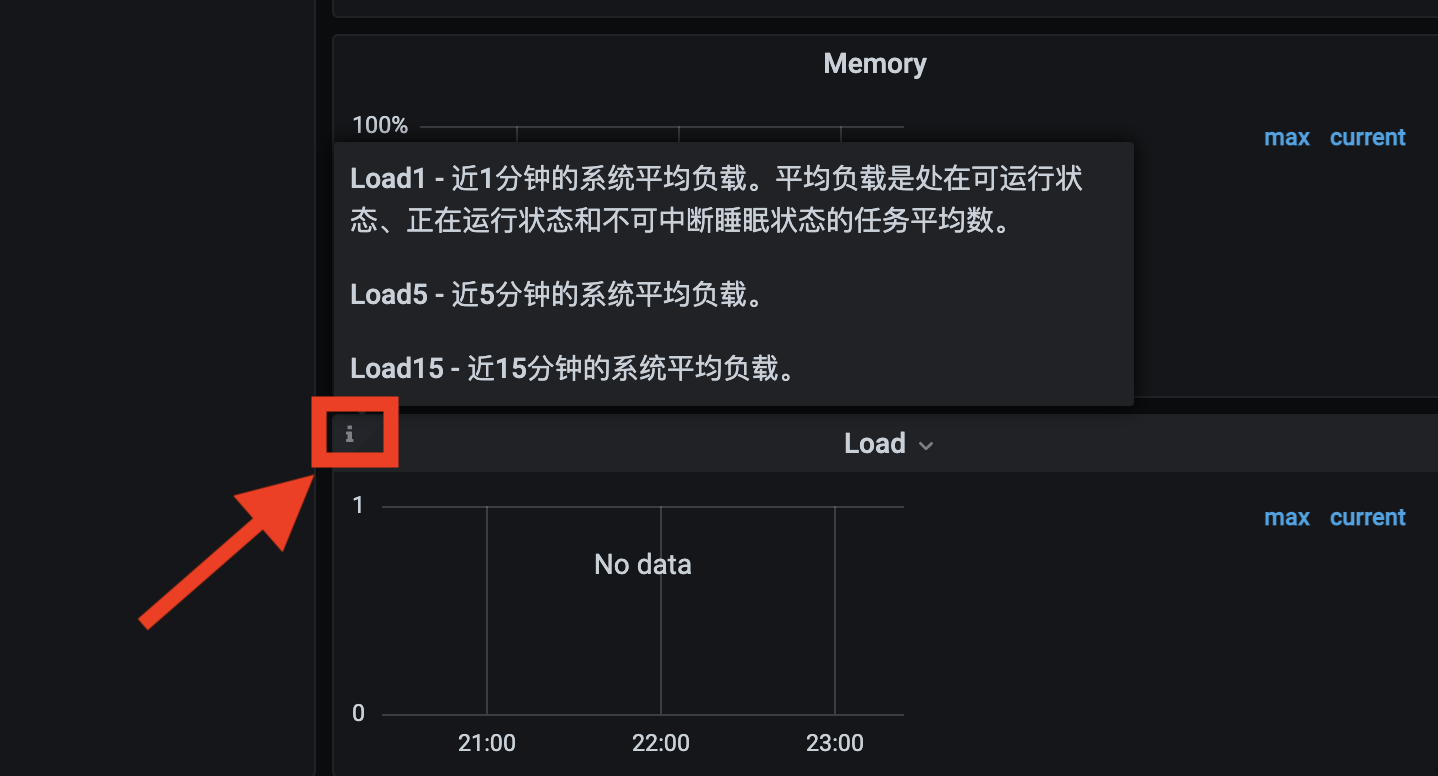
Descriptions have been added for complex panels. Hover over the icon in the top-left corner of a panel to view its explanation:
Monitoring components are included in the YMatrix installation package. After deploying YMatrix, complete the monitoring setup in two steps: enabling metric collection and installing/configuring Grafana.
Perform the following steps to enable metric collection for YMatrix and system resource usage. Collected data is stored in a newly created database named matrixmgr. In the examples below, the Master host is mdw.
[<普通用户>@mdw ~]$ sudo su - mxadmin[mxadmin@mdw ~]$ psql -d matrixmgr
matrixmgr=# SELECT mxmgr_init_local();Upon success, a new schema named local will appear in the matrixmgr database. Tables and views under this schema contain cluster monitoring and configuration data. Do not modify the definitions or contents of these tables and views manually.
Prepare a host that can access both the Master node and the Internet. This can be the Master, Standby Master, or a separate machine (Linux, macOS, Windows, etc.).
Install Grafana, version 7.3 or later recommended. Official download and installation instructions are available at https://grafana.com/grafana/download.
The commands below use CentOS 7 as an example. For other operating systems, refer to their respective documentation.
Note!
YMatrix supports offline Grafana installation. See Monitoring and Alerting FAQ for details.
wget https://dl.grafana.com/oss/release/grafana-7.3.6-1.x86_64.rpm
sudo yum install grafana-7.3.6-1.x86_64.rpm[mxadmin@mdw ~]$ sudo systemctl daemon-reload
[mxadmin@mdw ~]$ sudo systemctl start grafana-server
[mxadmin@mdw ~]$ sudo systemctl status grafana-server
[mxadmin@mdw ~]$ sudo systemctl enable grafana-serverNote!
- The Grafana version provided by
yumin CentOS 7 is often outdated (6.x), so direct use ofsudo yum install grafanais not recommended.- For full official installation instructions, see: https://grafana.com/docs/grafana/latest/installation/rpm
After installation, open a browser and navigate to the URL below. Port 3000 is the default Grafana port, which can be changed. Log in with the default credentials (admin / admin). For security, change the password after logging in by clicking the user avatar in the lower-left corner.
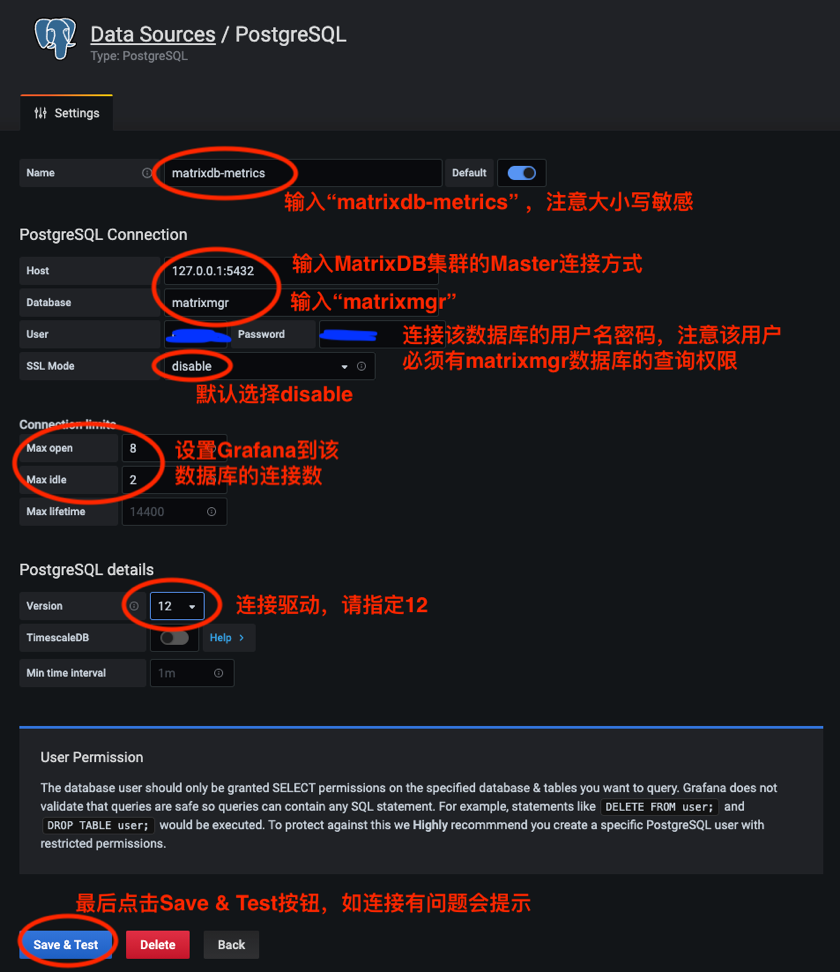
http://<安装节点的IP或者域名>:3000After Grafana is installed, add the matrixmgr database in YMatrix as a data source and import predefined monitoring dashboards.
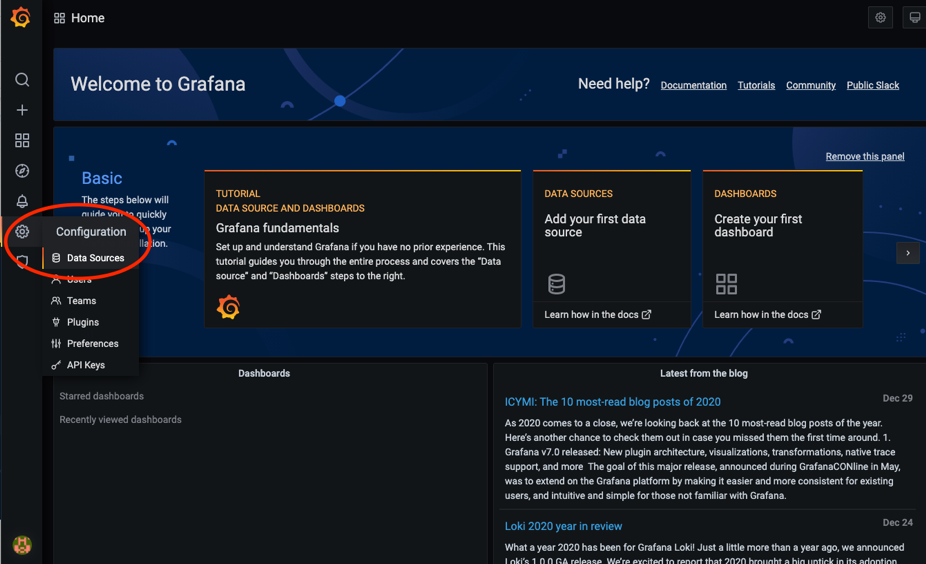
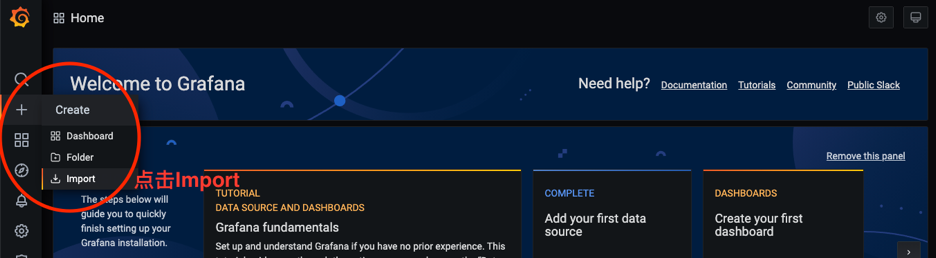
Steps to add a data source:

Before importing the predefined alerting dashboards, copy the dashboard.json and database.json files to your local machine. The process involves locating the files on the server, copying them, and then uploading them locally. Follow these steps:
First, log in to the server and switch to the mxadmin user. Locate the dashboard.json and database.json files in the path shown in the image. You may use the cd command, find command, or any other method you prefer. Below is an example using find for database.json:
[mxadmin@mdw ~]$ cd /opt/ymatrix/matrixdb5/share/doc/postgresql/extension

##or

[mxadmin@mdw ~]$ find /opt/ymatrix/matrixdb5/share/doc/postgresql/extension -name database.json
Next, use the scp command to copy the file to your local machine. Permission issues may arise; consider first copying the file to /tmp/, then transferring it from /tmp/ to your local system. Example using database.json:
Note!
When copying from/tmp/, ensure proper user context to avoid permission issues.
[mxadmin@mdw]$ scp mxadmin@< 服务器IP地址 >:/opt/ymatrix/matrixdb5/share/doc/postgresql/extension/"database.json" mxadmin@< 服务器IP地址 >:/tmp/

~ scp waq@< 服务器IP地址 >:/tmp/"database.json" /Users/akkepler/workplace/Grafana
Finally, verify the file transfer via GUI or command line. Once confirmed, upload the files through the Grafana interface.
Note!
If import fails, perform the following variable modifications.
In dashboard.json, replace all instances of ${cluster} with local. Replace $host with the actual hostnames of all nodes. For example, if your cluster consists of mdw, sdw1, and sdw2, update all occurrences of $host in dashboard.json to 'mdw','sdw1','sdw2'. For database.json, only replace ${cluster} with local. After modification, import the files via the Grafana UI.
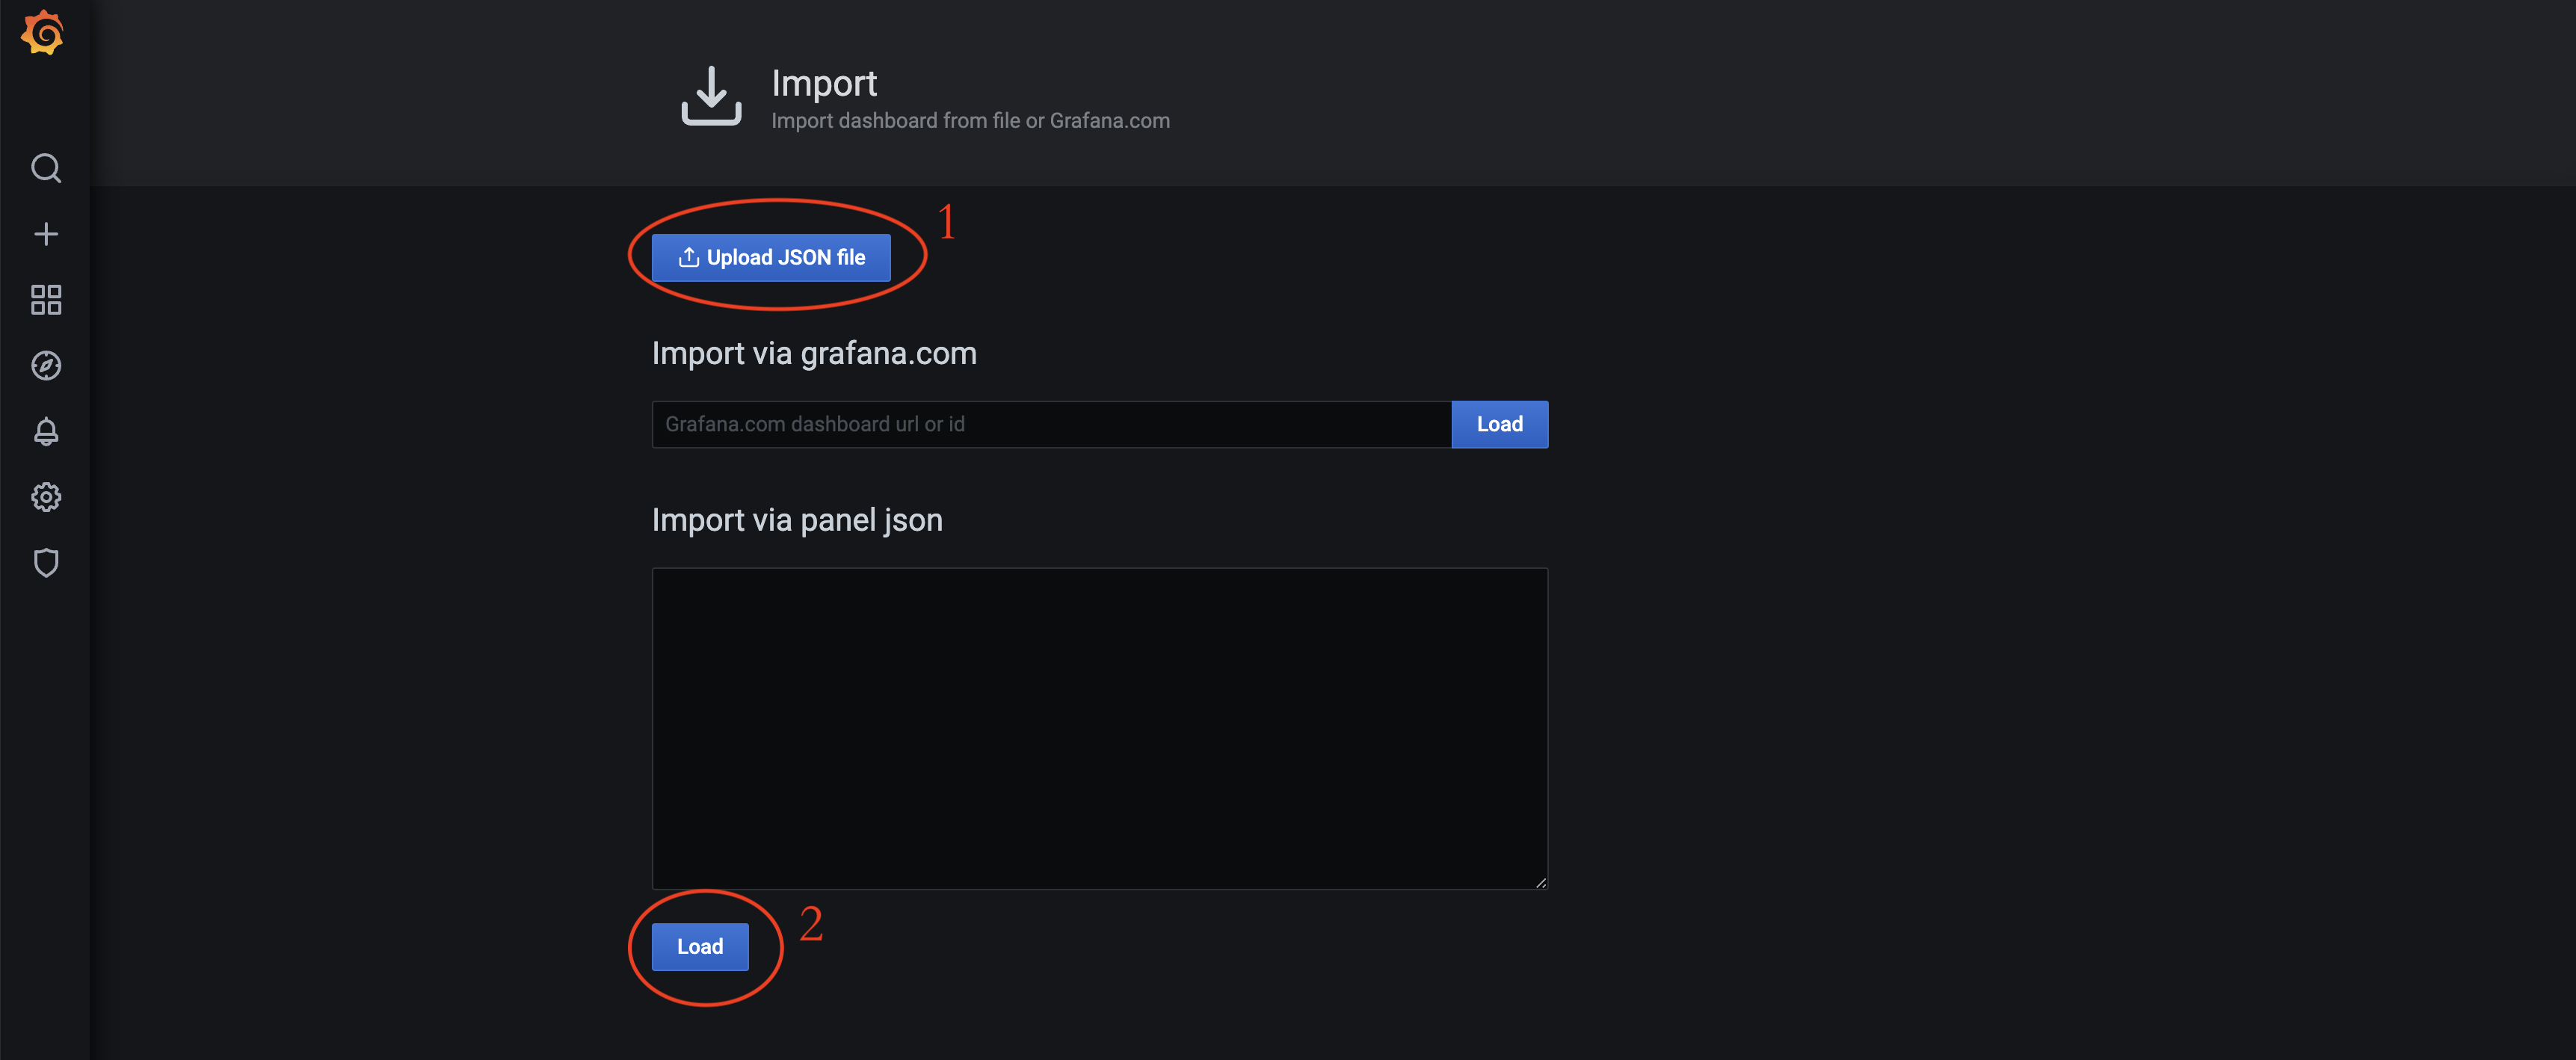
Click Upload JSON file to select and import the dashboard.json and database.json files. These files are located by default in /opt/ymatrix/matrixdb5/share/doc/postgresql/extension.
After enabling cluster metric collection, each host runs a collection service. Related logs are stored in /var/log/matrixdb.
If you restart YMatrix or reboot the server and then restart YMatrix, the data collection service starts automatically without manual intervention.
To stop the data collection service, connect to the matrixmgr database and run mxmgr_remove_all. Existing collected data remains intact:
[mxadmin@mdw ~]$ psql -d matrixmgr

matrixmgr=# SELECT mxmgr_remove_all('local');
If the collection service was manually stopped or after reinstalling YMatrix, re-enable collection by connecting to the matrixmgr database and running mxmgr_deploy:
matrixmgr=# SELECT mxmgr_deploy('local');