YMatrix
Quick Start
Connecting
Benchmarks
Deployment
Data Usage
Data Ingestion
Data Migration
Data Query
Manage Clusters
Upgrade
Global Maintenance
Expansion
Monitoring
Security
Best Practice
Technical Principles
Data Type
Storage Engine
Execution Engine
Streaming Engine(Domino)
MARS3 Index
Extension
Advanced Features
Advanced Query
Federal Query
Grafana
Backup and Restore
Disaster Recovery
Graph Database
Introduction
Clauses
Functions
Advanced
Guide
Performance Tuning
Troubleshooting
Tools
Configuration Parameters
SQL Reference
This document describes the graphical interface cluster health monitoring feature.
While supporting daily operations, YMatrix databases execute a large volume of SQL statements. Issues such as hardware failures (e.g., network outages) or lock contention due to transaction concurrency may occur. If not addressed promptly, these issues can slow down client responses or cause direct errors, affecting business efficiency. To better address such problems, the graphical health monitoring feature helps you quickly identify abnormal behaviors in the database cluster.
Health monitoring regularly checks relevant system catalog tables based on different detection items. It evaluates whether query execution states meet business expectations. If any deviation from expected states is detected, an alert notification is immediately triggered. Notifications can be viewed in the graphical interface. For more timely alerts, you can also configure email notifications instead of checking the interface manually.
Enter the IP address (by default, the Master's IP) and port number of the machine where MatrixGate is running into your browser to log in to the graphical interface.
http://<IP>:8240 After successful login, navigate to the Health Monitoring page.

You may choose whether to configure an email server based on your needs. Once configured, you will receive alert notifications via email.
Graphical Interface Domain Name
To facilitate quick access to alert details, a link to the graphical interface is included in the email. If recipients cannot access the default domain, modify this field accordingly.
SMTP Server Address
The SMTP server address consists of an IP address and port number. Example: smtp.example.com:465.
Common third-party email server addresses:
Alibaba Cloud Mail Service
Personal Edition: Enable SMTP service first, see documentation.
SMTP address and port: refer to documentation.
Enterprise Edition: The administrator must enable SMTP service, see documentation.
SMTP address and port: refer to documentation.
Google Mail Service
Enable IMAP or POP service first, see documentation.
NetEase Mail Service
Personal Edition: Enable SMTP service first, see documentation.
Enterprise Edition: SMTP is enabled by default. To verify status, see documentation.
SMTP address and port: refer to documentation.
QQ Mail Service
Personal Edition: Enable SMTP service first, see documentation.
SMTP address and port: refer to documentation.
Enterprise Edition: Steps to enable SMTP, see documentation.
SMTP address and port: refer to documentation.
Note!
If the email service is self-hosted, consult your email administrator or service provider.
Username
The account used to authenticate with the SMTP server. This field is optional and required only if the SMTP server requires username authentication. Example: [email protected].
Password
The password for the SMTP username. This field is optional and required only if the SMTP server requires both username and password for authentication.
Alibaba Cloud Mail:
Use the mailbox login password (i.e., the password associated with the username email).
Google Mail:
Use the mailbox login password.
NetEase Mail:
Personal Edition: Use an authorization code as the password, see documentation.
Enterprise Edition: Use the mailbox login password by default. If the administrator has enabled client authorization codes, consult the administrator for obtaining one.
QQ Mail:
Personal Edition: Use an authorization code as the password, see documentation.
Enterprise Edition: Use the mailbox login password by default. If secure login is enabled by the administrator, use an authorization code, see documentation.
Note!
For self-hosted email services, consult your email administrator or service provider.
Sender
For third-party email services, this field should match the "Username".
For self-hosted services, enter the sender email address.
Recipients
Enter one or more recipient email addresses.

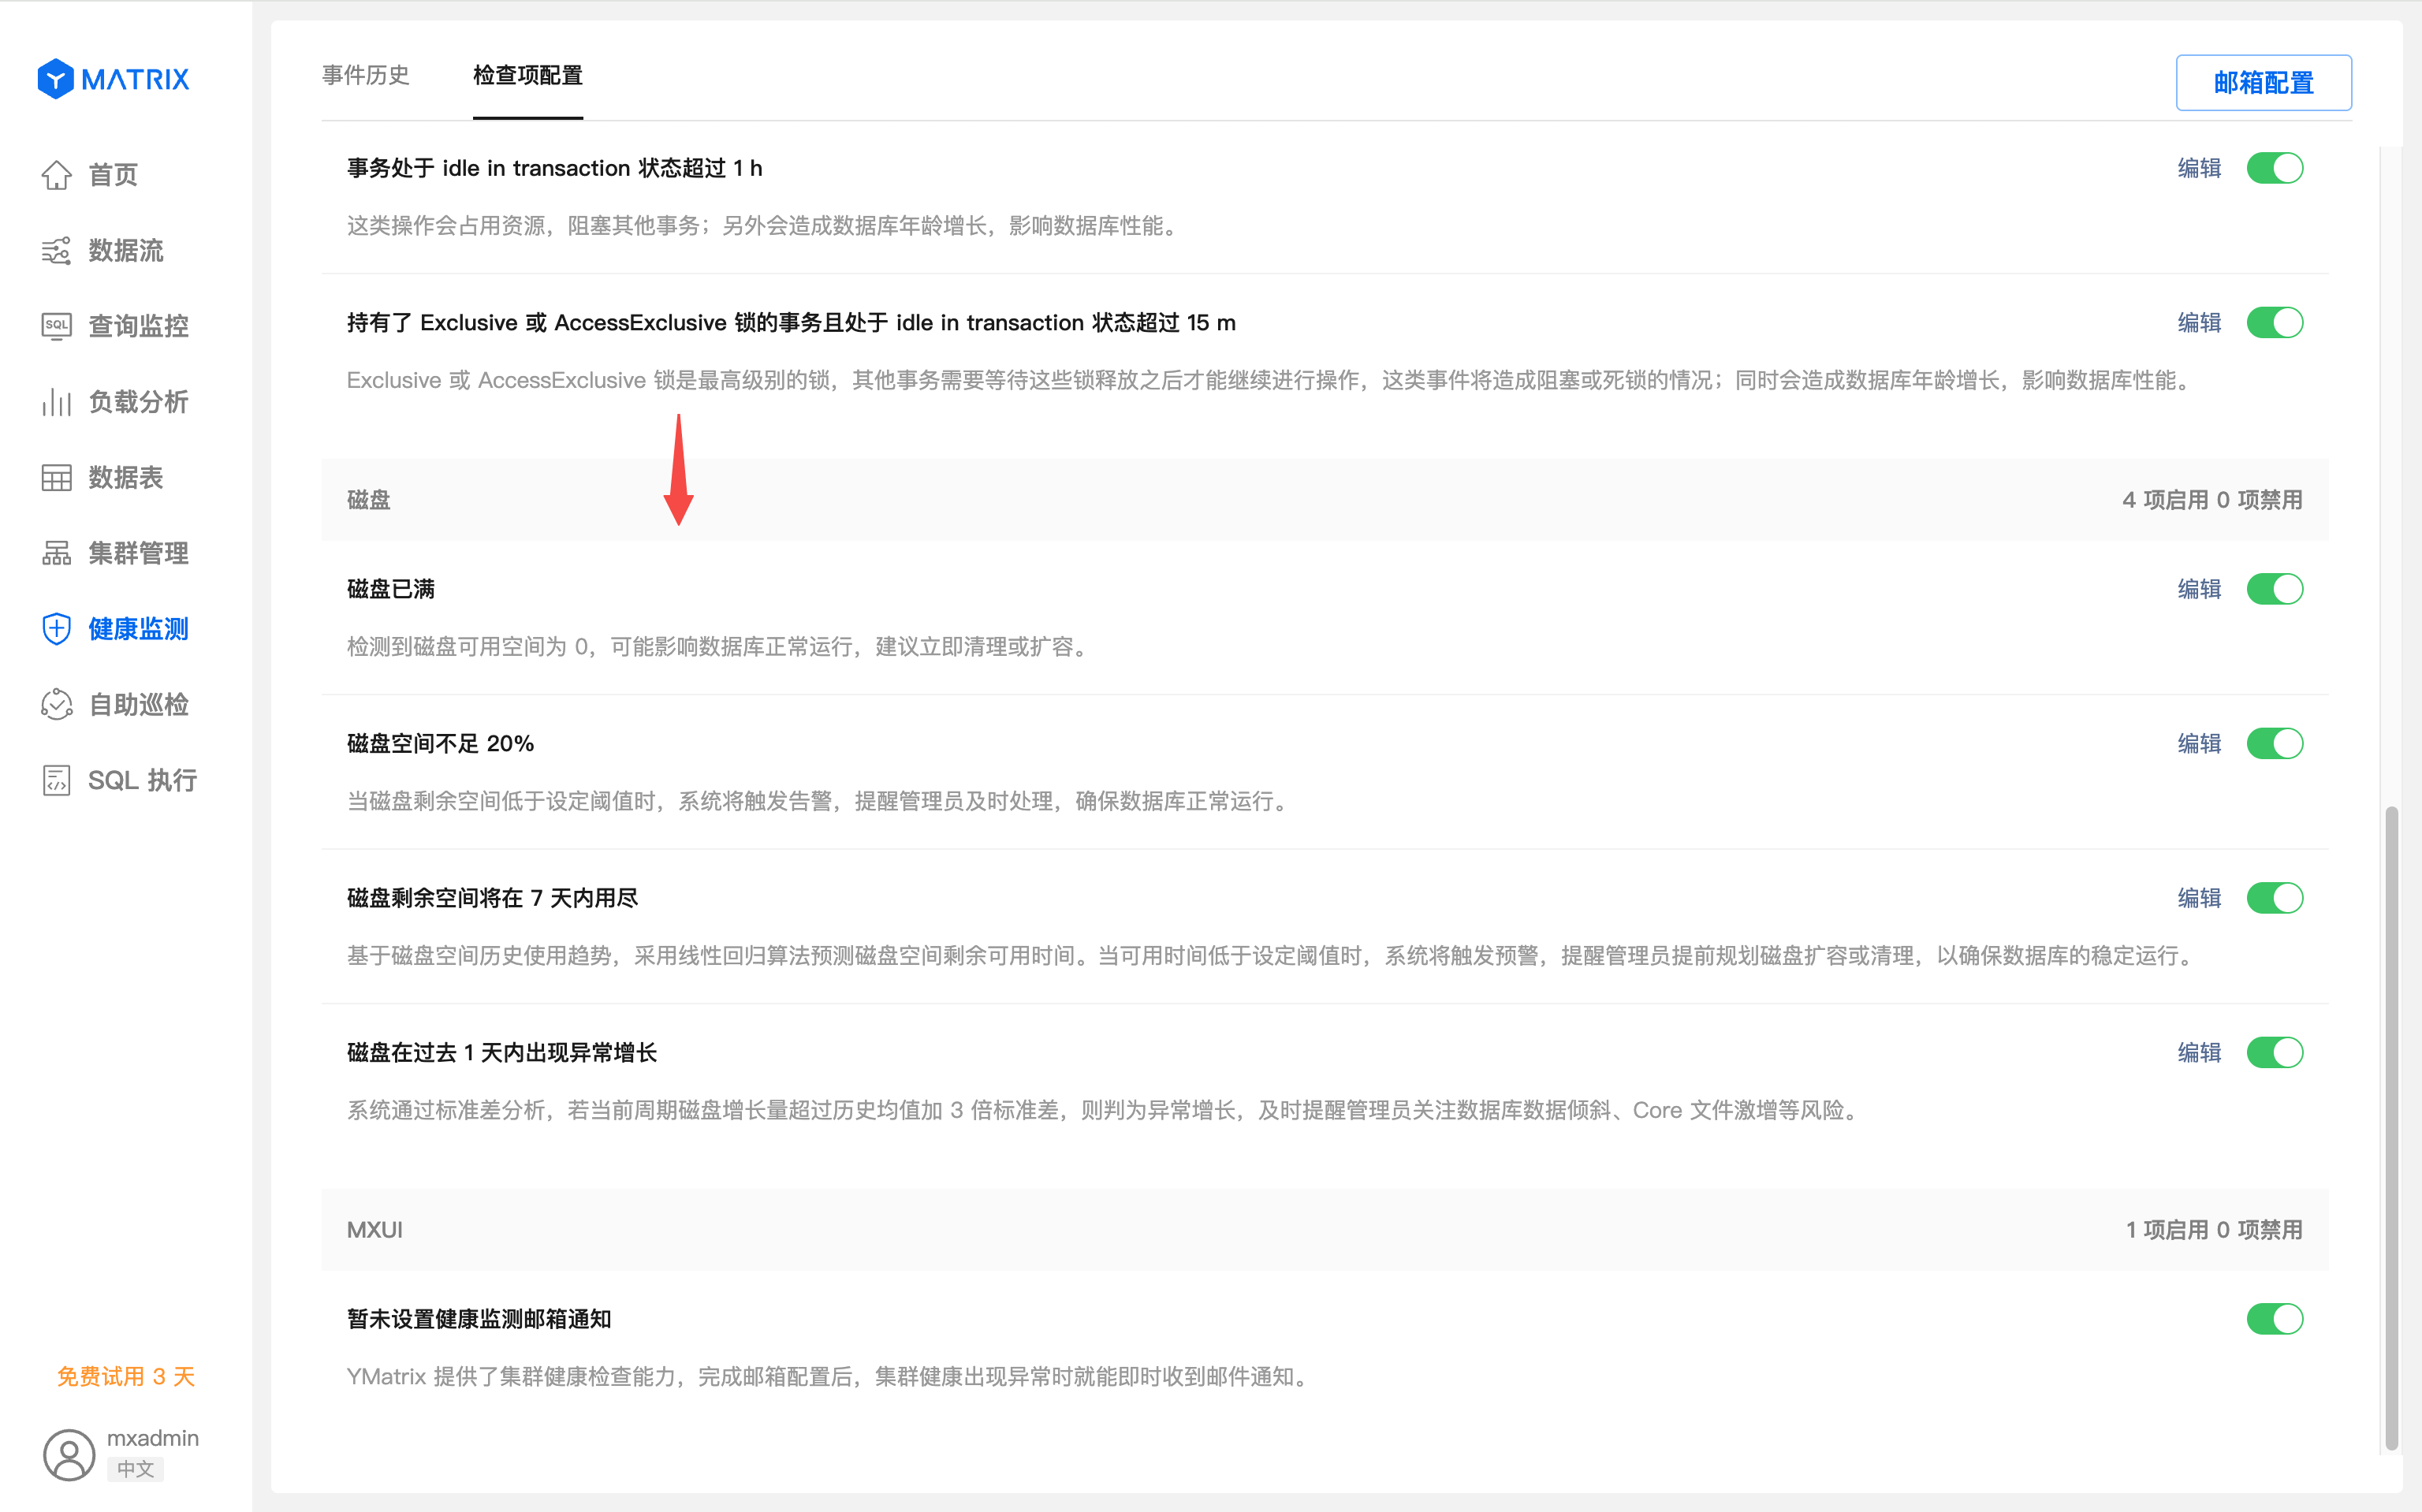
The list shows all monitoring items currently provided by YMatrix. All items are enabled by default. You can enable or disable them according to your needs.
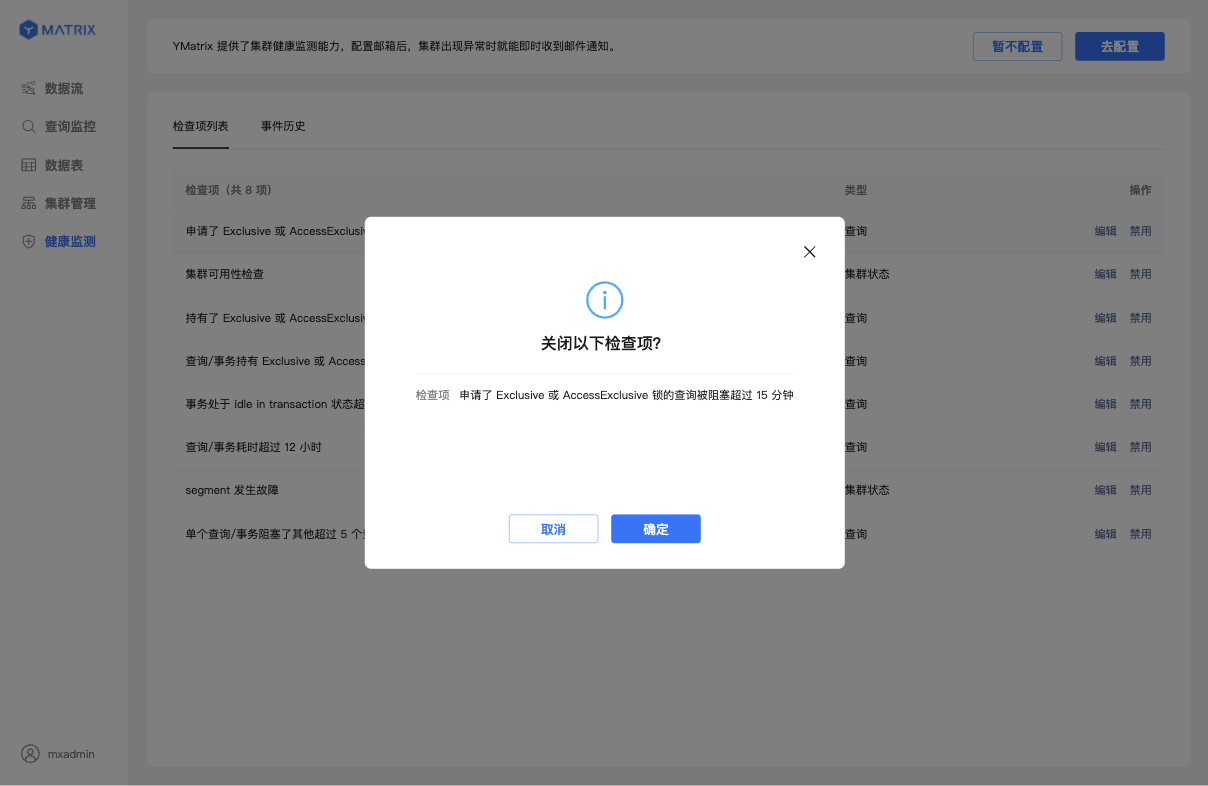
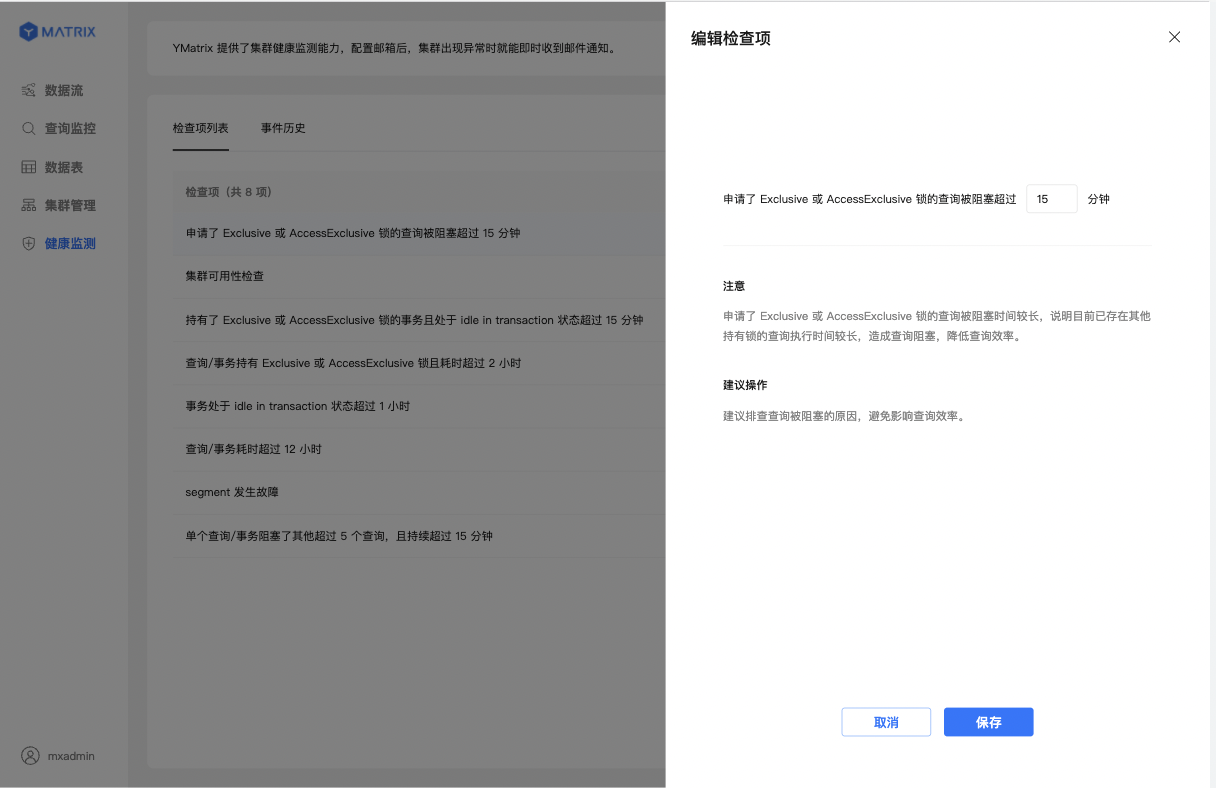
If the default parameters do not suit your business scenario, you can modify them.
| No. | Monitoring Item | Description |
| 1 | Cluster Unavailable | Periodically runs SELECT * FROM gp_dist_random('gp_id') to verify cluster availability. If this query fails three times consecutively, the cluster is likely down due to primary Segment and mirror Segment failures, network issues, power failure, or hardware faults. |
| 2 | Segment Failure | A failed primary Segment causes resource skew on the corresponding mirror Segment. The mirror Segment's host experiences increased load, slowing queries and potentially exhausting memory, leading to cluster unavailability. A failed mirror Segment reduces high availability. If the corresponding primary Segment fails, the cluster becomes unavailable. |
| 3 | Query/Transaction Running Over 12 Hours | Long-running queries/transactions may consume excessive memory and CPU, slowing database response and potentially triggering OOM (out-of-memory). They may also delay VACUUM processes. |
| 4 | Transaction in "idle in transaction" State Over 1 Hour | A transaction in "idle in transaction" state for a long time blocks most queries involving the same tables and prevents VACUUM from reclaiming dead rows, causing table bloat. |
| 5 | Single Query/Transaction Blocks More Than 5 Others for Over 15 Minutes | If a query/transaction blocks many others for a prolonged period, it may cause cascading blockages, reducing service responsiveness. |
| 6 | Query Requesting Exclusive or AccessExclusive Lock Blocked for Over 15 Minutes | A query requesting an Exclusive or AccessExclusive table lock that is blocked for a long time may cause a backlog of blocked queries, affecting response efficiency. |
| 7 | Query/Transaction Holding Exclusive or AccessExclusive Lock for Over 2 Hours | A query/transaction holding an Exclusive or AccessExclusive table lock for a long duration blocks all queries involving the locked table, degrading performance. |
| 8 | Transaction Holding Exclusive or AccessExclusive Lock in "idle in transaction" State for Over 15 Minutes | A transaction holding an Exclusive or AccessExclusive lock while in "idle in transaction" state for 15 minutes blocks most queries on the involved tables, affecting service efficiency. |
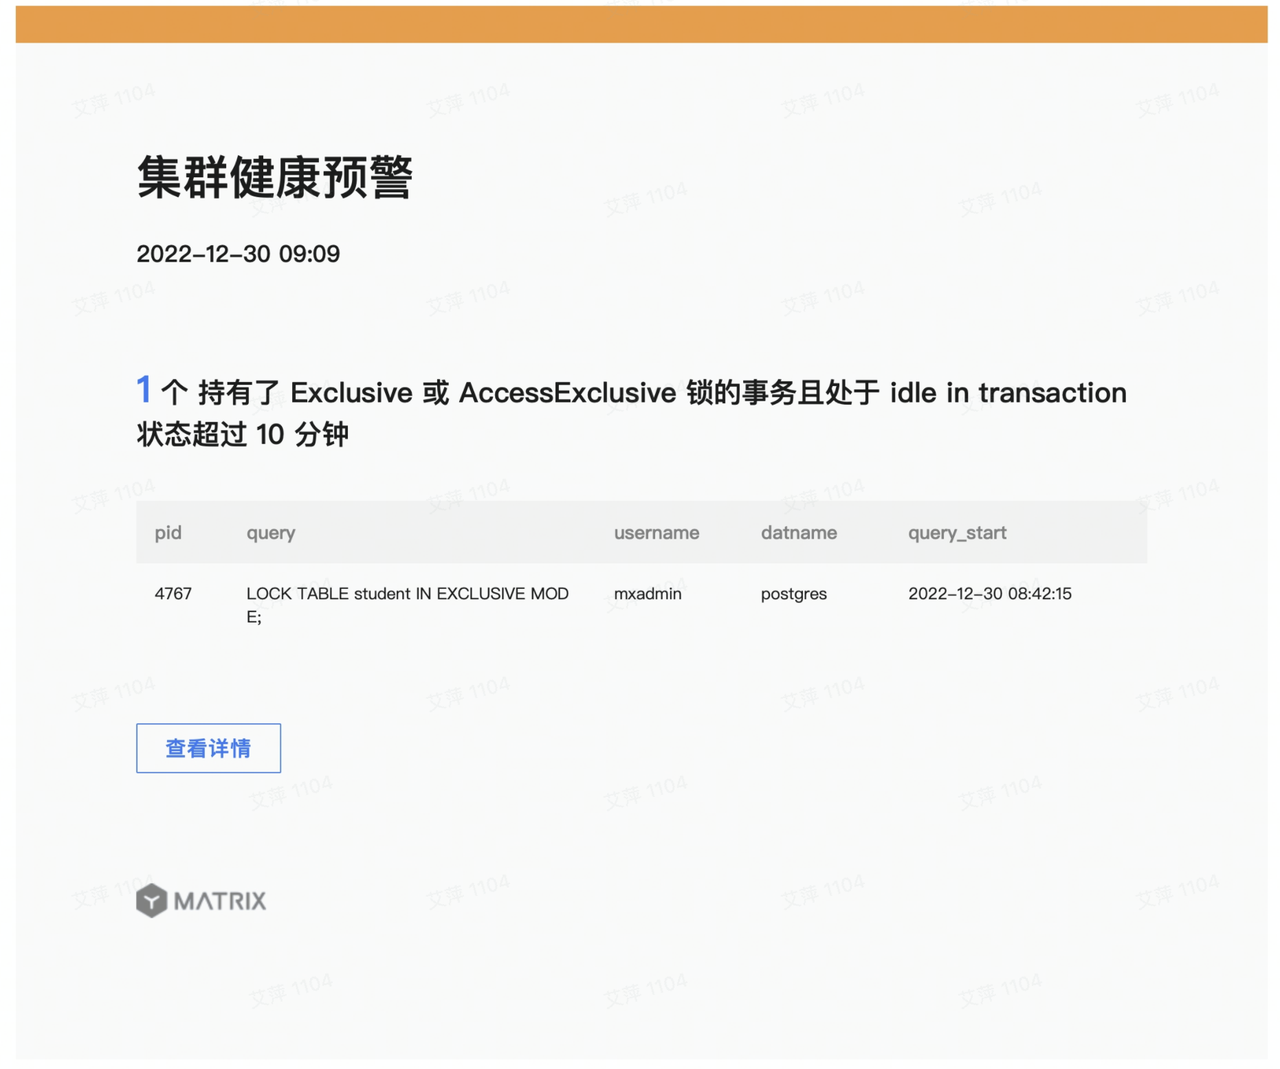
If you have configured an email server, you will receive an email when an event meets the failure condition of any monitoring item.
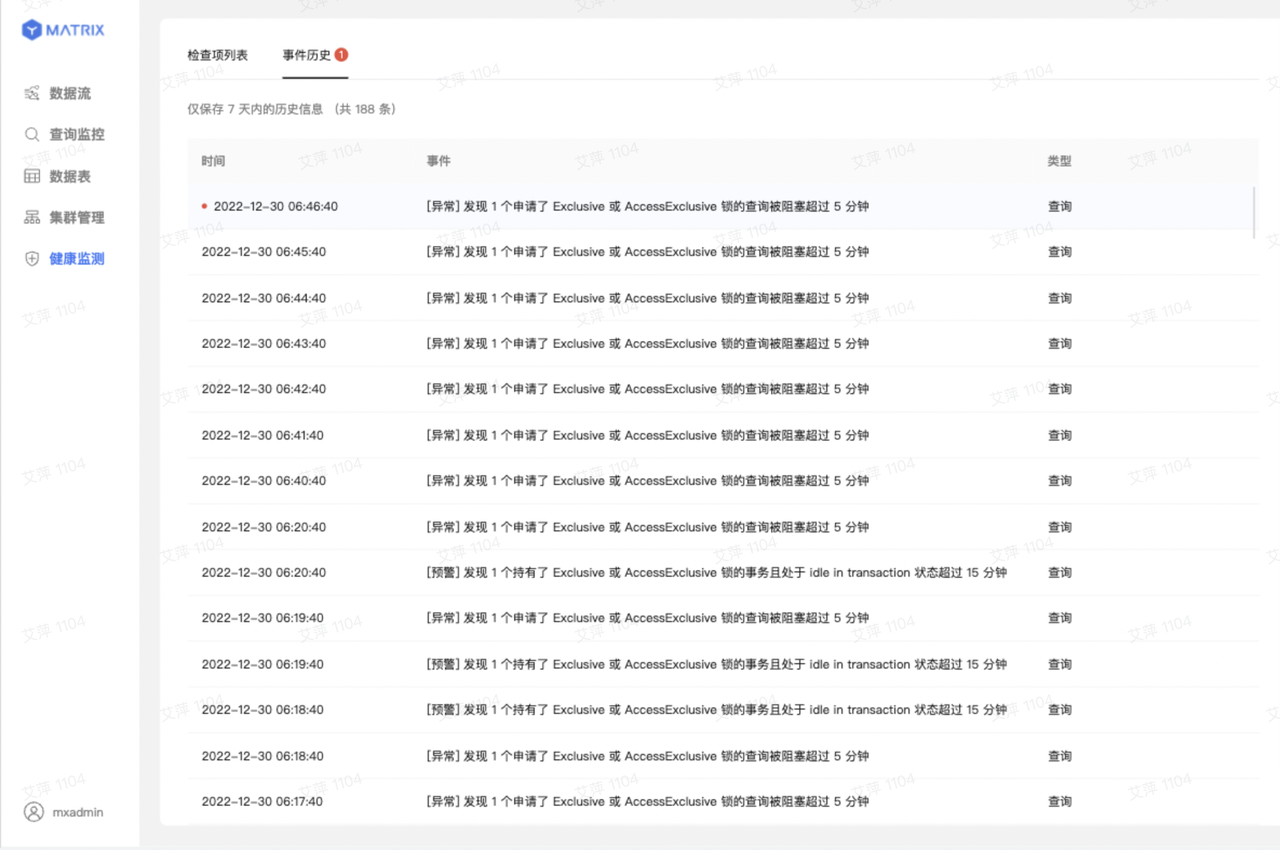
Regardless of email configuration, you can view historical records of events that met monitoring failure conditions under Event History.
You can quickly enable or disable disk status monitoring items, including:
Click the Edit button to adjust thresholds based on business requirements.