This document describes the metrics and recommended alert thresholds for YMatrix, MatrixGate, and host node monitoring in the Prometheus monitoring dashboard.
Alert Level Description
Note!
Metrics without reference alert thresholds should be evaluated and configured based on actual conditions.

This section displays the overall cluster status, including:
| Metric | Description | Unit | Level | Recommended Alert Threshold |
|---|---|---|---|---|
| Cluster Status | Node status of the cluster, including: 0: Normal 1: No Standby 2: No Mirror 10: Imbalanced Distribution (after node recovery, primary-mirror roles are not rebalanced) 11: Asynchronous Nodes (some Mirror nodes are out of sync with Primary) 12: Master Only (only Master node is running, typically used for diagnostics) 20: Segment Down (unavailable Segment nodes, cluster is unusable) |
short | p0 | 20: Segment Down is critical and requires alerting |
| Uptime | Runtime since YMatrix started and OS uptime of the Master host | seconds (s) | ||
| Version | YMatrix version | |||
| Connection Status | Database connection statistics: Total connections, Blocked queries, Idle connections, Idle in transaction | short | ||
| Slow Queries | Number of queries running longer than 1 day | short | Alert if greater than 0 | |
| Transactions | Statistics on transaction commits and rollbacks | short | ||
| Disk Space in Use | Disk usage of Master or Segment instances | 0-1 | ||
| Node Status | Status of each node: 0: UP (normal) 10: Switched (role switch occurred; rebalancing needed) 11: Resync (synchronizing) 20: Down (down) |
short | p2/p1 | Alert at p2 if non-zero for more than 5 minutes Alert at p1 for value 20 |
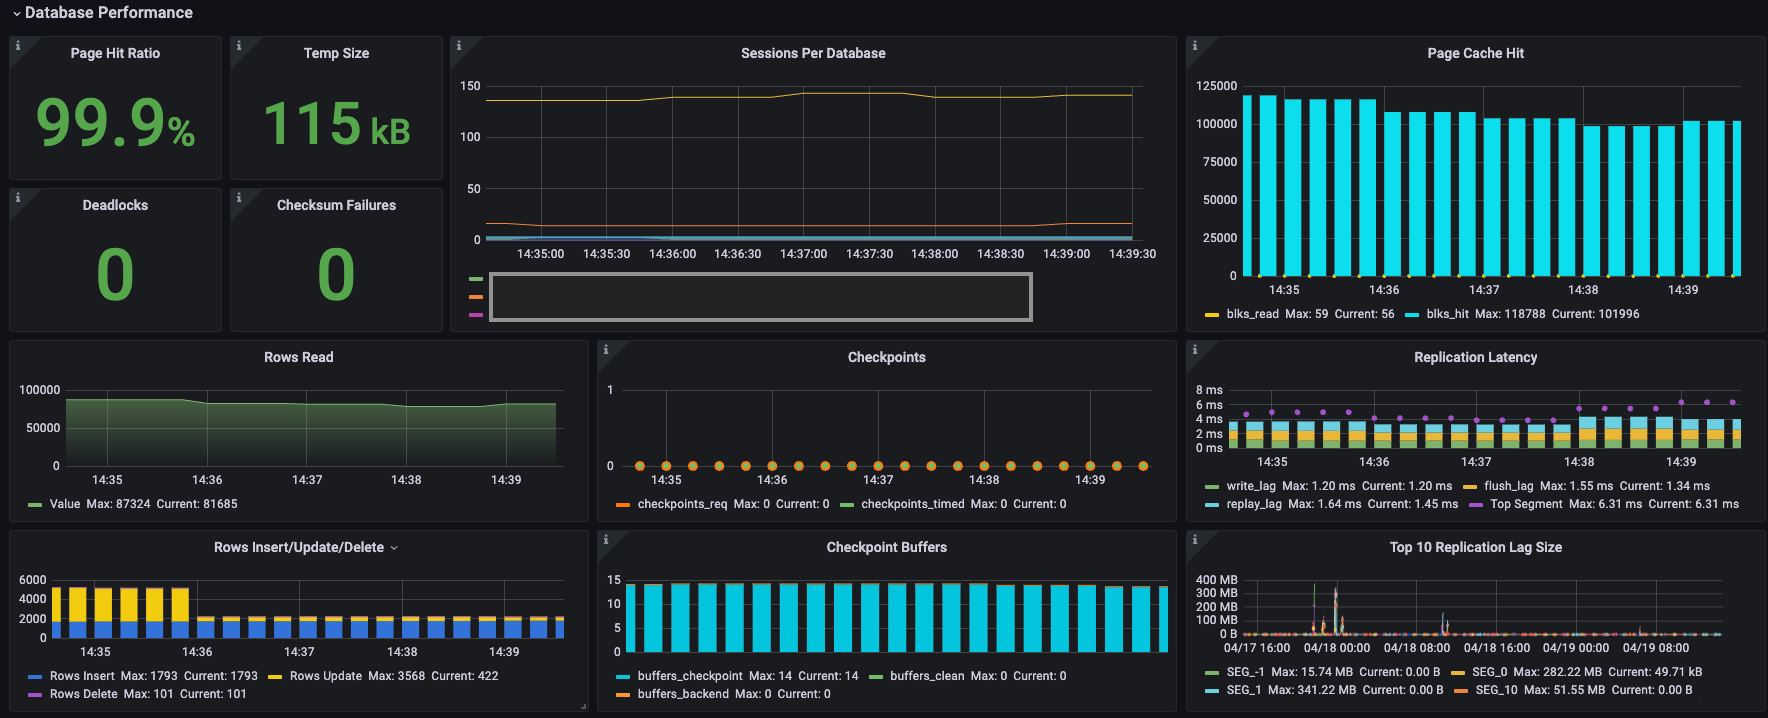
This section shows database performance metrics:
| Metric | Description | Unit | Level | Recommended Alert Threshold |
|---|---|---|---|---|
| Page Hit Ratio | Ratio of HEAP table read operations hitting block cache to total reads. (Cache includes only HEAP table's own cache, not OS cache.) Displayed value is current; curve shows historical data. Typically should be above 90% |
0-1 | ||
| Temp Size | Total data volume written to temporary files by queries. All temp files are counted regardless of log_temp_files setting | bytes | ||
| Sessions Per Database | Number of sessions per database | short | ||
| Activities | Number of sessions in various states | short | ||
| Deadlocks | Number of deadlocks | short | p3 | YMatrix automatically resolves deadlocks; failed queries can be retried. Alerting can be configured. |
| Checksum Failures | Number of data page checksum failures. NULL if not enabled | short | p3 | |
| Rows Read | Number of rows read | short | ||
| Checkpoints | Checkpoint statistics.Orange indicates checkpoints triggered manually.Green indicates checkpoints triggered by timeout | short | ||
| Page Cache Hit | blks_hit: number of cache hits during data page reads blks_read: number of disk reads due to cache misses |
|||
| Replication Latency | write_lag - Time between local WAL flush and Standby/Mirror acknowledging receipt (but not yet flushed or applied). Measures commit delay when synchronous_commit is set to remote_write flush_lag - Time between local WAL flush and Standby/Mirror acknowledging flush (but not yet applied). Measures commit delay when synchronous_commit is set to on replay_lag - Time between local WAL flush and Standby/Mirror acknowledging application. Measures commit delay when synchronous_commit is set to remote_apply |
milliseconds (ms) | p3 | In default synchronous replication between Primary and Mirror, values >1s slow down transactions. For async replication, increase threshold accordingly. |
| Rows Insert/Update/Delete | Number of INSERT, UPDATE, or DELETE operations | short | ||
| Checkpoint buffers | buffers_checkpoint: buffers written during checkpoint buffers_clean: buffers written by background writer buffers_backend: buffers written directly by backend processes |
short | ||
| Top 10 Replication Lag Size | Top 10 WAL sizes for replication lag | bytes | p3 | In default synchronous replication, >1GB causes slow commits. For async replication, increase threshold accordingly. |
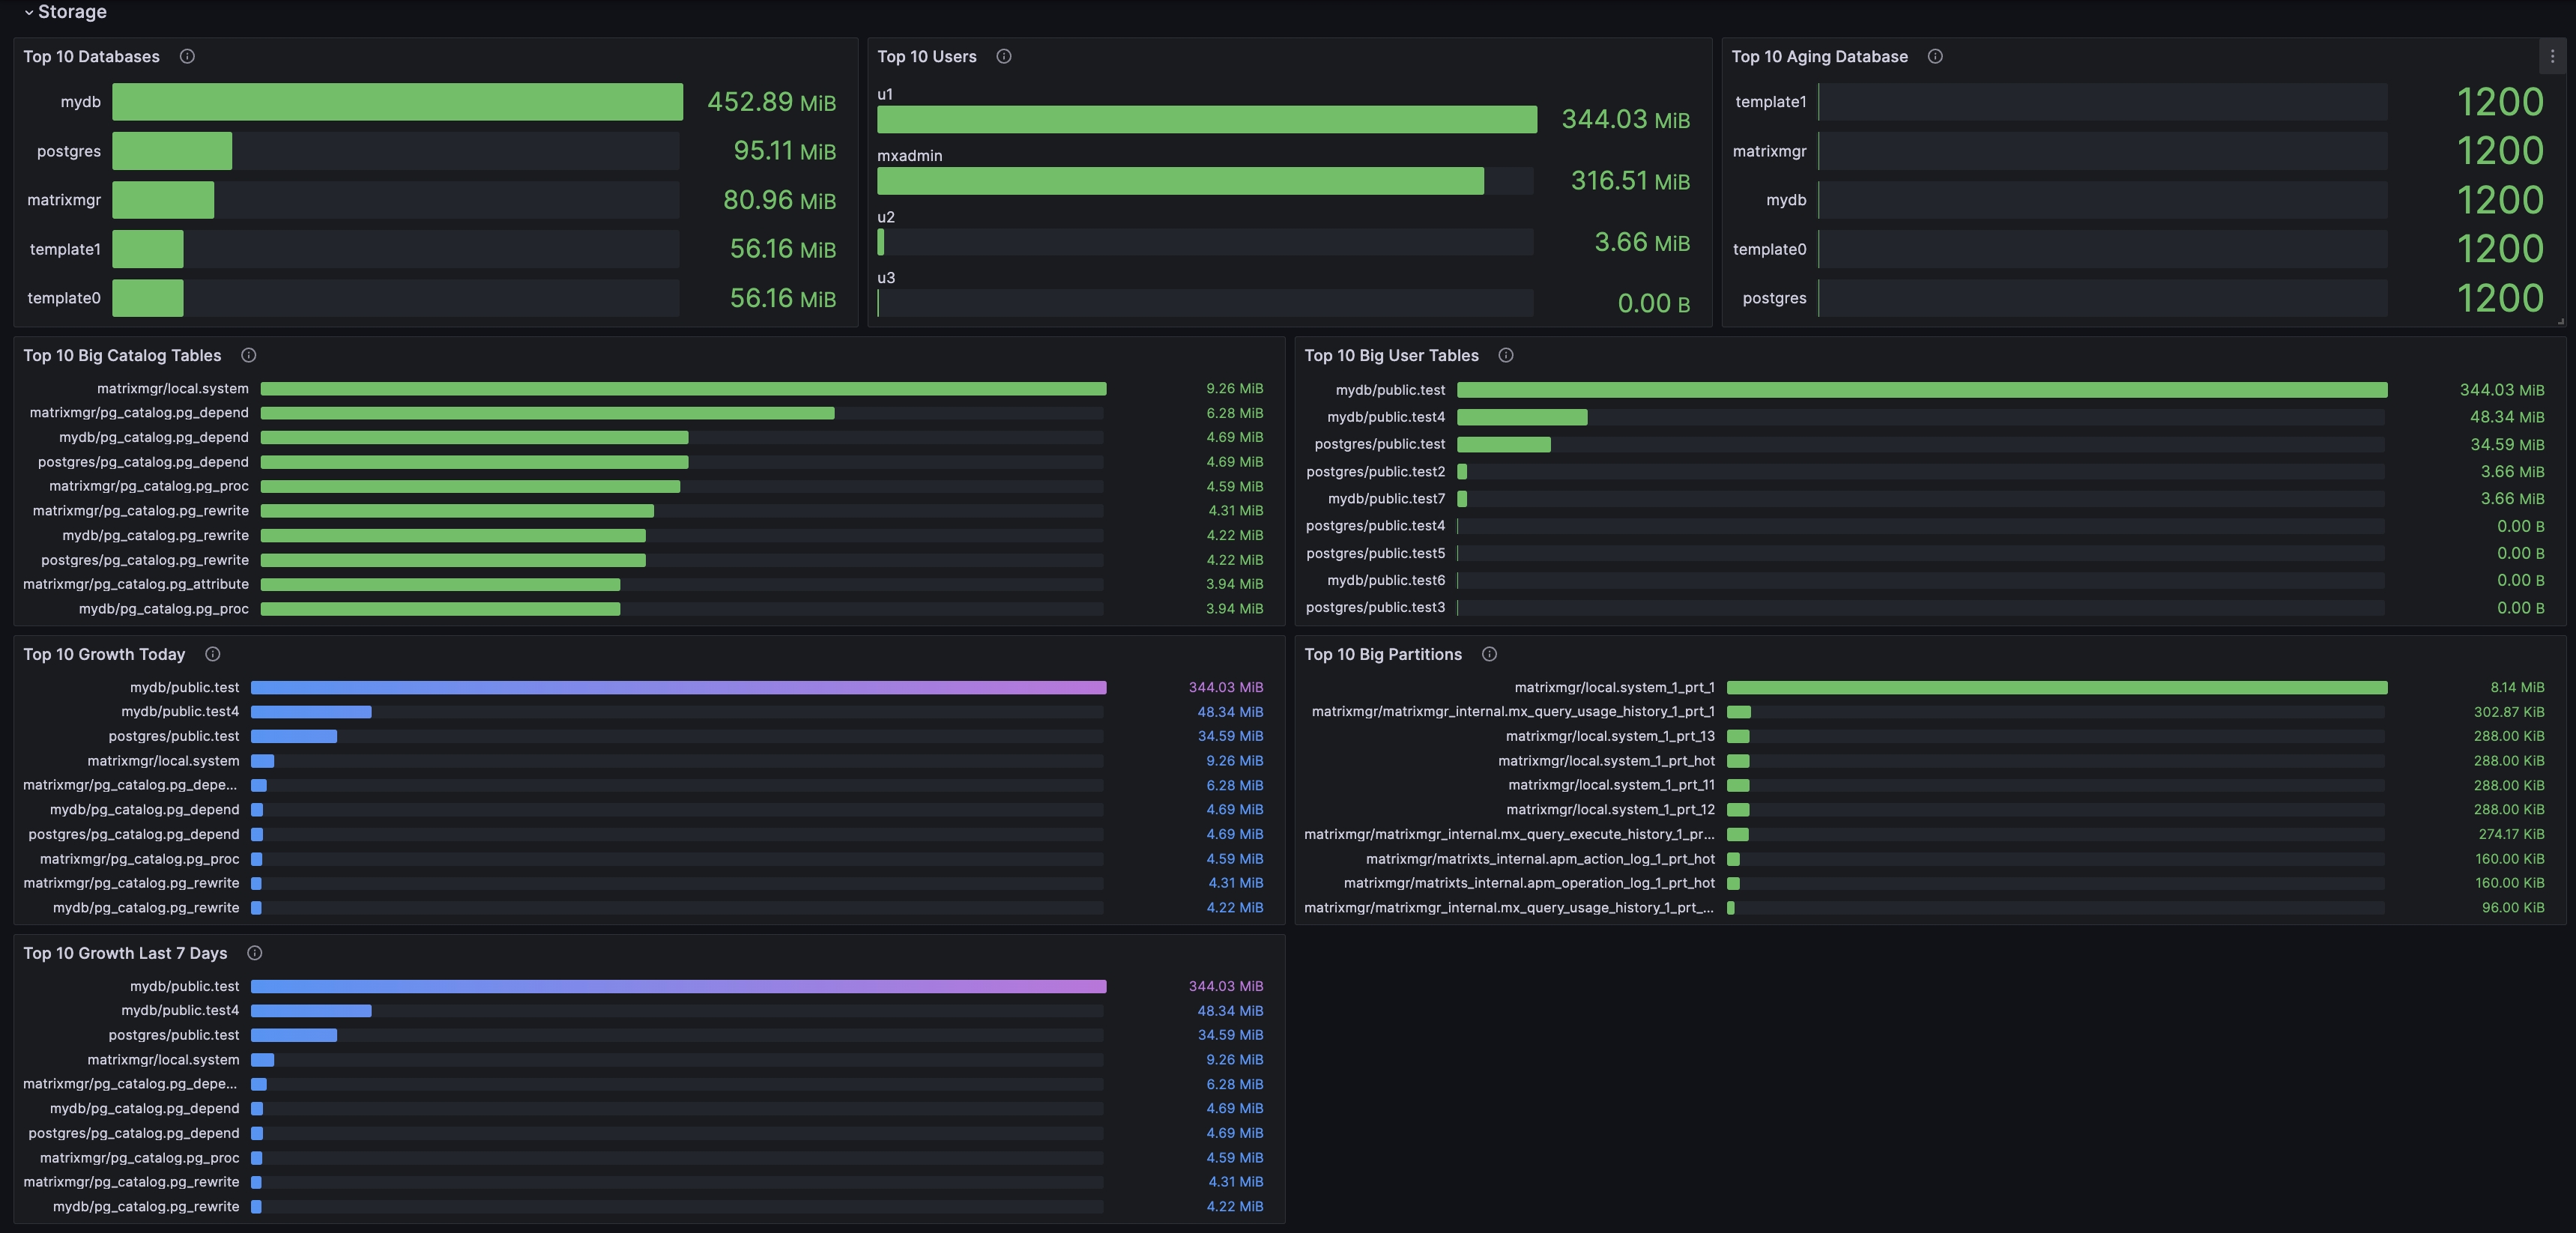
This section shows storage-related statistics:
| Metric | Description | Unit | Level | Recommended Alert Threshold |
|---|---|---|---|---|
| Top 10 Database | Top 10 largest databases | bytes | ||
| Top 10 Users | Top 10 users by data size | bytes | ||
| Top 10 Aging Database | Top 10 databases by age | short | p2 | Maximum database age is 21E. Instance stops when only 1E remains. Logs warn at 5E. Recommend alerting at 6E and 2E. |
| Top 10 Big Tables | Top 10 largest tables | bytes | ||
| Top 10 Big Partitions | Top 10 largest partitioned tables | bytes | ||
| Top 10 Growth Today | Top 10 tables with highest data growth today | bytes | ||
| Top 10 Growth Last 7 Days | Top 10 tables with highest data growth in last 7 days | bytes |

| Metric | Description | Unit | Level | Recommended Alert Threshold |
|---|---|---|---|---|
| Version | mxgate version | |||
| Uptime | mxgate runtime | seconds (s) | ||
| Process ID | mxgate backend process PID | short | p2 | No PID may indicate mxgate is down |

| Metric | Description | Unit | Level | Recommended Alert Threshold |
|---|---|---|---|---|
| Target Table | Target table for data insertion | |||
| Total Rows Inserted | Total successfully inserted rows since mxgate started | short | ||
| Total Failed Rows | Total failed insertions since mxgate started | short | p3 | Set threshold based on requirements |
| Total Inserted Size | Total data size successfully inserted since mxgate started | short | ||
| Concurrency | Concurrency total: configured as stream - prepared + 1 (maximum concurrency) Active count: actual working concurrency (some threads may sleep, so actual concurrency may be lower) |
short | ||
| Transaction Time Granularity | Time span of data transaction commits | short | ||
| Target Table Blocked | Number of blocked target tables | short |
| Metric | Description | Unit | Level | Recommended Alert Threshold |
|---|---|---|---|---|
| Committed Rows | Number of rows committed for this job | short | ||
| Inserted Rows | Number of rows inserted for this job | short | ||
| Blocked Rows | Number of blocked rows for this job | short | p3 | Set threshold based on requirements |
| Failed Rows | Number of write failures for this job | short | p3 | Set threshold based on requirements |
| Written Data Size | Total bytes written by this job | bytes |

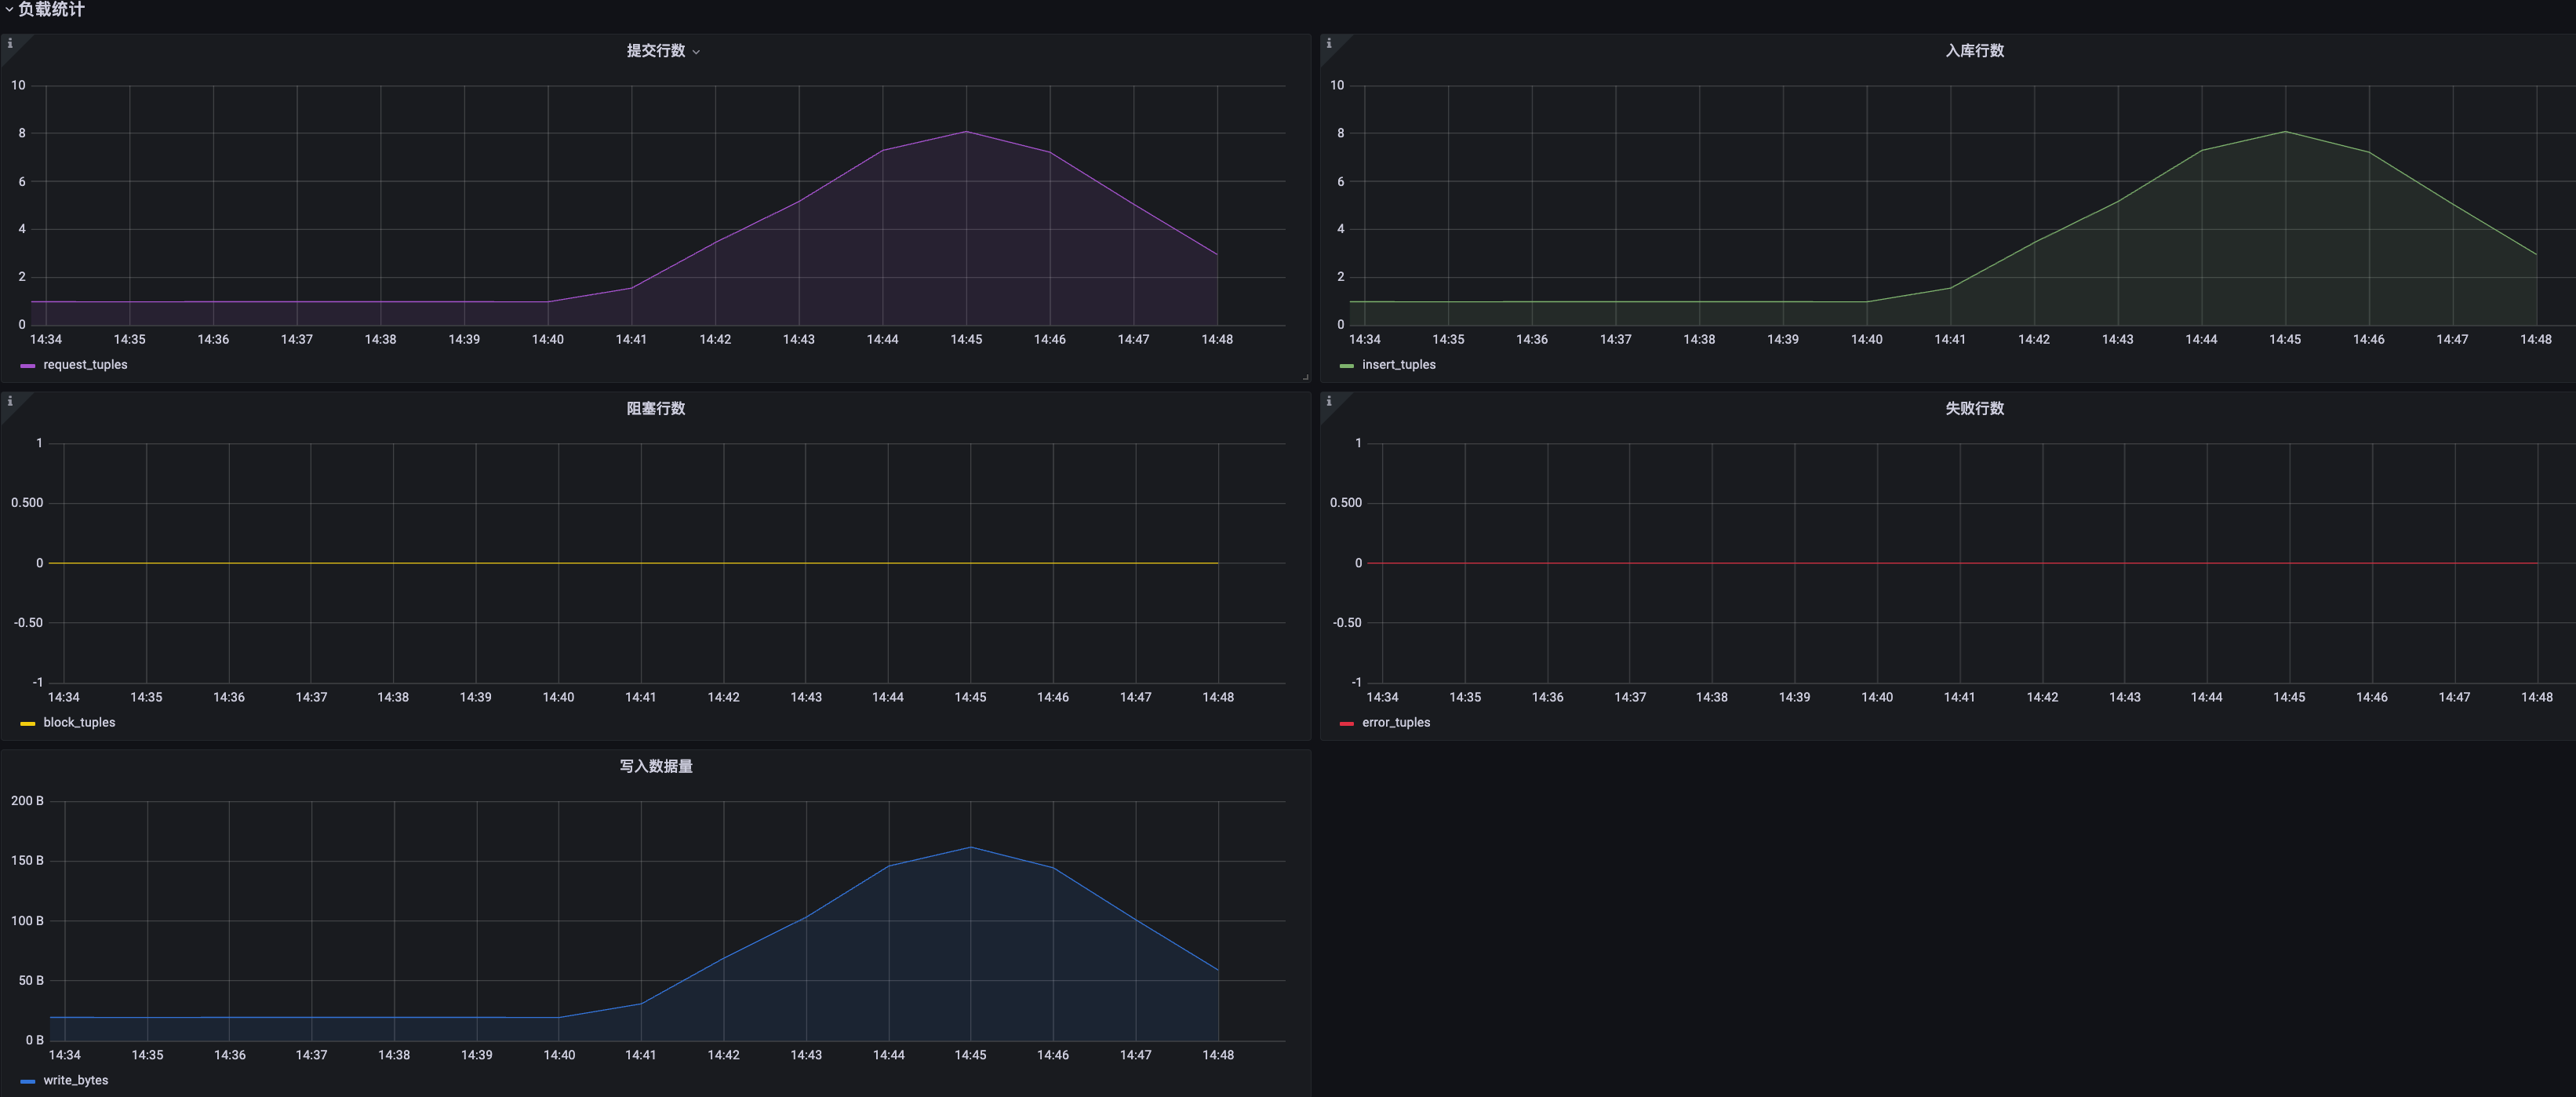
Latency across data ingestion stages, shown as statistical values over time:
| Metric | Description | Unit | Level | Recommended Alert Threshold |
|---|---|---|---|---|
| Total Latency | Sum of the following latencies | nanoseconds (ns) | p3 | 30s |
| insertStart Latency | Time from executing INSERT to sending first data to Segment | nanoseconds (ns) | ||
| write Latency | Time mxgate takes to send this batch to Segment | nanoseconds (ns) | ||
| insertDone Latency | Time from sending last data to Segment to completion of INSERT (data redistribution and disk persistence across Segments) | nanoseconds (ns) | ||
| commit Latency | Time to execute COMMIT command | nanoseconds (ns) |
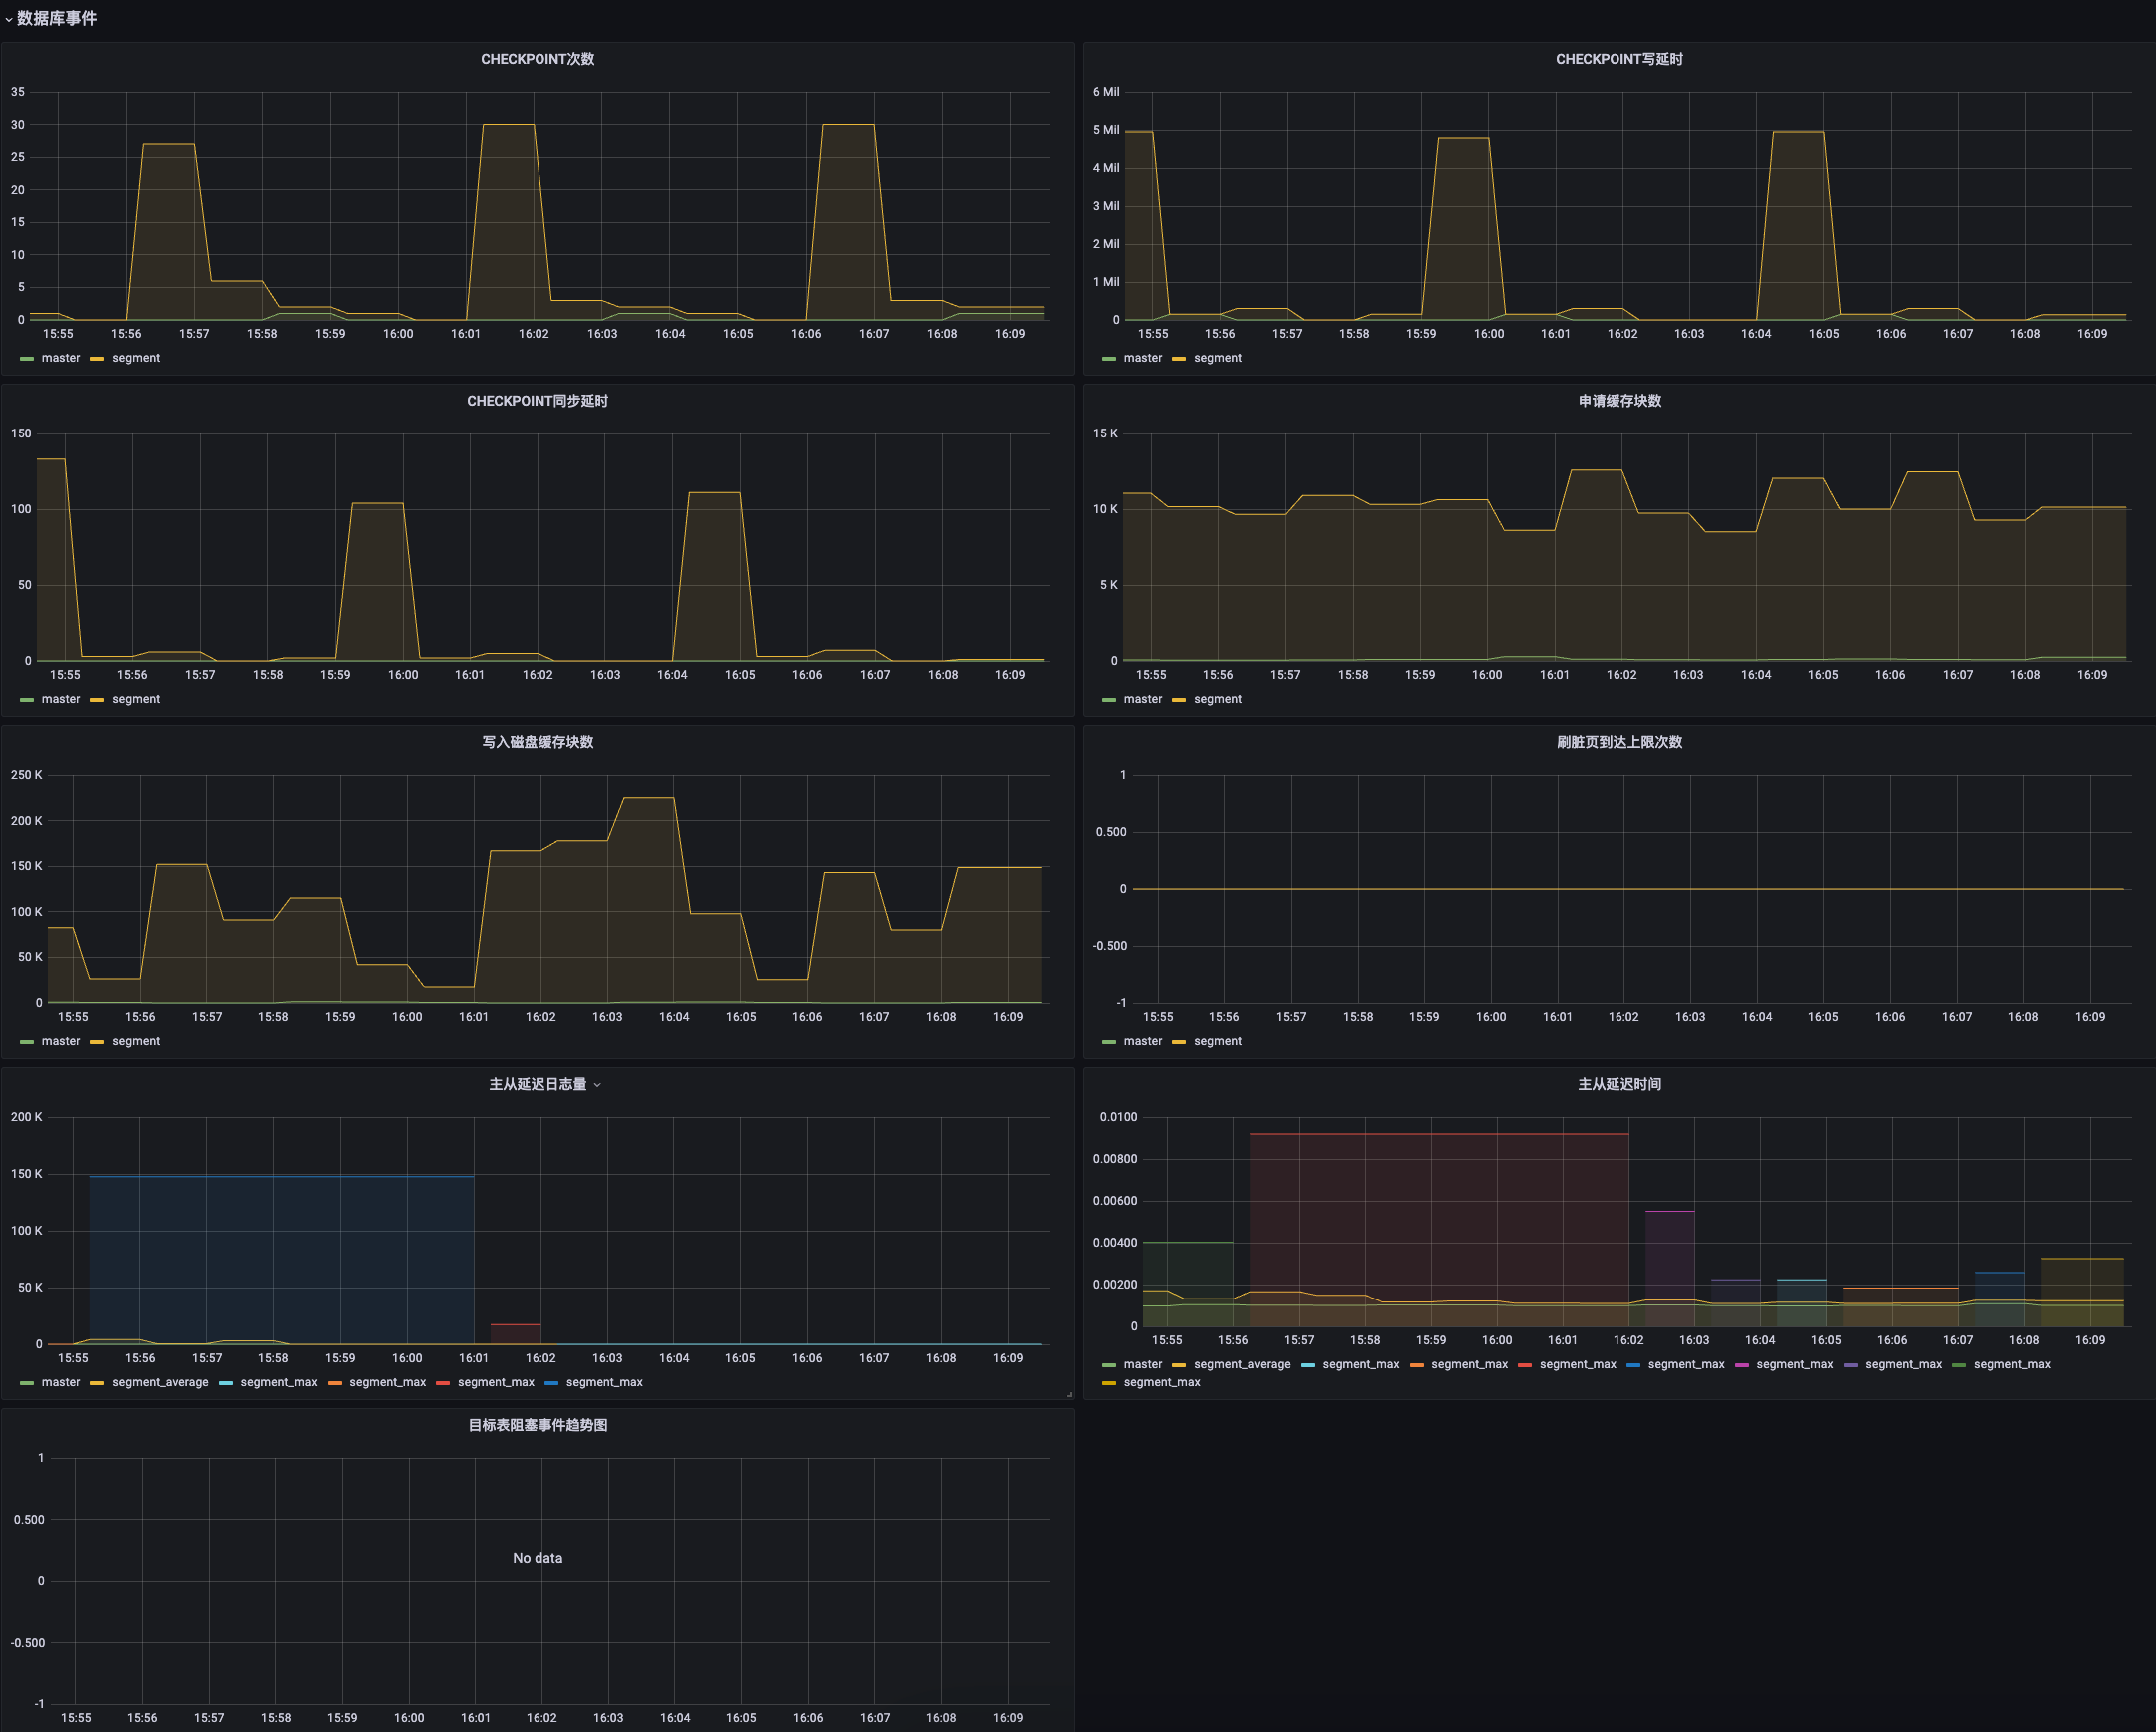
| Metric | Description | Unit | Level | Recommended Alert Threshold |
|---|---|---|---|---|
| CHECKPOINT Count | Number of CHECKPOINT executions per minute | short | ||
| CHECKPOINT Write Latency | Total time spent writing files to disk during checkpoint, in milliseconds | milliseconds (ms) | ||
| CHECKPOINT Sync Latency | Total time spent syncing files to disk during checkpoint, in milliseconds | milliseconds (ms) | ||
| Allocated Buffer Count | Number of allocated buffers | short | ||
| Written Disk Buffer Count | Three categories: 1. Buffers written during checkpoint 2. Buffers written by background writer 3. Buffers written directly by a backend |
short | ||
| Dirty Page Flush Limit Reached | Number of times background writer stopped due to exceeding buffer write limit | short | ||
| Primary-Standby WAL Lag | WAL delay between Master and Standby or Primary and Mirror | bytes | ||
| Primary-Standby Latency | Time delay between Master and Standby or Primary and Mirror | milliseconds (ms) | ||
| Target Table Blocking Trend | Four categories: 1. Lock-related 2. Replication-related 3. Resource group-related 4. Resource queue-related |
short |

| Metric | Description | Unit | Level | Recommended Alert Threshold |
|---|---|---|---|---|
| CPU Busy | Percentage of time all CPU cores are busy | 0-1 | ||
| Sys Load (5m avg) | Average CPU load across all cores over 5 minutes | 0-1 | p3/p2 | CPU cores 3 / CPU cores 5 |
| Sys Load (15m avg) | Average CPU load across all cores over 15 minutes | 0-1 | p3/p2 | CPU cores 3 / CPU cores 5 |
| RAM Used | Used memory (total - free - buffer/cache) | 0-1 | ||
| SWAP Used | Used swap memory | 0-1 | p3 | 80% |
| Root FS Used | Root filesystem usage | 0-1 | p3/p2 | 60%/80% |
| CPU Cores | Number of physical CPU cores | short | ||
| RootFS Total | Total root filesystem space | bytes | p3/p2 | 60%/80% |
| Uptime | System uptime | seconds (s) | ||
| RAM Total | Total memory size | bytes | ||
| SWAP Total | Swap partition size | bytes |

| Metric | Description | Unit | Level | Recommended Alert Threshold |
|---|---|---|---|---|
| CPU Basic | Basic CPU information from /proc/stat | 0-1 | ||
| Memory Basic | Basic memory information | bytes | ||
| Network Traffic Basic | Basic network info per interface | bit | p3/p2 | 60% / 80% of NIC max bandwidth |
| Disk Space Used Basic | Disk usage percentage of all mounted filesystems | 0-1 | p3 | 60% / 80% disk usage |
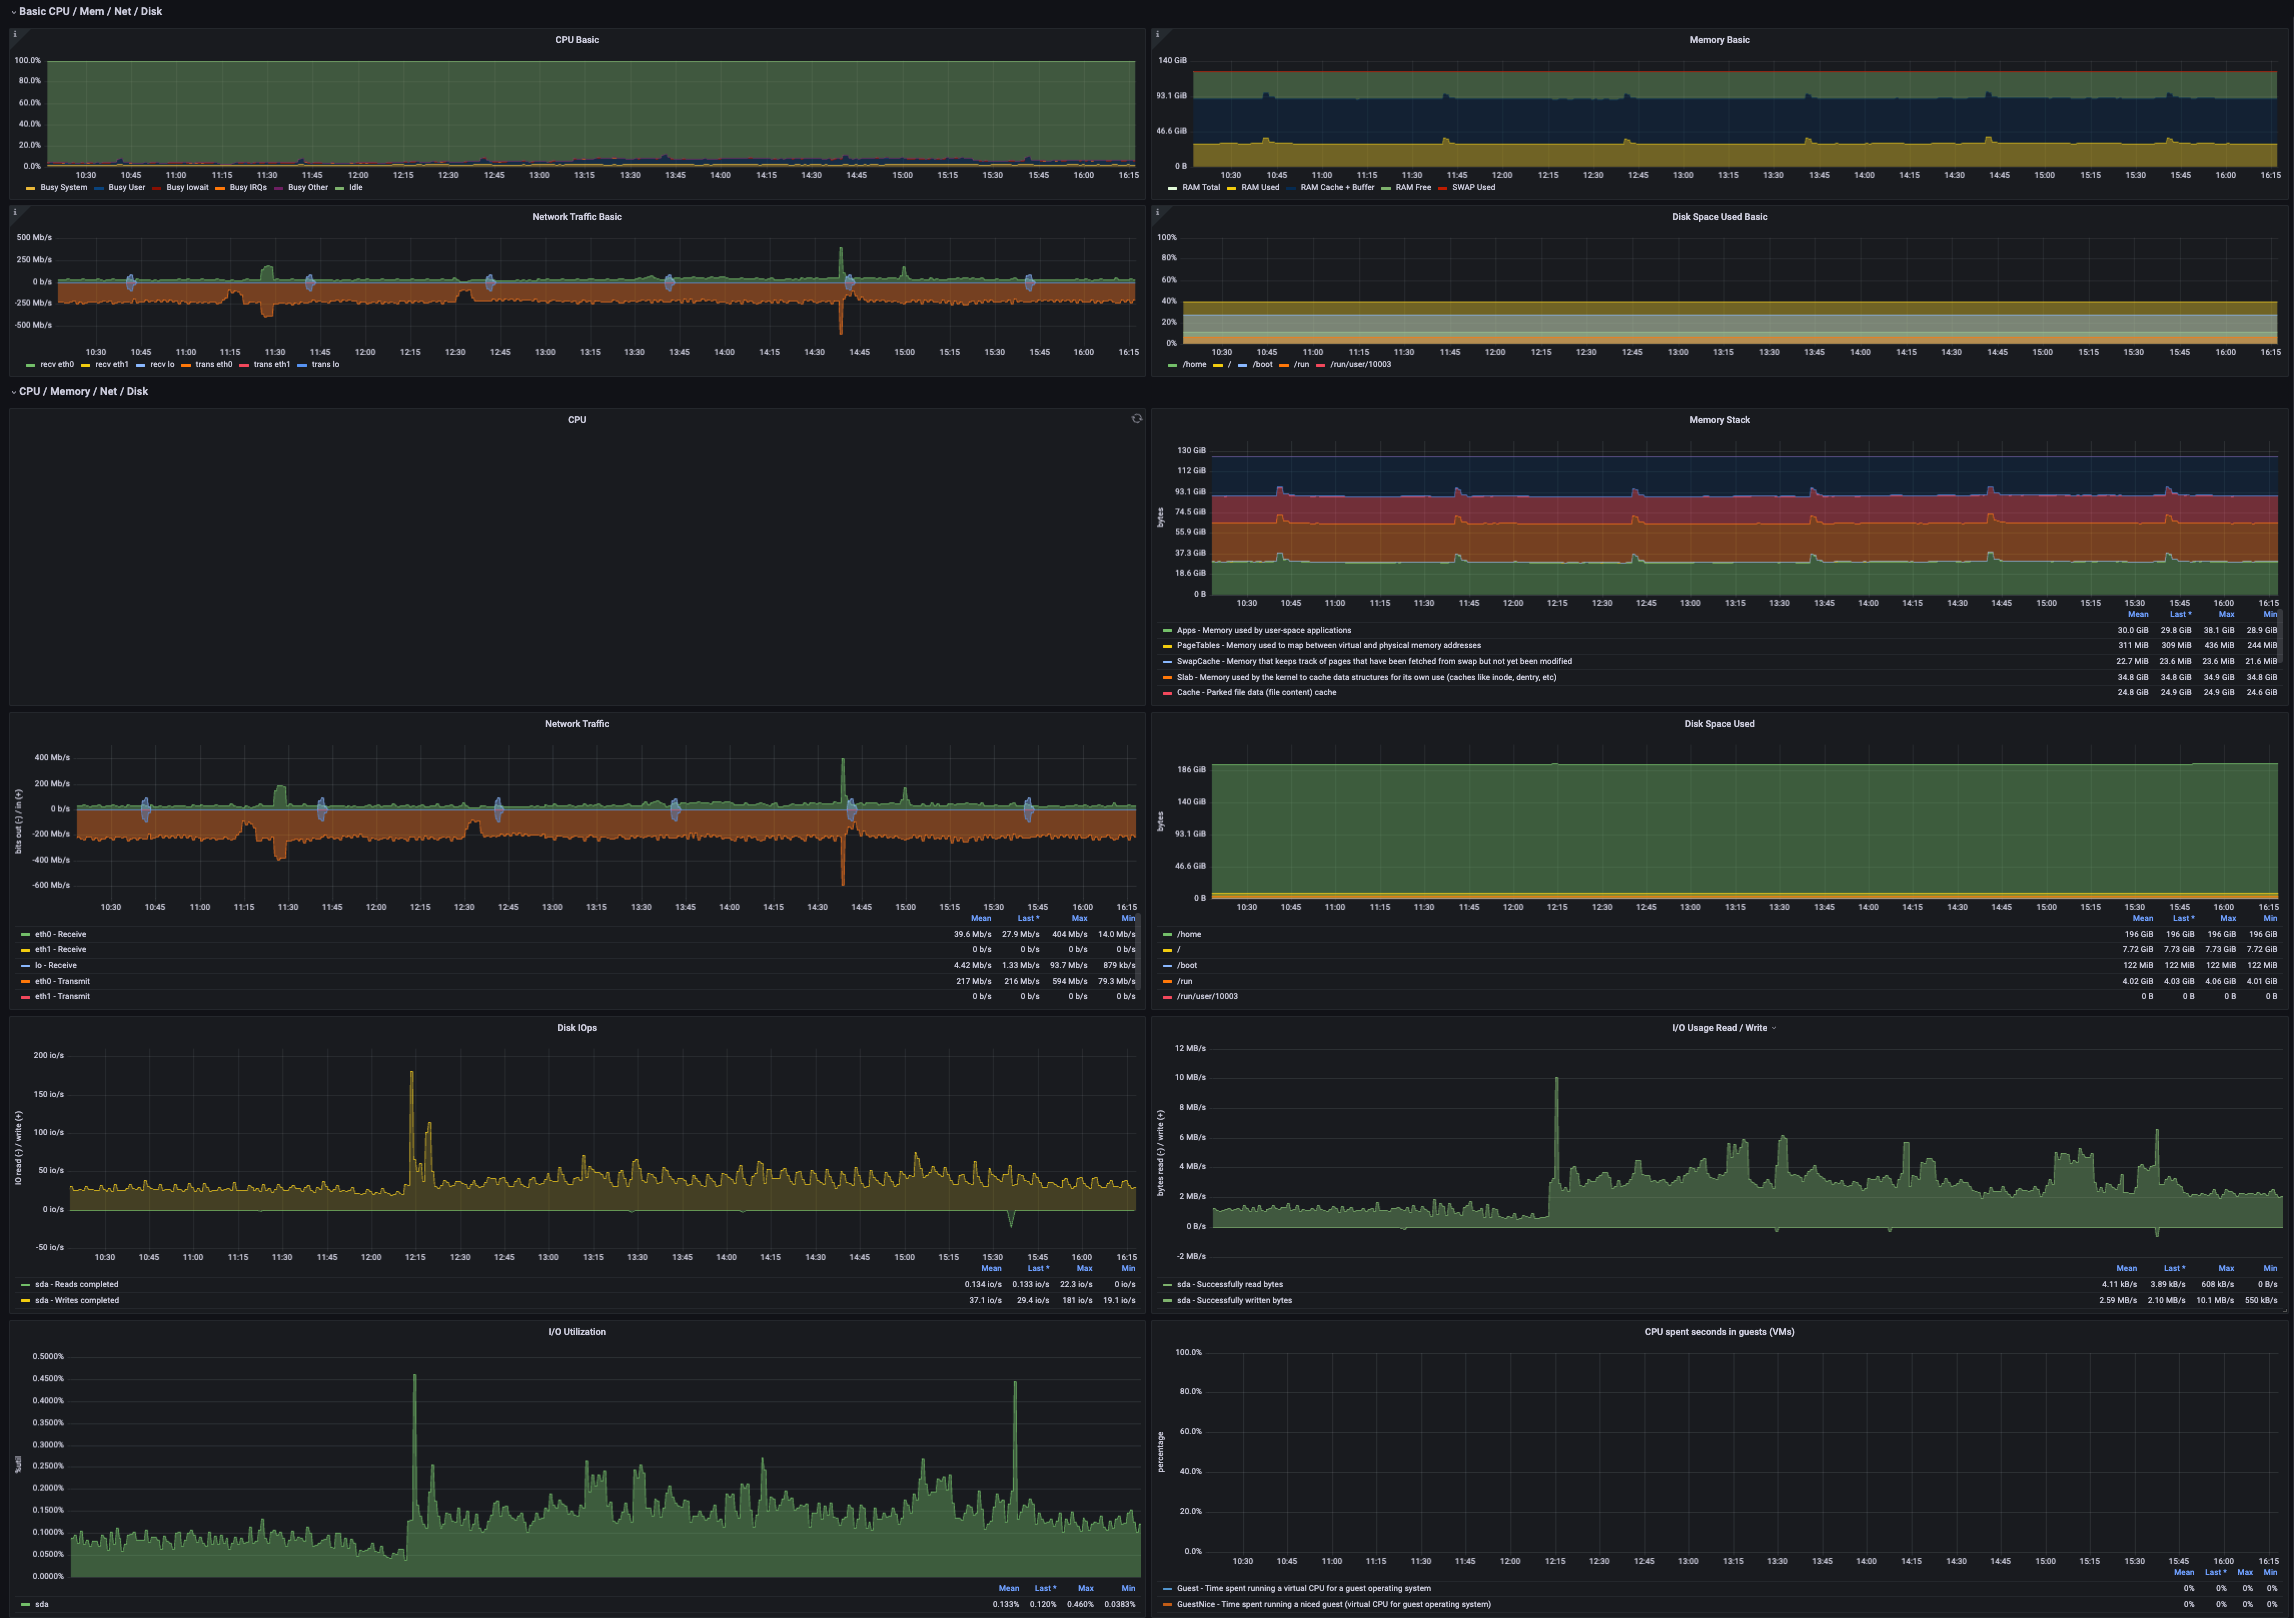
| Metric | Description | Unit | Level | Recommended Alert Threshold |
|---|---|---|---|---|
| CPU | CPU time spent in kernel mode | short | ||
| Memory Stack | Memory stack from /proc/meminfo | bytes | ||
| Network Traffic | Transfer rate per network interface | bytes/sec | ||
| Disk Space Used | Disk space used on all mounted filesystems | bytes | ||
| Disk IOps | Disk read/write operations | I/O ops/sec (iops) | ||
| I/O Usage Read / Write | Disk read/write throughput | bytes | ||
| I/O Utilization | I/O utilization | 0-1 | p3/p2 | 60% / 80% |
| CPU spent seconds in guests (VMs) | Time spent running a guest with nice value | milliseconds (ms) |
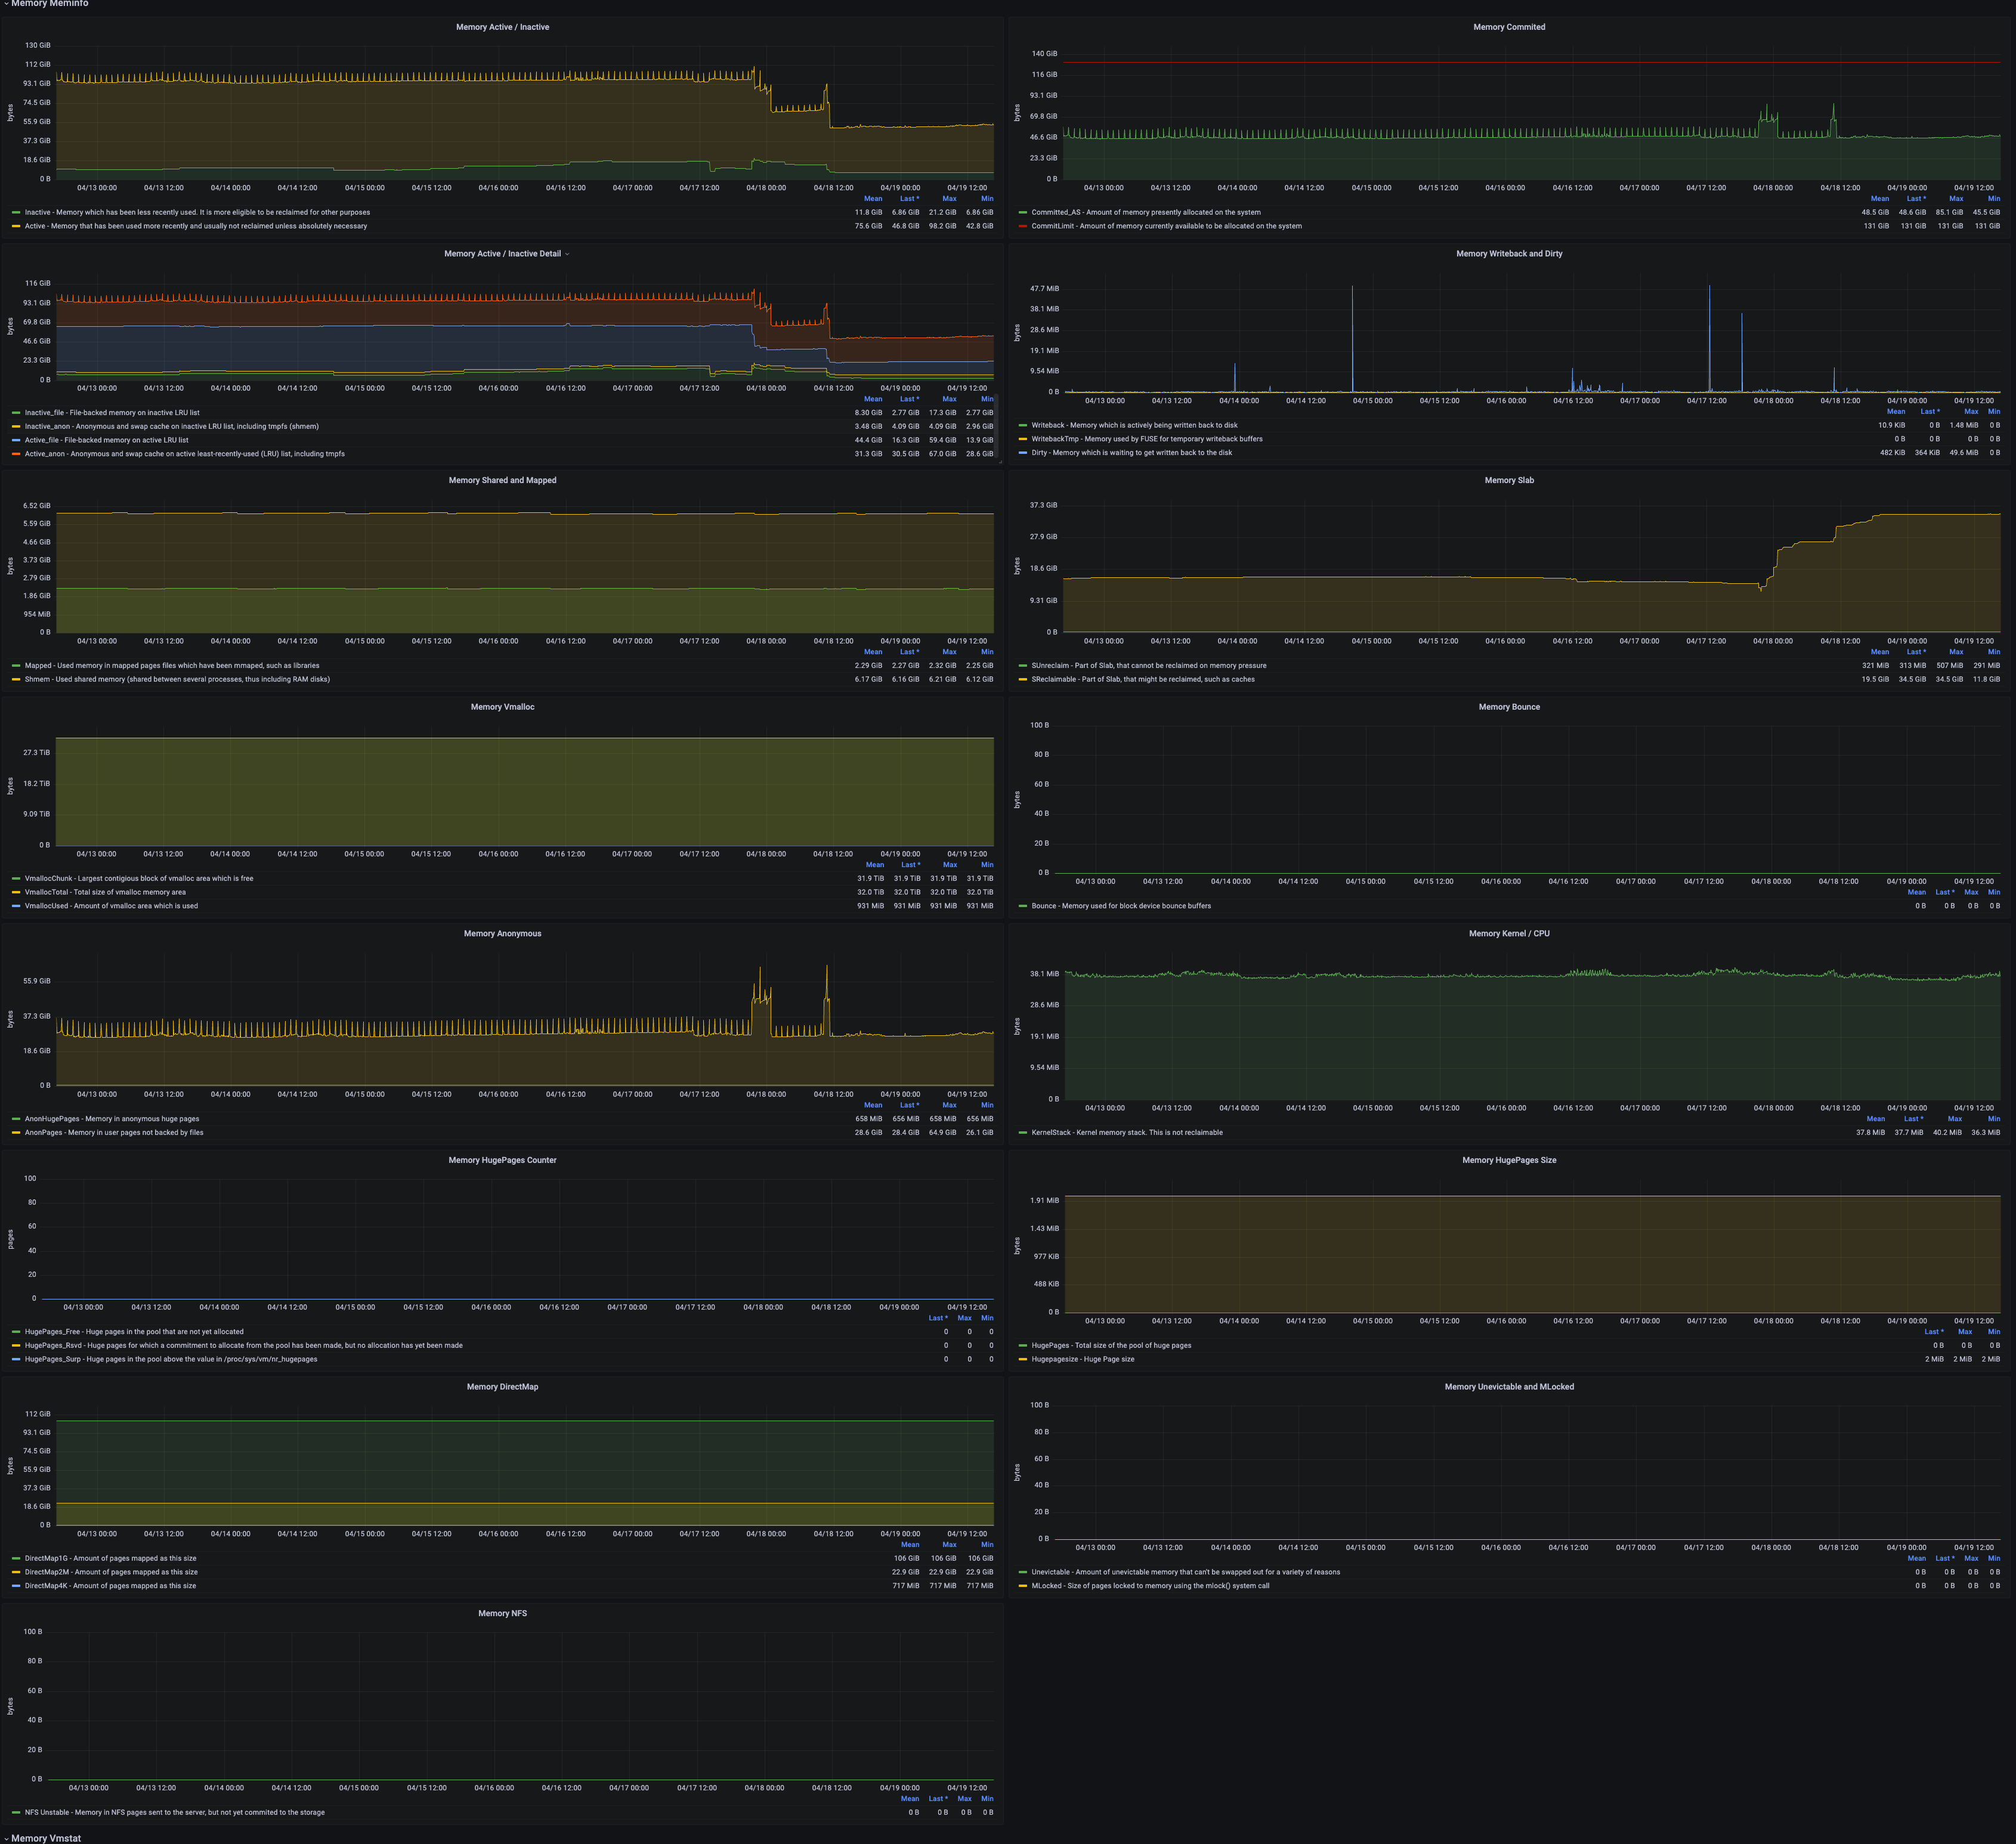
| Metric | Description | Unit | Level | Recommended Alert Threshold |
|---|---|---|---|---|
| Memory Active / Inactive | Frequently/recently used vs. less used memory | |||
| Memory Active / Inactive Detail | Inactive_file - File-backed pages not accessed recently (LRU_INACTIVE_FILE) Inactive_anon - Anonymous pages not accessed recently (LRU_INACTIVE_ANON) Active_file - Recently accessed file-backed pages (LRU_ACTIVE_FILE) Active_anon - Recently accessed anonymous pages (LRU_ACTIVE_ANON) |
bytes | ||
| Memory Shared and Mapped | Mapped - Memory used by mapped cache pages (Mapped) Shmem - Shared memory (Shmem) |
bytes | ||
| Memory Vmalloc | VmallocChunk - Largest contiguous vmalloc memory block VmallocTotal - Total vmalloc memory available VmallocUsed - Total vmalloc memory used |
bytes | ||
| Memory Anonymous | Active_anon - Recently used anonymous virtual memory pages (nr_active_anon) Active_file - Recently used file-backed virtual memory pages (nr_active_file) |
bytes | ||
| Memory HugePages Counter | HugePages_Free - Free HugePages count HugePages_Rsvd - Reserved HugePages (requested but not yet allocated) HugePages_Surp - Surplus HugePages beyond configured resident count |
bytes | ||
| Memory DirectMap | DirectMap1G - Memory mapped with 1G pages DirectMap2M - Memory mapped with 2M pages DirectMap4K - Memory mapped with 4K pages |
bytes | ||
| Memory NFS | NFS Unstable - Pages sent to NFS server but not yet written to disk | bytes | ||
| Memory Committed | Currently allocated memory (including allocated but unused) Total allocatable memory |
bytes | p3/p2 | 60% / 80% |
| Memory Writeback and Dirty | Writeback - Pages actively being written back to disk WritebackTmp - Memory used by FUSE for temporary write buffers Dirty - Data pending write to disk |
bytes | ||
| Memory Slab | Reclaimable - Reclaimable slab memory (nr_slab_reclaimable) Unreclaimable - Non-reclaimable slab memory (nr_slab_unreclaimable) |
bytes | ||
| Memory Bounce | Bounce - Memory used by bounce buffers | bytes | ||
| Memory Kernel / CPU | KernelStack - Kernel stack size (resident, non-reclaimable) PerCPU - Memory allocated per CPU for module loading |
bytes | ||
| Memory HugePages Size | HugePages - Total number of HugePages Hugepagesize - Size per HugePage |
bytes | ||
| Memory Unevictable MLocked | Unevictable - Non-reclaimable memory MLocked - Memory locked by mlock() |
bytes |
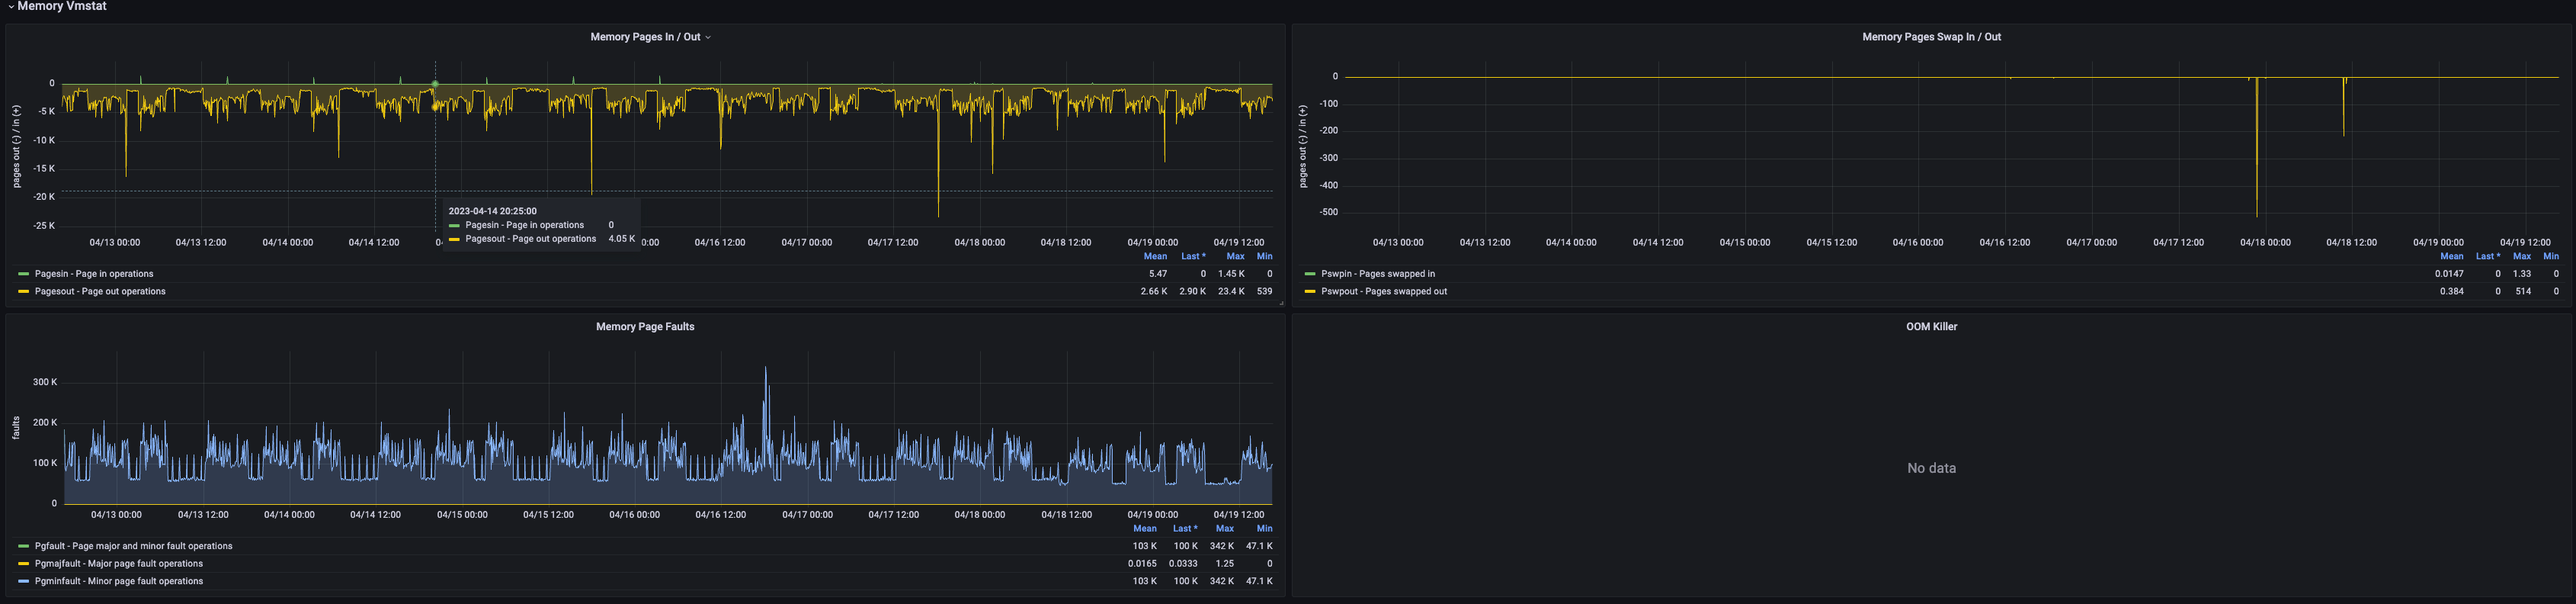
| Metric | Description | Unit | Level | Recommended Alert Threshold |
|---|---|---|---|---|
| Memory Pages In / Out | Pagesin - Rate of data read from disk to physical memory (5-minute average) Pagesout - Rate of data written from physical memory to disk (5-minute average) |
short | ||
| Memory Page Faults | Pgfault - Average minor and major page faults (5-minute average) Pgmajfault - Average major page faults Pgminfault - Average minor page faults |
short | ||
| Memory Pages Swap In / Out | Pswpin - Rate of data swapped in from disk (5-minute average) Pswpout - Rate of data swapped out to disk (5-minute average) |
short | ||
| OOM Killer | Number of OOM Killer invocations | short | p3 | Alert on any change |
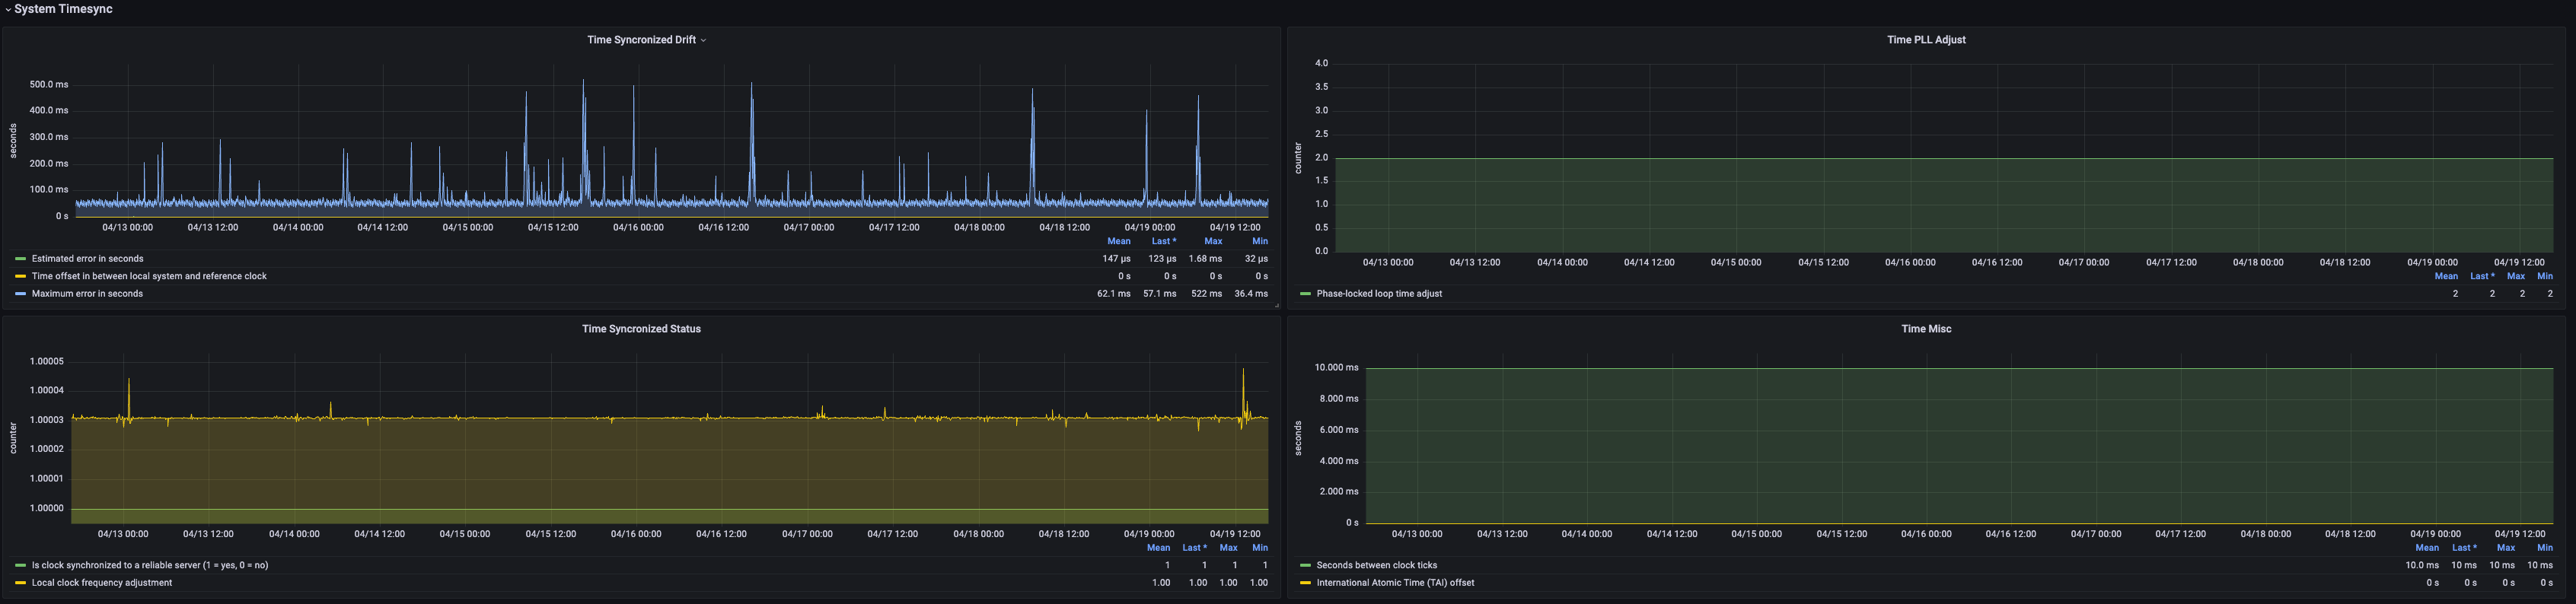
| Metric | Description | Unit | Level | Recommended Alert Threshold |
|---|---|---|---|---|
| Time Synchronized Drift | Estimated error (seconds) Time offset between local system and reference clock Maximum error (seconds) |
short | ||
| Time Synchronized Status | Whether clock is synchronized with a reliable server Estimated error (seconds) |
short | ||
| Time PLL Adjust | Phase-locked loop time adjustment | short | ||
| Time Misc | Seconds between clock ticks TAI (International Atomic Time) offset |
short |
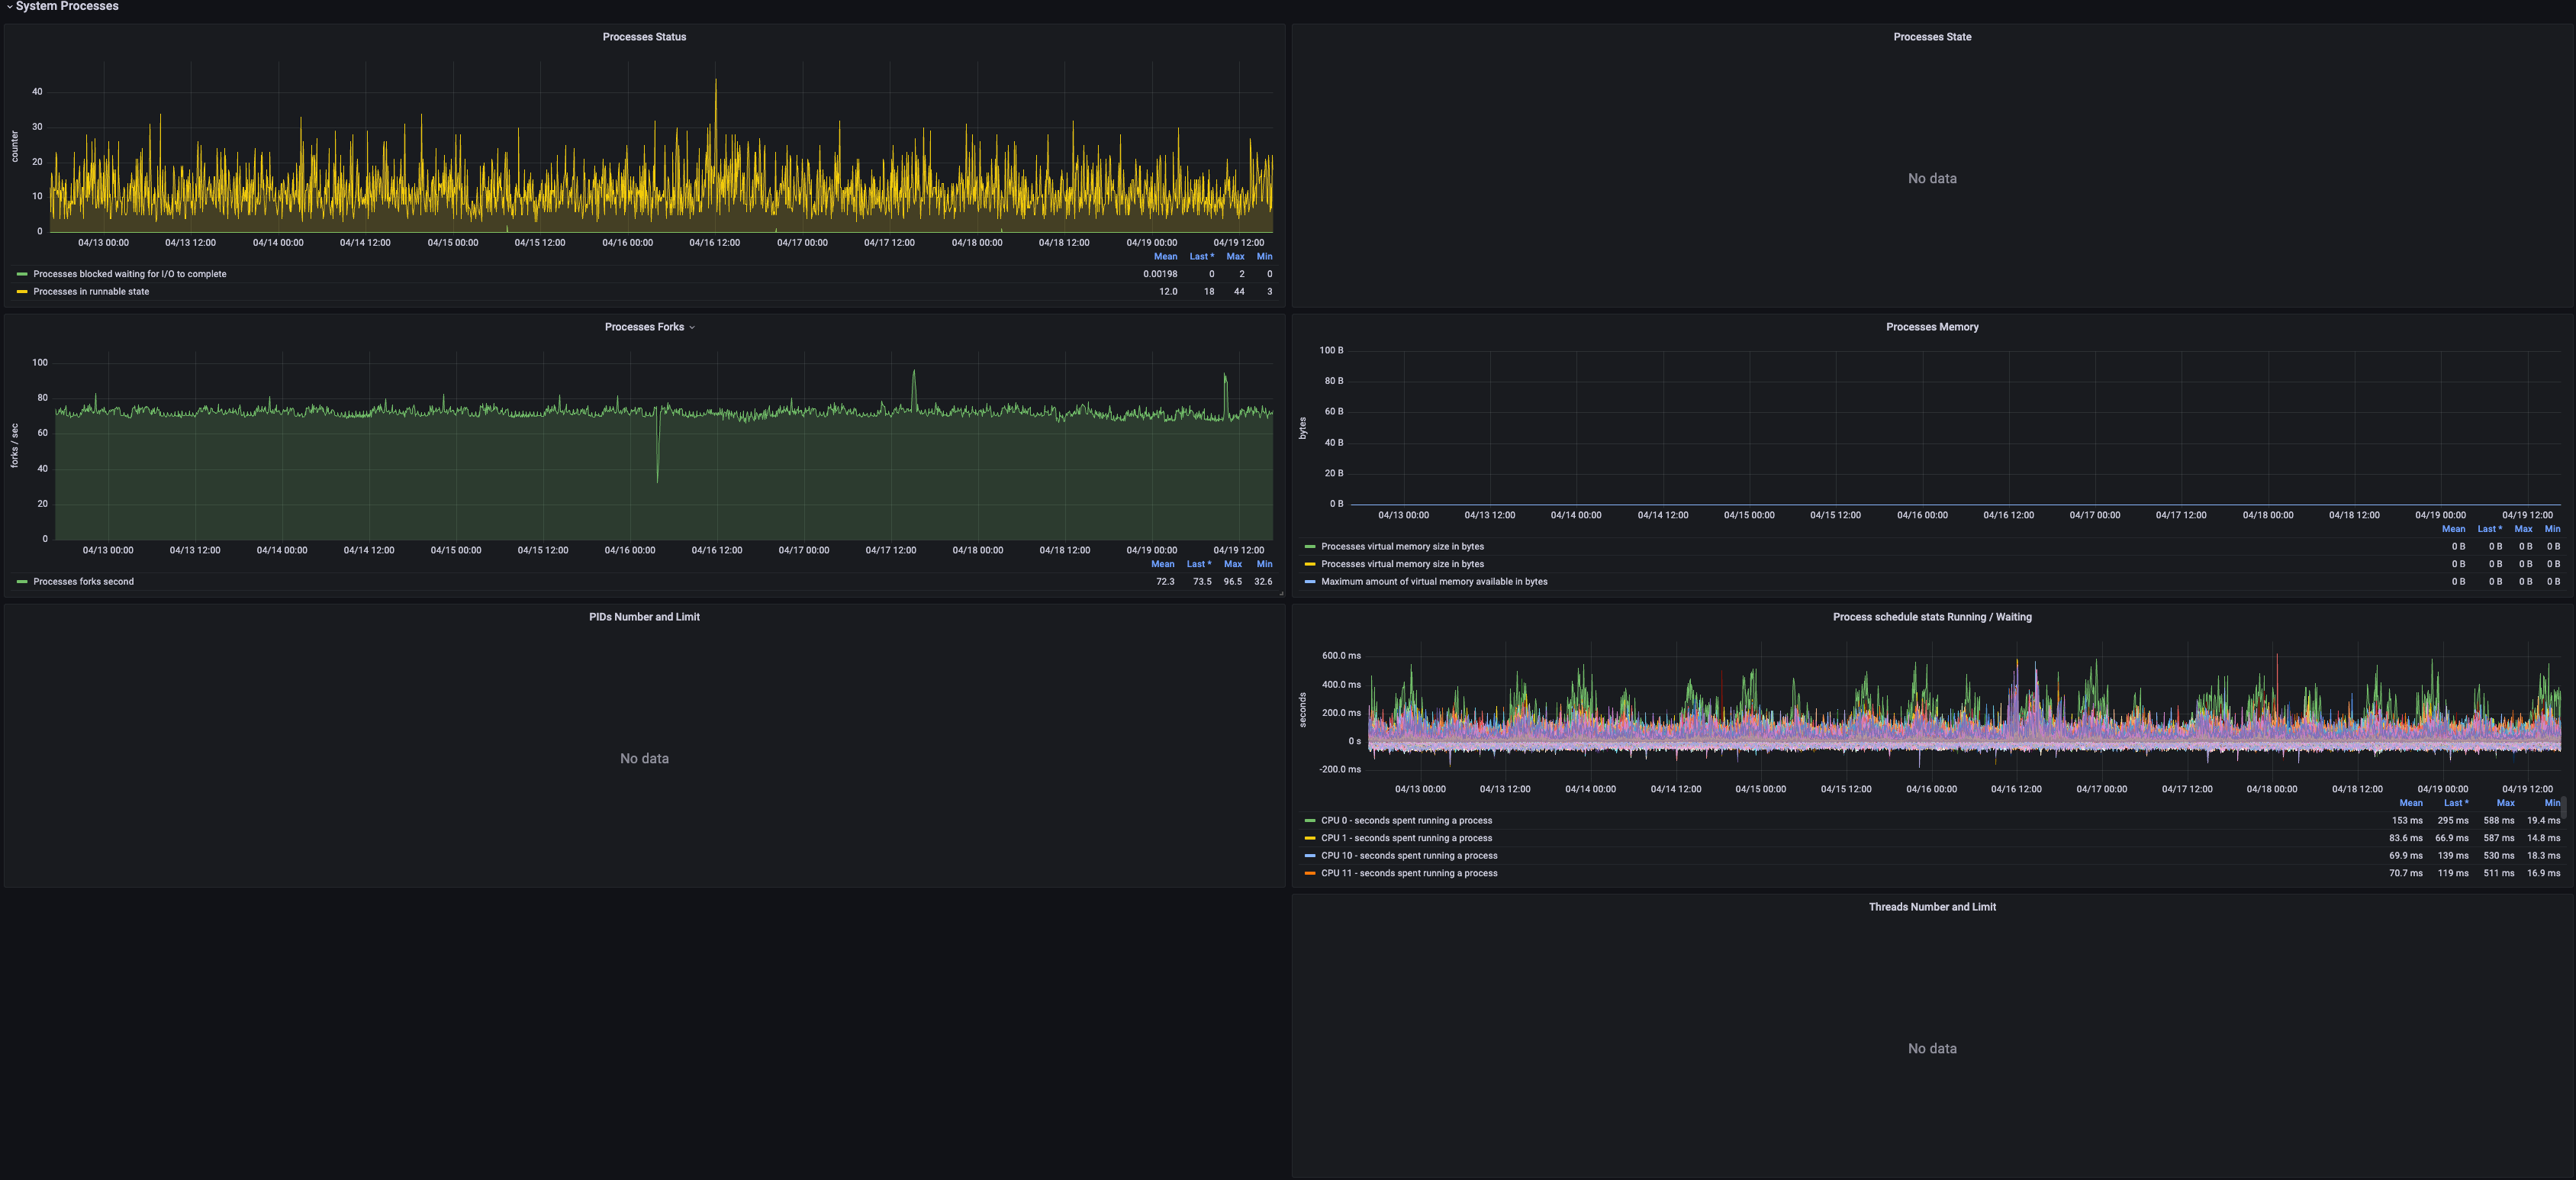
| Metric | Description | Unit | Level | Recommended Alert Threshold |
|---|---|---|---|---|
| Processes Status | Processes blocked - Number of currently blocked tasks (procs_blocked) Processes in runnable state - Number of tasks in run queue (procs_running) |
short | p3 | blocked: 10 |
| Processes Forks | Processes forks per second - Number of processes created per second | short | ||
| PIDS Number and Limit | Current number of running processes Maximum process limit on host |
short | p3/p2 | 15000 / 20000 |
| Processes Memory | Virtual memory used by processes Maximum virtual memory available to processes |
bytes | ||
| Process schedule stats Running / Waiting | Time to start a process CPU wait time |
ms | ||
| Threads Number and Limit | Total number of threads Maximum thread limit on host |
short |

| Metric | Description | Unit | Level | Recommended Alert Threshold |
|---|---|---|---|---|
| Context Switches / Interrupts | Context switches - Average number of CPU context switches (5-minute average) Interrupts - Average total interrupts handled (5-minute average) |
short | ||
| Interrupts Detail | List of soft interrupts and their average counts (5-minute average) | short | ||
| Entropy | Available for random number generation | short | ||
| File Descriptors | Maximum open file descriptors Current open file descriptors |
short | ||
| Schedule timeslices executed by each cpu | Time slices scheduled per CPU | short | ||
| CPU time spent in user and system contexts | CPU time in user and system contexts | short |
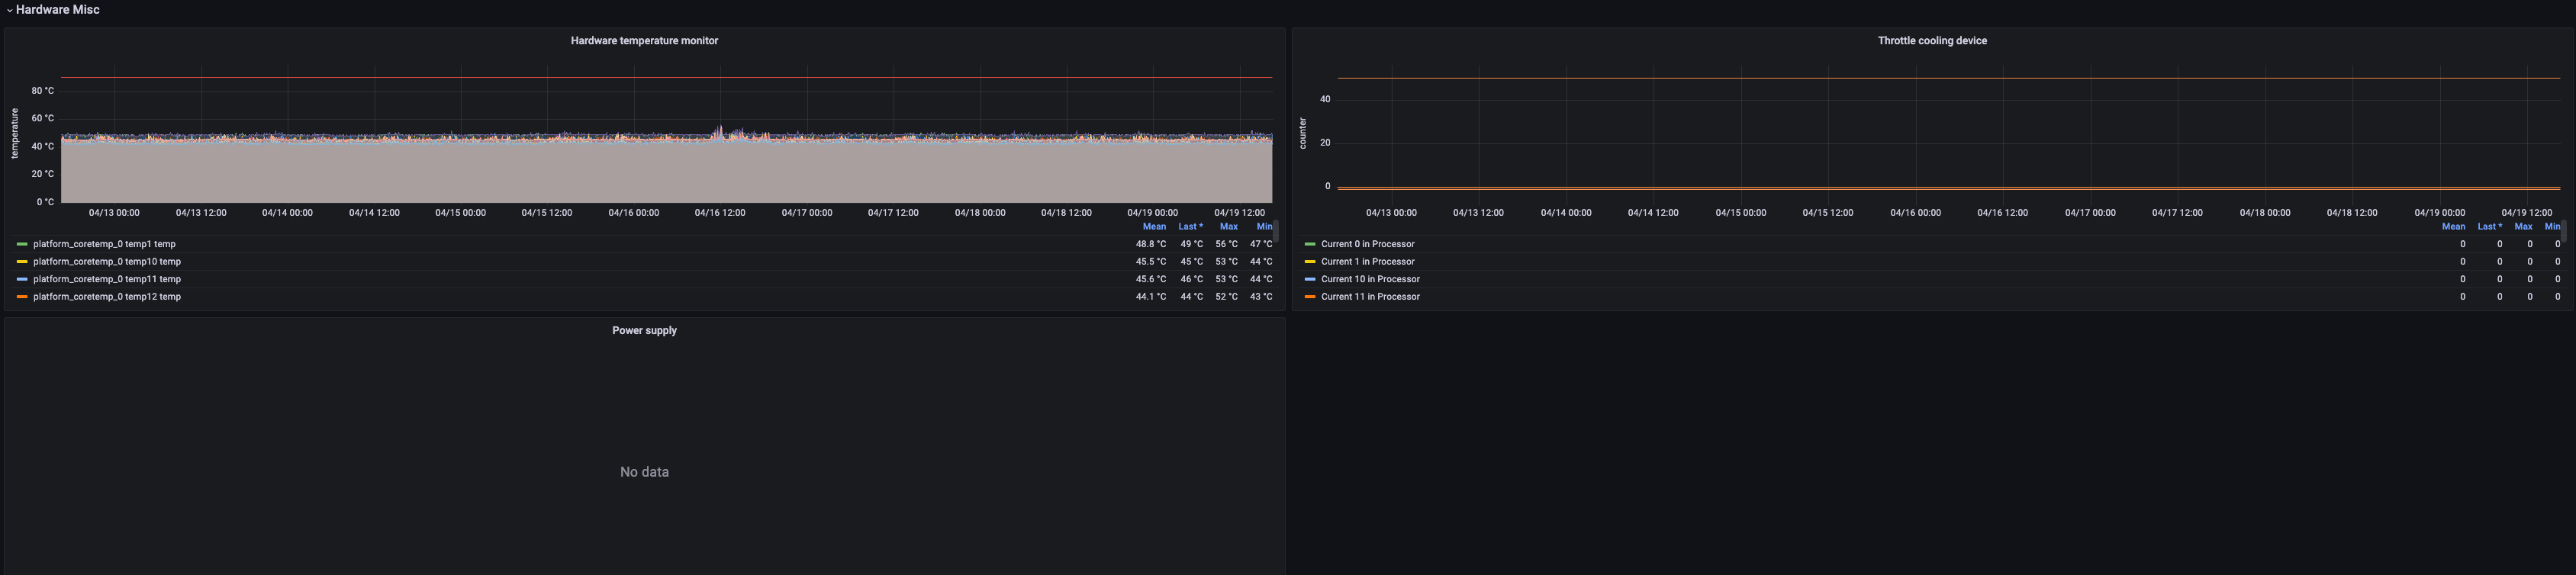
| Metric | Description | Unit | Level | Recommended Alert Threshold |
|---|---|---|---|---|
| Hardware temperature monitor | Hardware temperature monitoring | Celsius (℃) | ||
| Power supply | Whether powered | short | ||
| Throttle cooling device | Cooling device status | short |
| Metric | Description | Unit | Level | Recommended Alert Threshold |
|---|---|---|---|---|
| Systemd Sockets | Total accepted connections on sockets | short | ||
| Systemd Units State | inactive - Inactive Systemd units failed - Failed Systemd units deactivating - Deactivating units active - Active units activating - Activating units |
short |
--- SPLIT ---
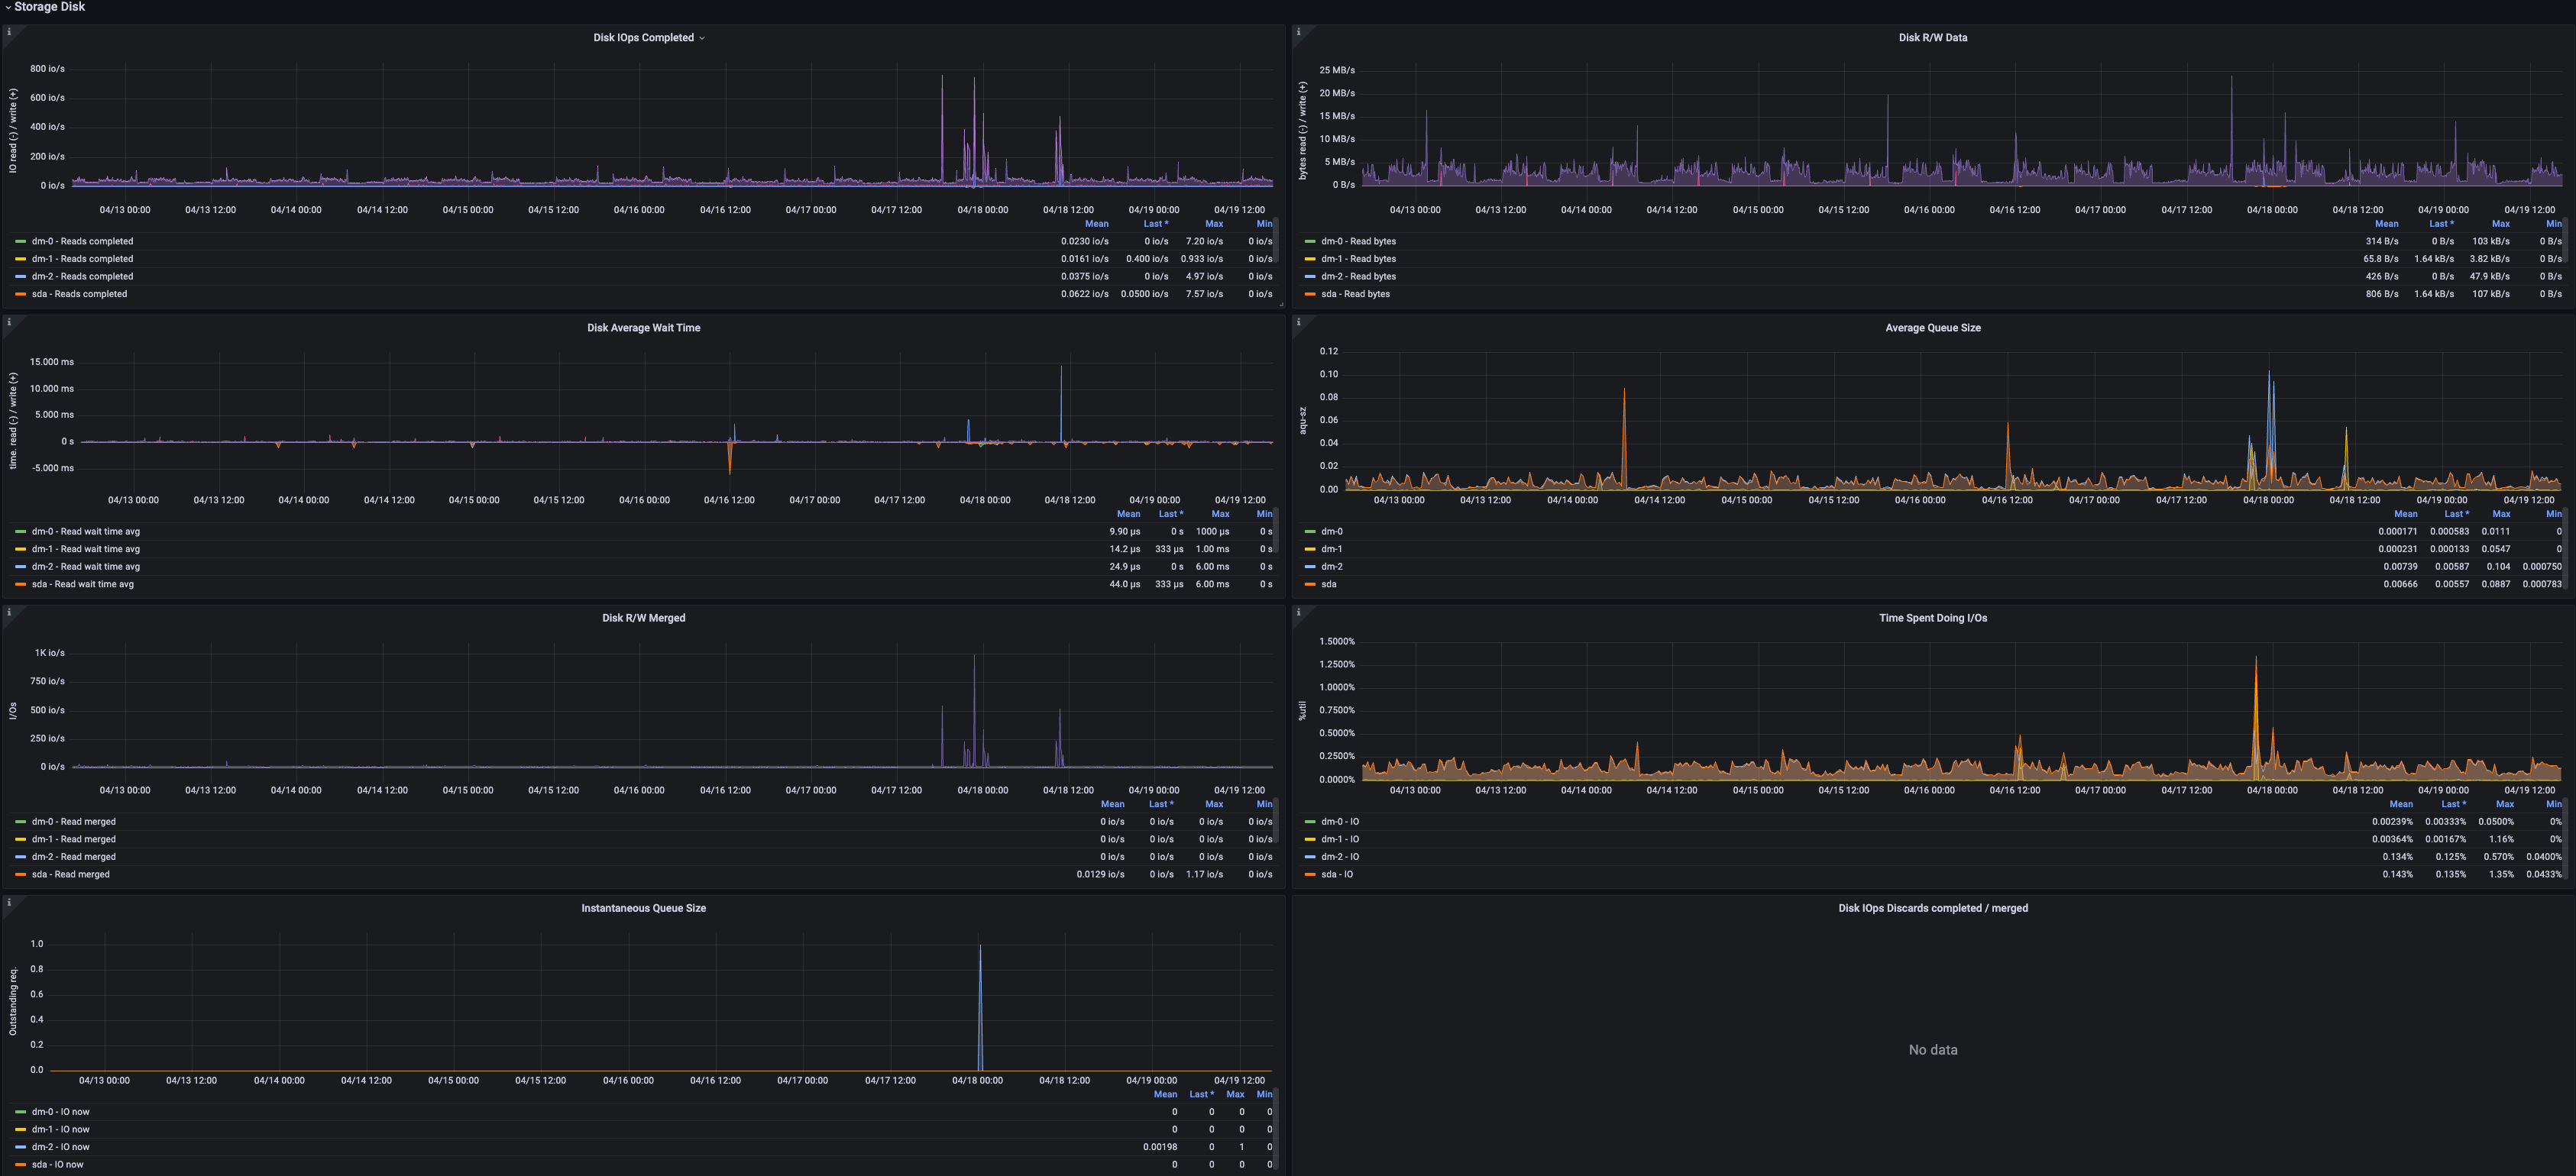
3.11 Storage Disk
| Metric Name | Description | Unit | Severity Level | Recommended Alert Threshold |
|---|---|---|---|---|
| Disk IOps Completed | Number of read completions per second on each disk partition Number of write completions per second on each disk partition |
I/O ops/sec (iops) | ||
| Disk Average Wait Time | Average wait time for reads on each disk Average wait time for writes on each disk |
Milliseconds (ms) | p3 | 1s |
| Disk R/W Merged | Number of merged read operations completed per second on each disk partition Number of merged write operations completed per second on each disk partition |
I/O ops/sec (iops) | ||
| Instantaneous Queue Size | Instantaneous queue size; number of requests pending at sample time. Increases when requests are queued to the request_queue, decreases as requests complete | short | ||
| Disk R/W Data | Number of bytes read per second from each disk partition Number of bytes written per second to each disk partition |
bytes/sec | ||
| Average Queue Size | Average queue length of requests issued to the device | short | ||
| Time Spent Doing I/Os | Percentage of elapsed time during which I/O requests were issued to the device (device bandwidth utilization). For devices that process requests serially, nearing 100% indicates saturation. For parallel devices such as RAID arrays and modern SSDs, this value does not necessarily reflect performance limits. | 0-1 | ||
| Disk IOps Discards completed / merged | Disk Discards completed IOPS Disk Discards merged IOPS |
I/O ops/sec (iops) |
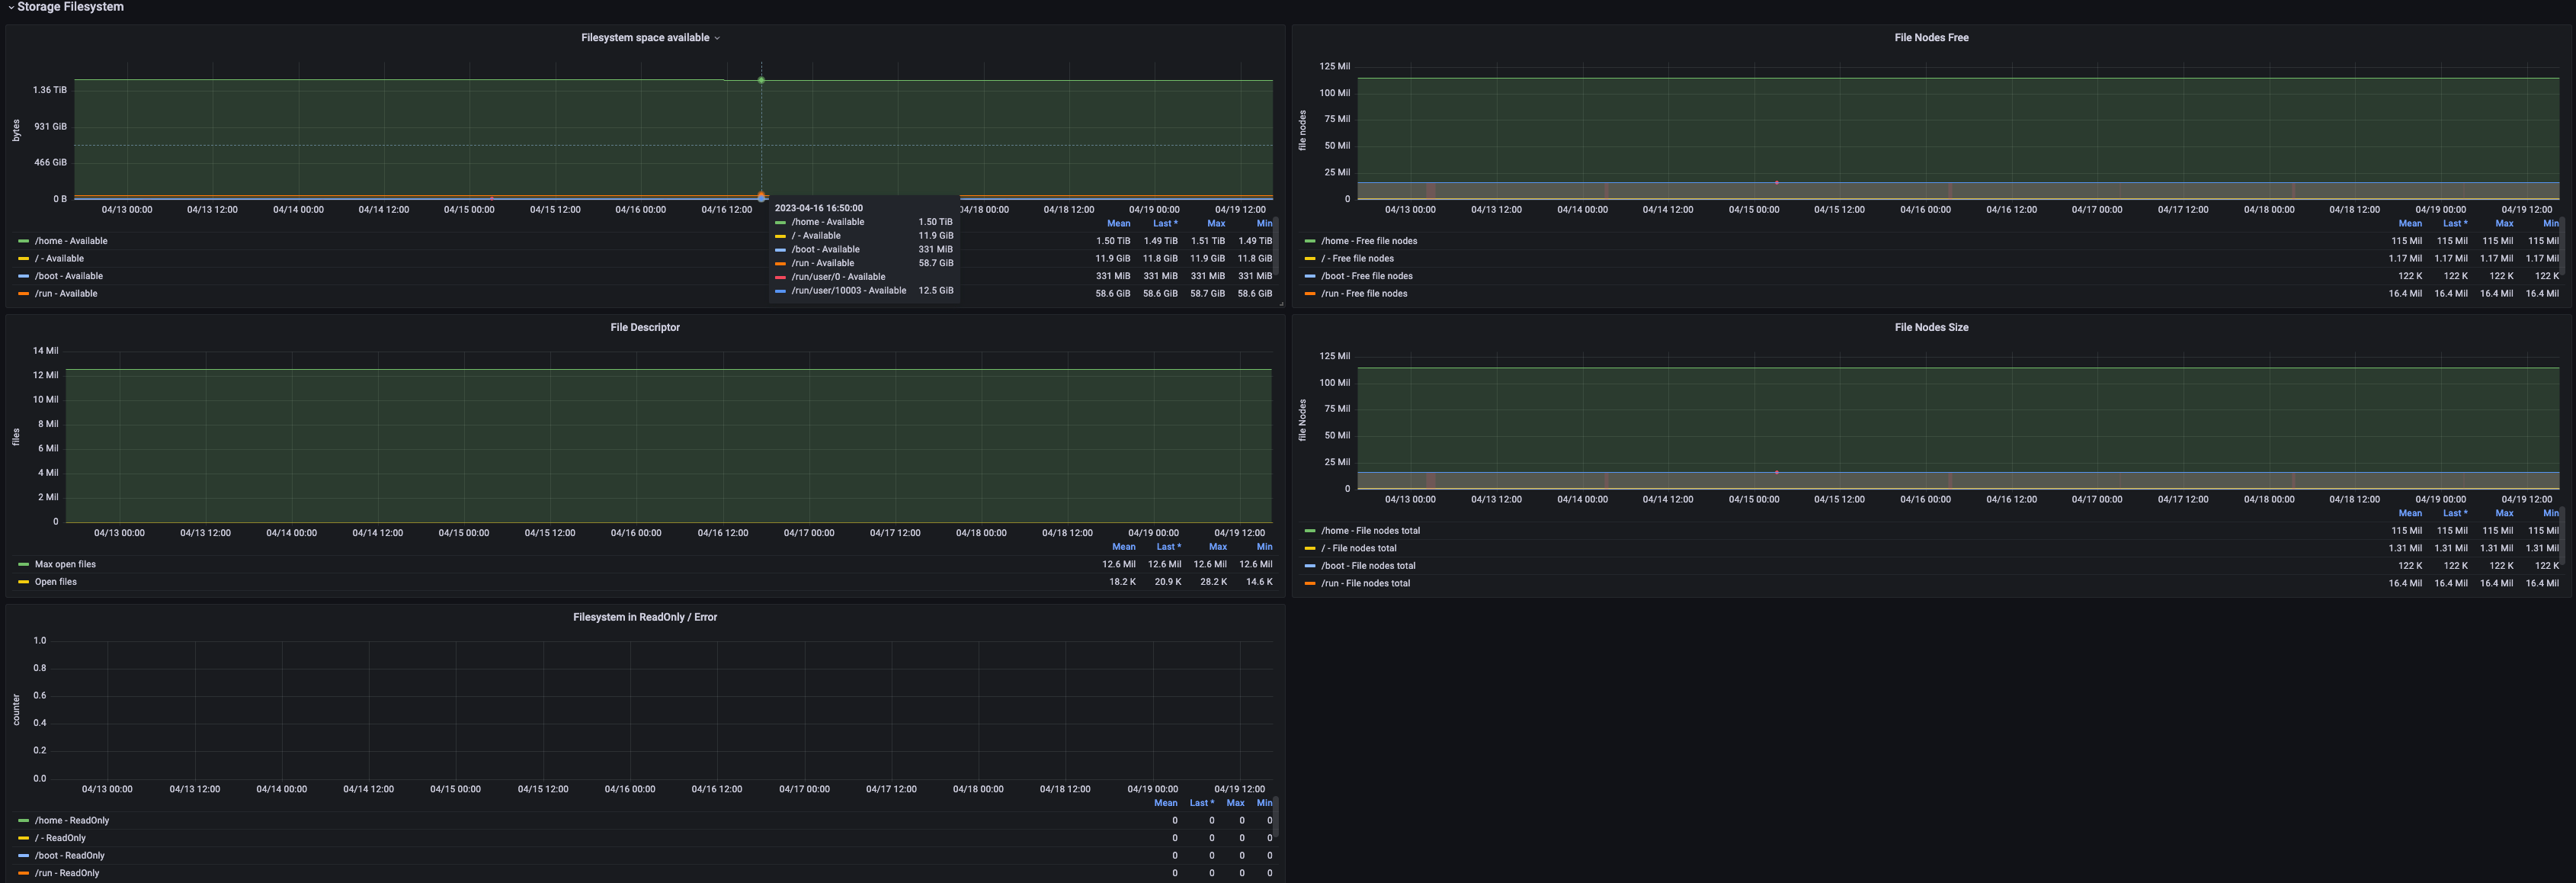
| Metric Name | Description | Unit | Severity Level | Recommended Alert Threshold |
|---|---|---|---|---|
| Filesystem space available | Available space on mounted filesystems Free space on mounted filesystems Used space on mounted filesystems |
bytes | p3/p2 | 60%/80% |
| File Descriptor | Maximum open file descriptors - Maximum number of open file descriptors Open file descriptors - Number of currently open file descriptors |
short | ||
| Filesystem in ReadOnly / Error | Filesystems mounted in read-only mode Device error count - Number of device errors |
short | p3 | |
| File Nodes Free | Free file nodes: Number of inodes remaining on mounted filesystems | short | p3 | 60% |
| FIle Nodes Size | File nodes total: Total number of inodes on mounted filesystems | short |
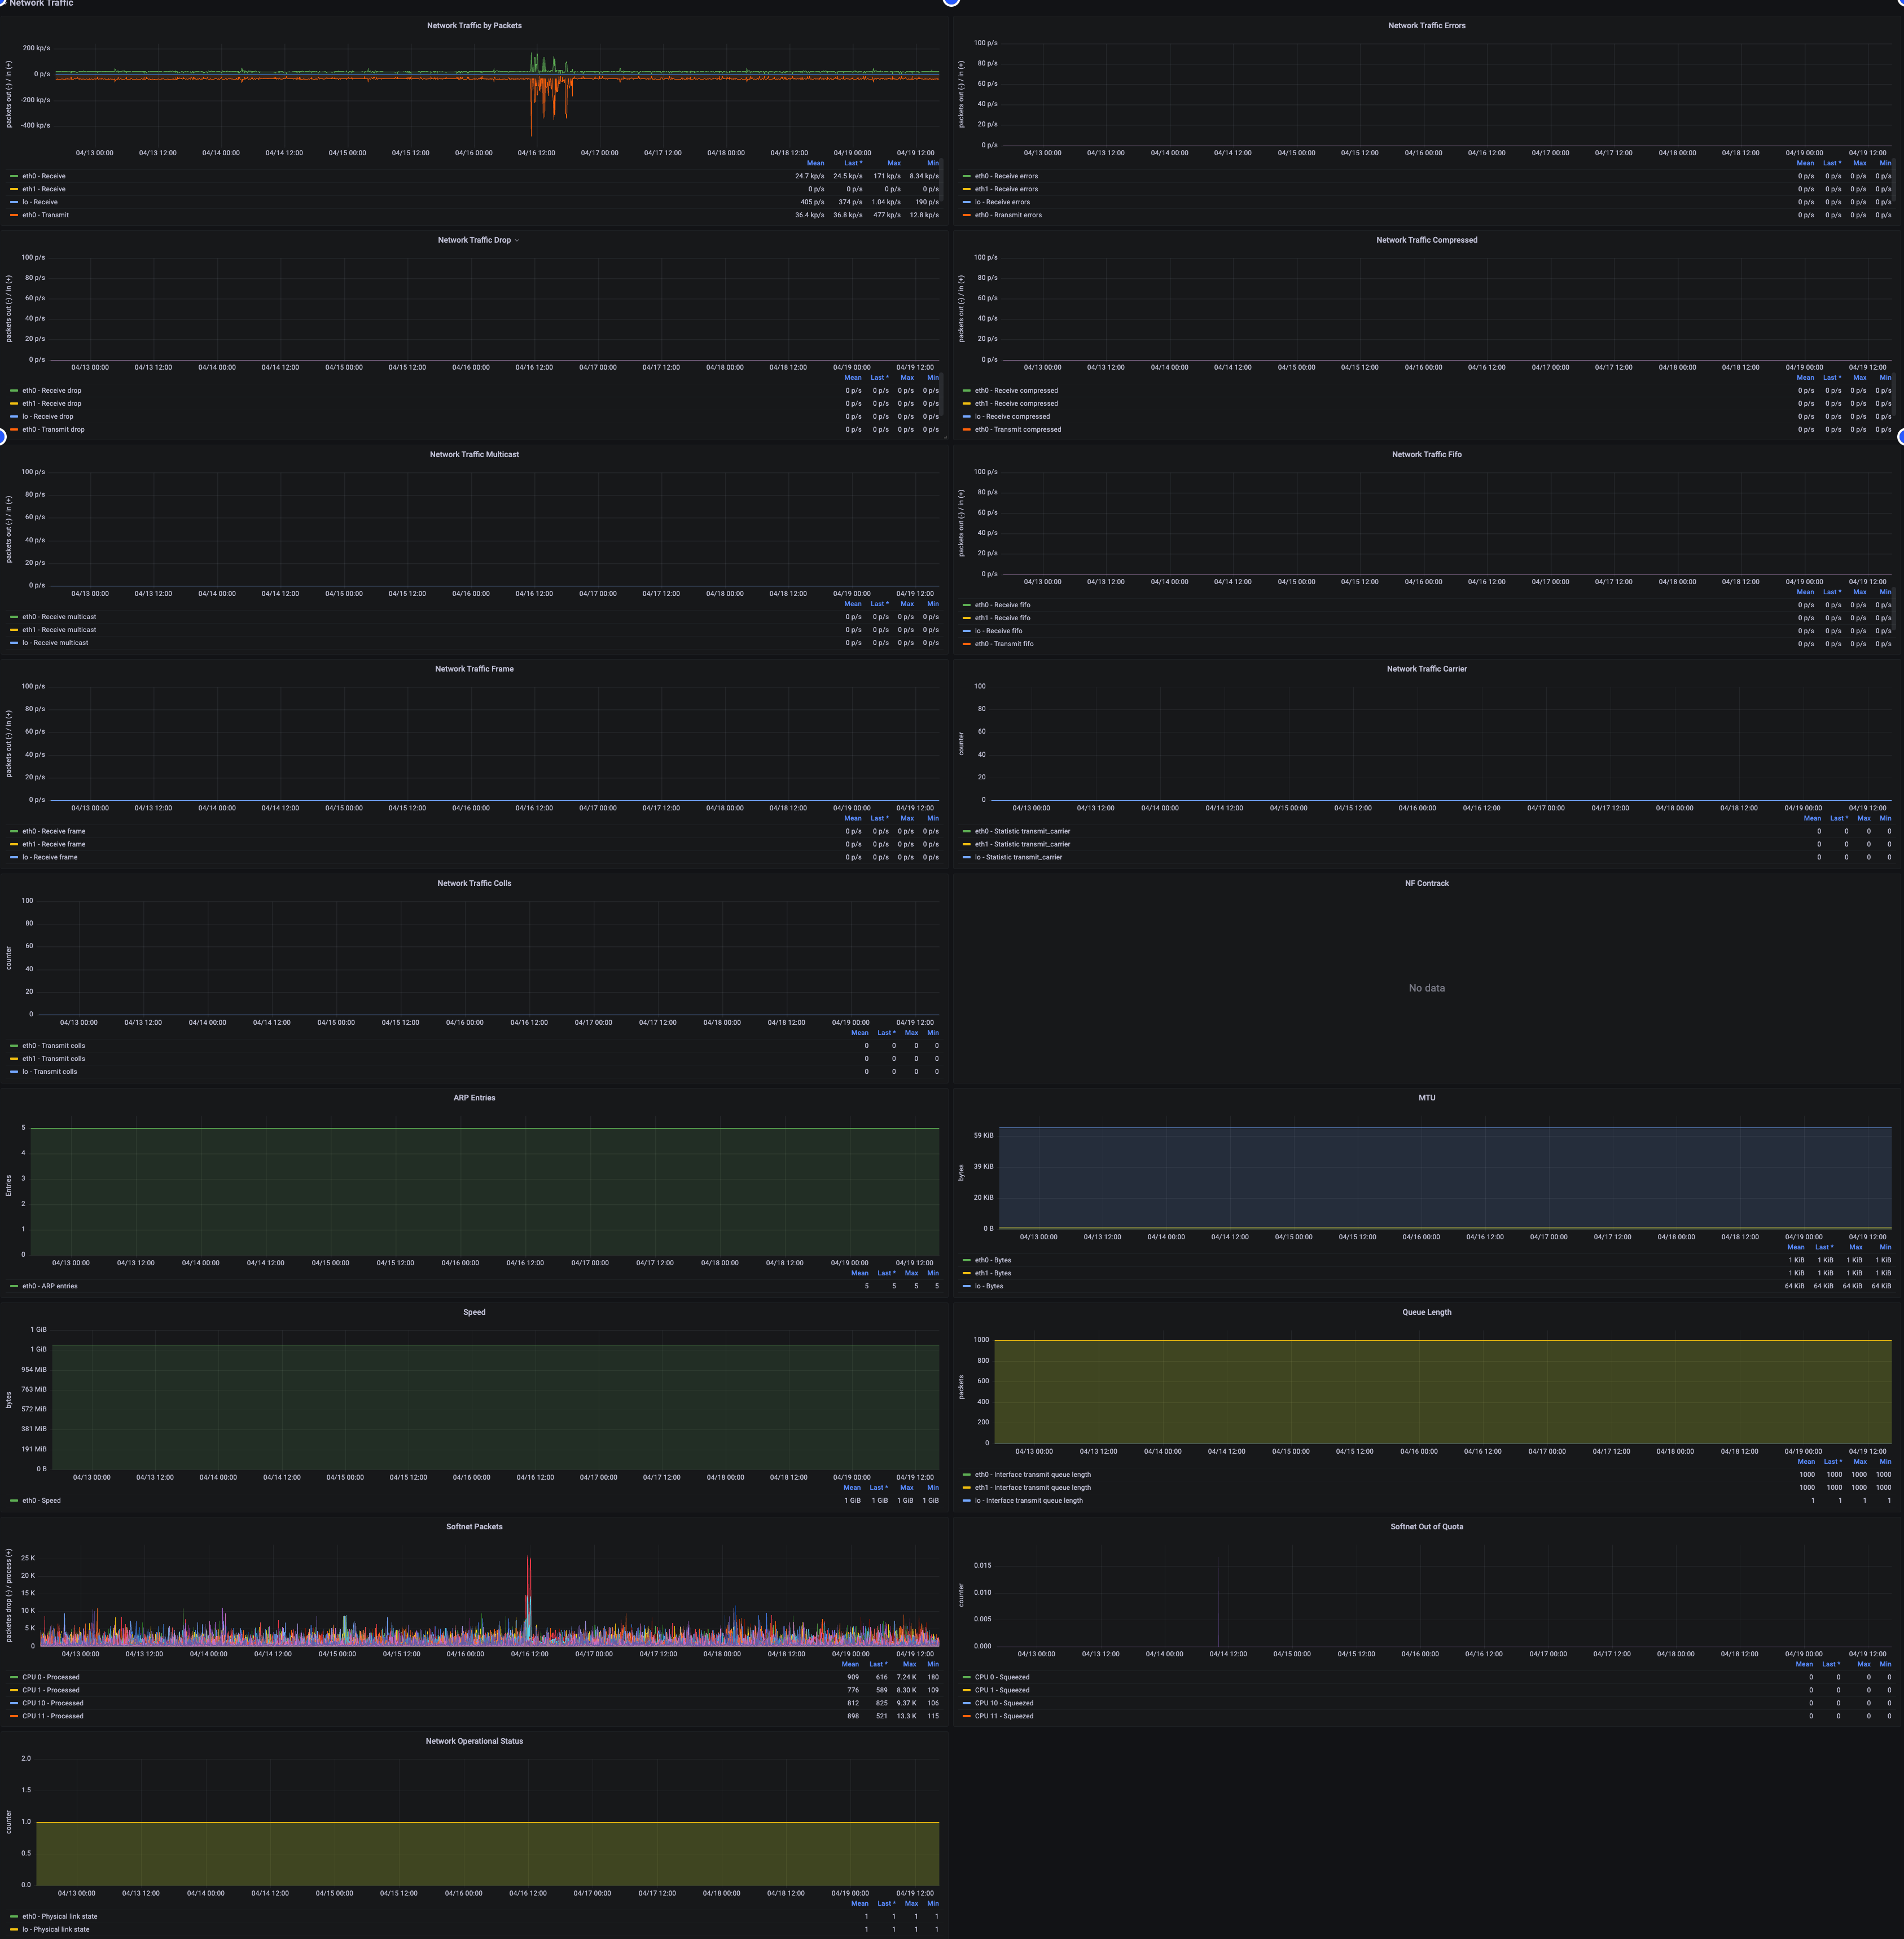
| Metric Name | Description | Unit | Severity Level | Recommended Alert Threshold |
|---|---|---|---|---|
| Network traffic by Packets | Receive - Total packets received per second across all interfaces Transmit - Total packets transmitted per second across all interfaces |
packets/sec | ||
| Network Traffic Drop | Receive drop - Total dropped received packets per second per interface Transmit drop - Total dropped transmitted packets per second per interface |
packets/sec | p3 | 100 |
| Network Traffic Multicast | Receive multicast - Multicast packets received per second on each interface | packets/sec | ||
| Network Traffic Frame | Receive frame - Frames received per second on each interface | packets/sec | ||
| Network Traffic Colls | Transmit colls - Number of collisions detected on each interface | short | ||
| ARP Entries | ARP entries - Count of entries in the ARP table per interface | short | ||
| Speed | Speed - Maximum bandwidth of the network interface | bytes | ||
| Softnet Packets | Processed - Number of packets processed per CPU Dropped - Number of packets dropped per CPU |
|||
| Network Operational Status | Physical link state - Physical connectivity status of each NIC | short | ||
| Network Traffic Errors | Receive errors - Total erroneous packets received per second on each interface Transmit errors - Total erroneous packets transmitted per second on each interface |
packets/sec | p3 | 100 |
| Network Traffic Compressed | Receive compressed - Compressed packets received per second on each interface Transmit compressed - Compressed packets transmitted per second on each interface |
packets/sec | ||
| Network traffic Fifo | Receive fifo - FIFO packets received per second on each interface Transmit fifo - FIFO packets transmitted per second on each interface |
packets/sec | ||
| Network Traffic Carrier | Statistic transmit_carrier - Number of carrier losses detected by each interface | short | ||
| NF Contrack | NF conntrack entries - Number of tracked connections NF conntrack limit - Maximum allowed tracked connections |
short | ||
| MTU | Maximum size of packets that can be received on each interface | bytes | ||
| Queue Length | Length of the transmission queue for each interface | short | ||
| Softnet Out of Quota | Backlog status per CPU | 0-1 |

| Metric Name | Description | Unit | Severity Level | Recommended Alert Threshold |
|---|---|---|---|---|
| Sockstat TCP | TCP_alloc - Number of allocated TCP sockets (established, sk_buff assigned) TCP_inuse - Number of TCP sockets currently in use (listening) TCP_mem - TCP socket buffer usage TCP_orphan - Number of orphaned (not associated with any process) TCP connections (useless, pending destruction) TCP_tw - Number of TCP connections waiting to close |
short | ||
| Sockstats FRG / RAW | FRAG_inuse - Number of Frag sockets in use FRAG_memory - Frag buffer usage RAW_inuse - Number of Raw sockets in use |
short | ||
| Sockstat Used | Sockets_used - Total number of sockets used across all protocols | short | ||
| Sockstat UDP | UDPLITE_inuse - Number of UDP-Lite sockets in use | short | ||
| Sockstat Memory Size | TCP_mem_bytes - TCP socket buffer size in bytes UDP_mem_bytes - UDP socket buffer size in bytes |
bytes |
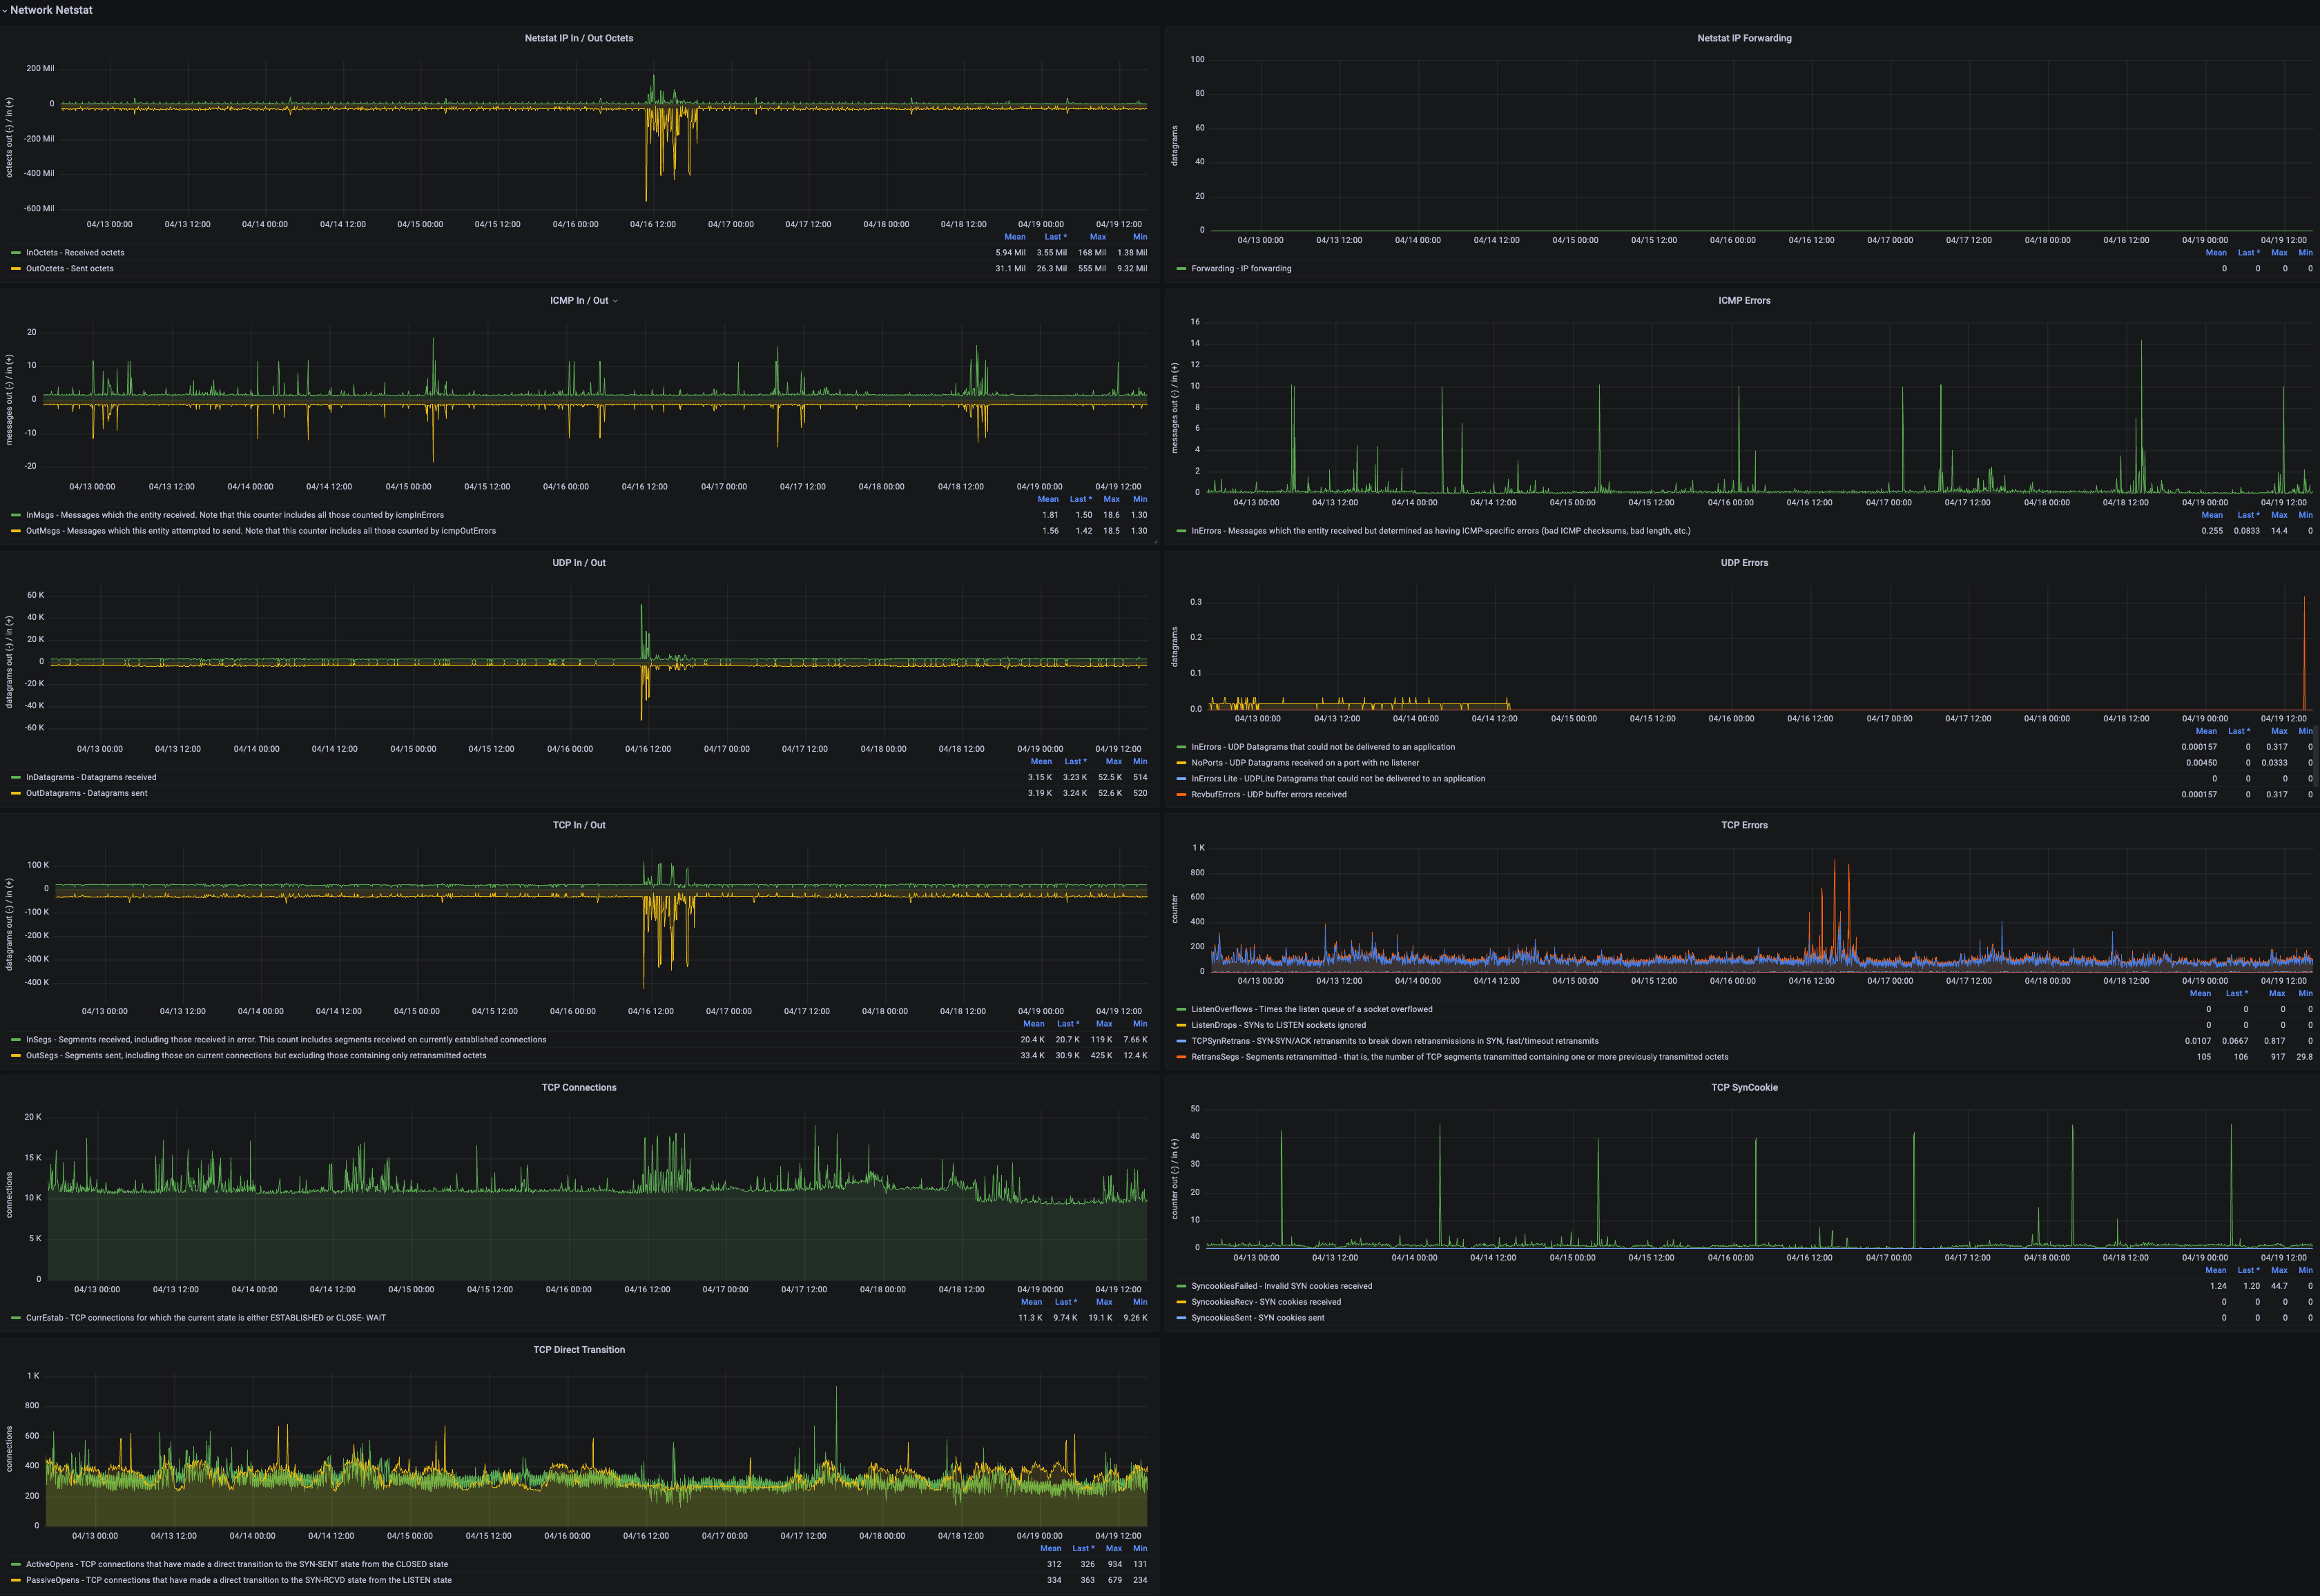
| Metric Name | Description | Unit | Severity Level | Recommended Alert Threshold |
|---|---|---|---|---|
| Netstat IP In / Out Octets | InOctets - Number of octets received OutOctets - Number of octets transmitted |
short | ||
| ICMP In / Out | InMsgs - Number of ICMP messages received (includes icmpInErrors) OutMsgs - Number of ICMP messages attempted to send (includes icmpOutErrors) |
short | ||
| UDP In / Out | InDatagrams - Average UDP datagrams received (over 5 minutes) OutDatagrams - Average UDP datagrams sent (over 5 minutes) |
short | ||
| TCP In / Out | InSegs - Segments received, including erroneous ones. Includes segments received on currently established connections OutSegs - Segments sent, including those on current connections, excluding segments containing only retransmitted octets |
short | ||
| TCP Connections | CurrEstab - Number of TCP connections in ESTABLISHED or CLOSE-WAIT state | short | ||
| TCP Direct Transition | ActiveOpens - Number of TCP connections transitioning directly from CLOSED to SYN-SENT PassiveOpens - Number of TCP connections transitioning directly from LISTEN to SYN-RCVD |
short | ||
| Netstat IP Forwarding | Forwarding - Number of IP packets forwarded | short | ||
| ICMP Errors | InErrors - ICMP messages received with ICMP-specific errors (e.g., invalid checksum, incorrect length) | short | ||
| UDP Errors | InCsumErrors - Average number of UDP packets with checksum errors (over 5 minutes) InErrors - Average number of incoming UDP packets undeliverable for reasons other than missing listener (over 5 minutes) RcvbufErrors - Average number of UDP packets dropped due to receive buffer overflow (over 5 minutes) SndbufErrors - Average number of UDP packets dropped due to send buffer overflow (over 5 minutes) NoPorts - Average number of UDP packets received on unknown ports (over 5 minutes) |
short | p3 | 100 |
| TCP Errors | ListenOverflows - Number of times the listen queue of a socket overflowed ListenDrops - Number of SYNs ignored on LISTEN sockets TCPSynRetrans - Retransmissions of SYN or SYN/ACK to break connection establishment, including fast and timeout retransmissions RetransSegs - Number of retransmitted segments (segments containing one or more previously transmitted octets) InErrs - Segments received with errors (e.g., incorrect TCP checksum) OutRsts - Segments sent with the RST flag |
short | p3 | 100 |
| TCP SyncCookie | SyncookiesFailed - Number of invalid SYN cookies received SyncookiesRecv - Number of SYN cookies received SyncookiesSent - Number of SYN cookies sent |
short |
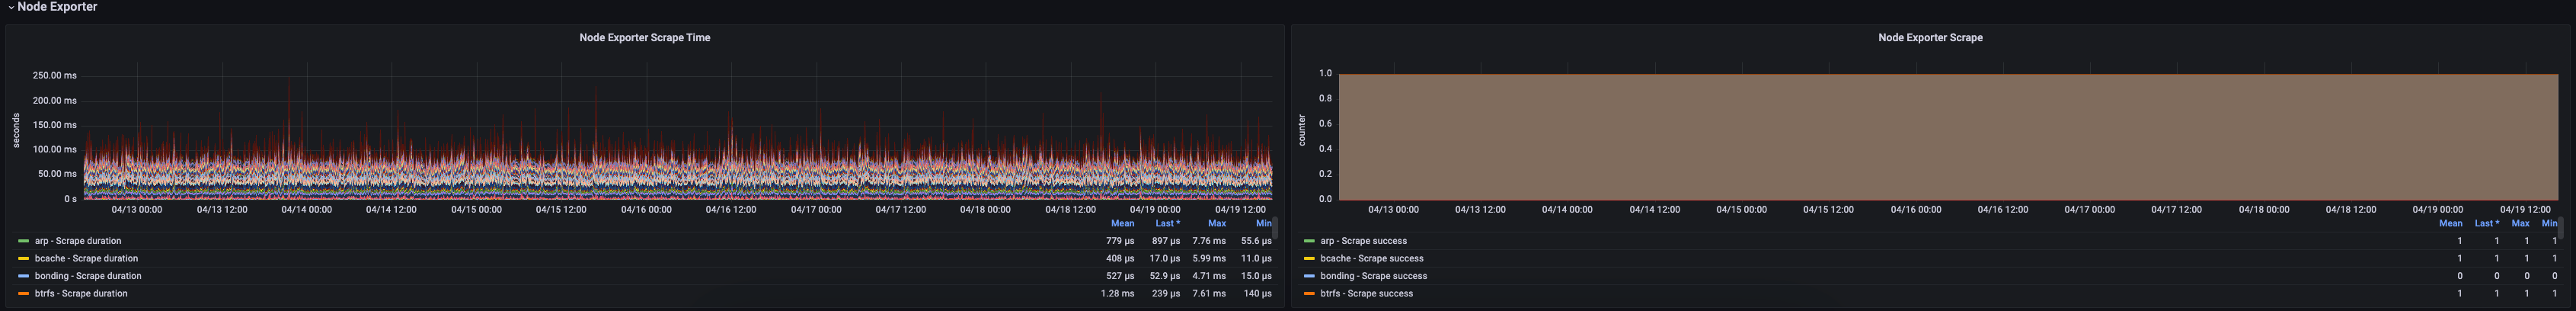
| Metric Name | Description | Unit | Severity Level | Recommended Alert Threshold |
|---|---|---|---|---|
| Node Exporter Scrape Time | Duration of each collector scrape | seconds | ||
| Node Exporter Scrape | Number of collectors functioning normally | short |
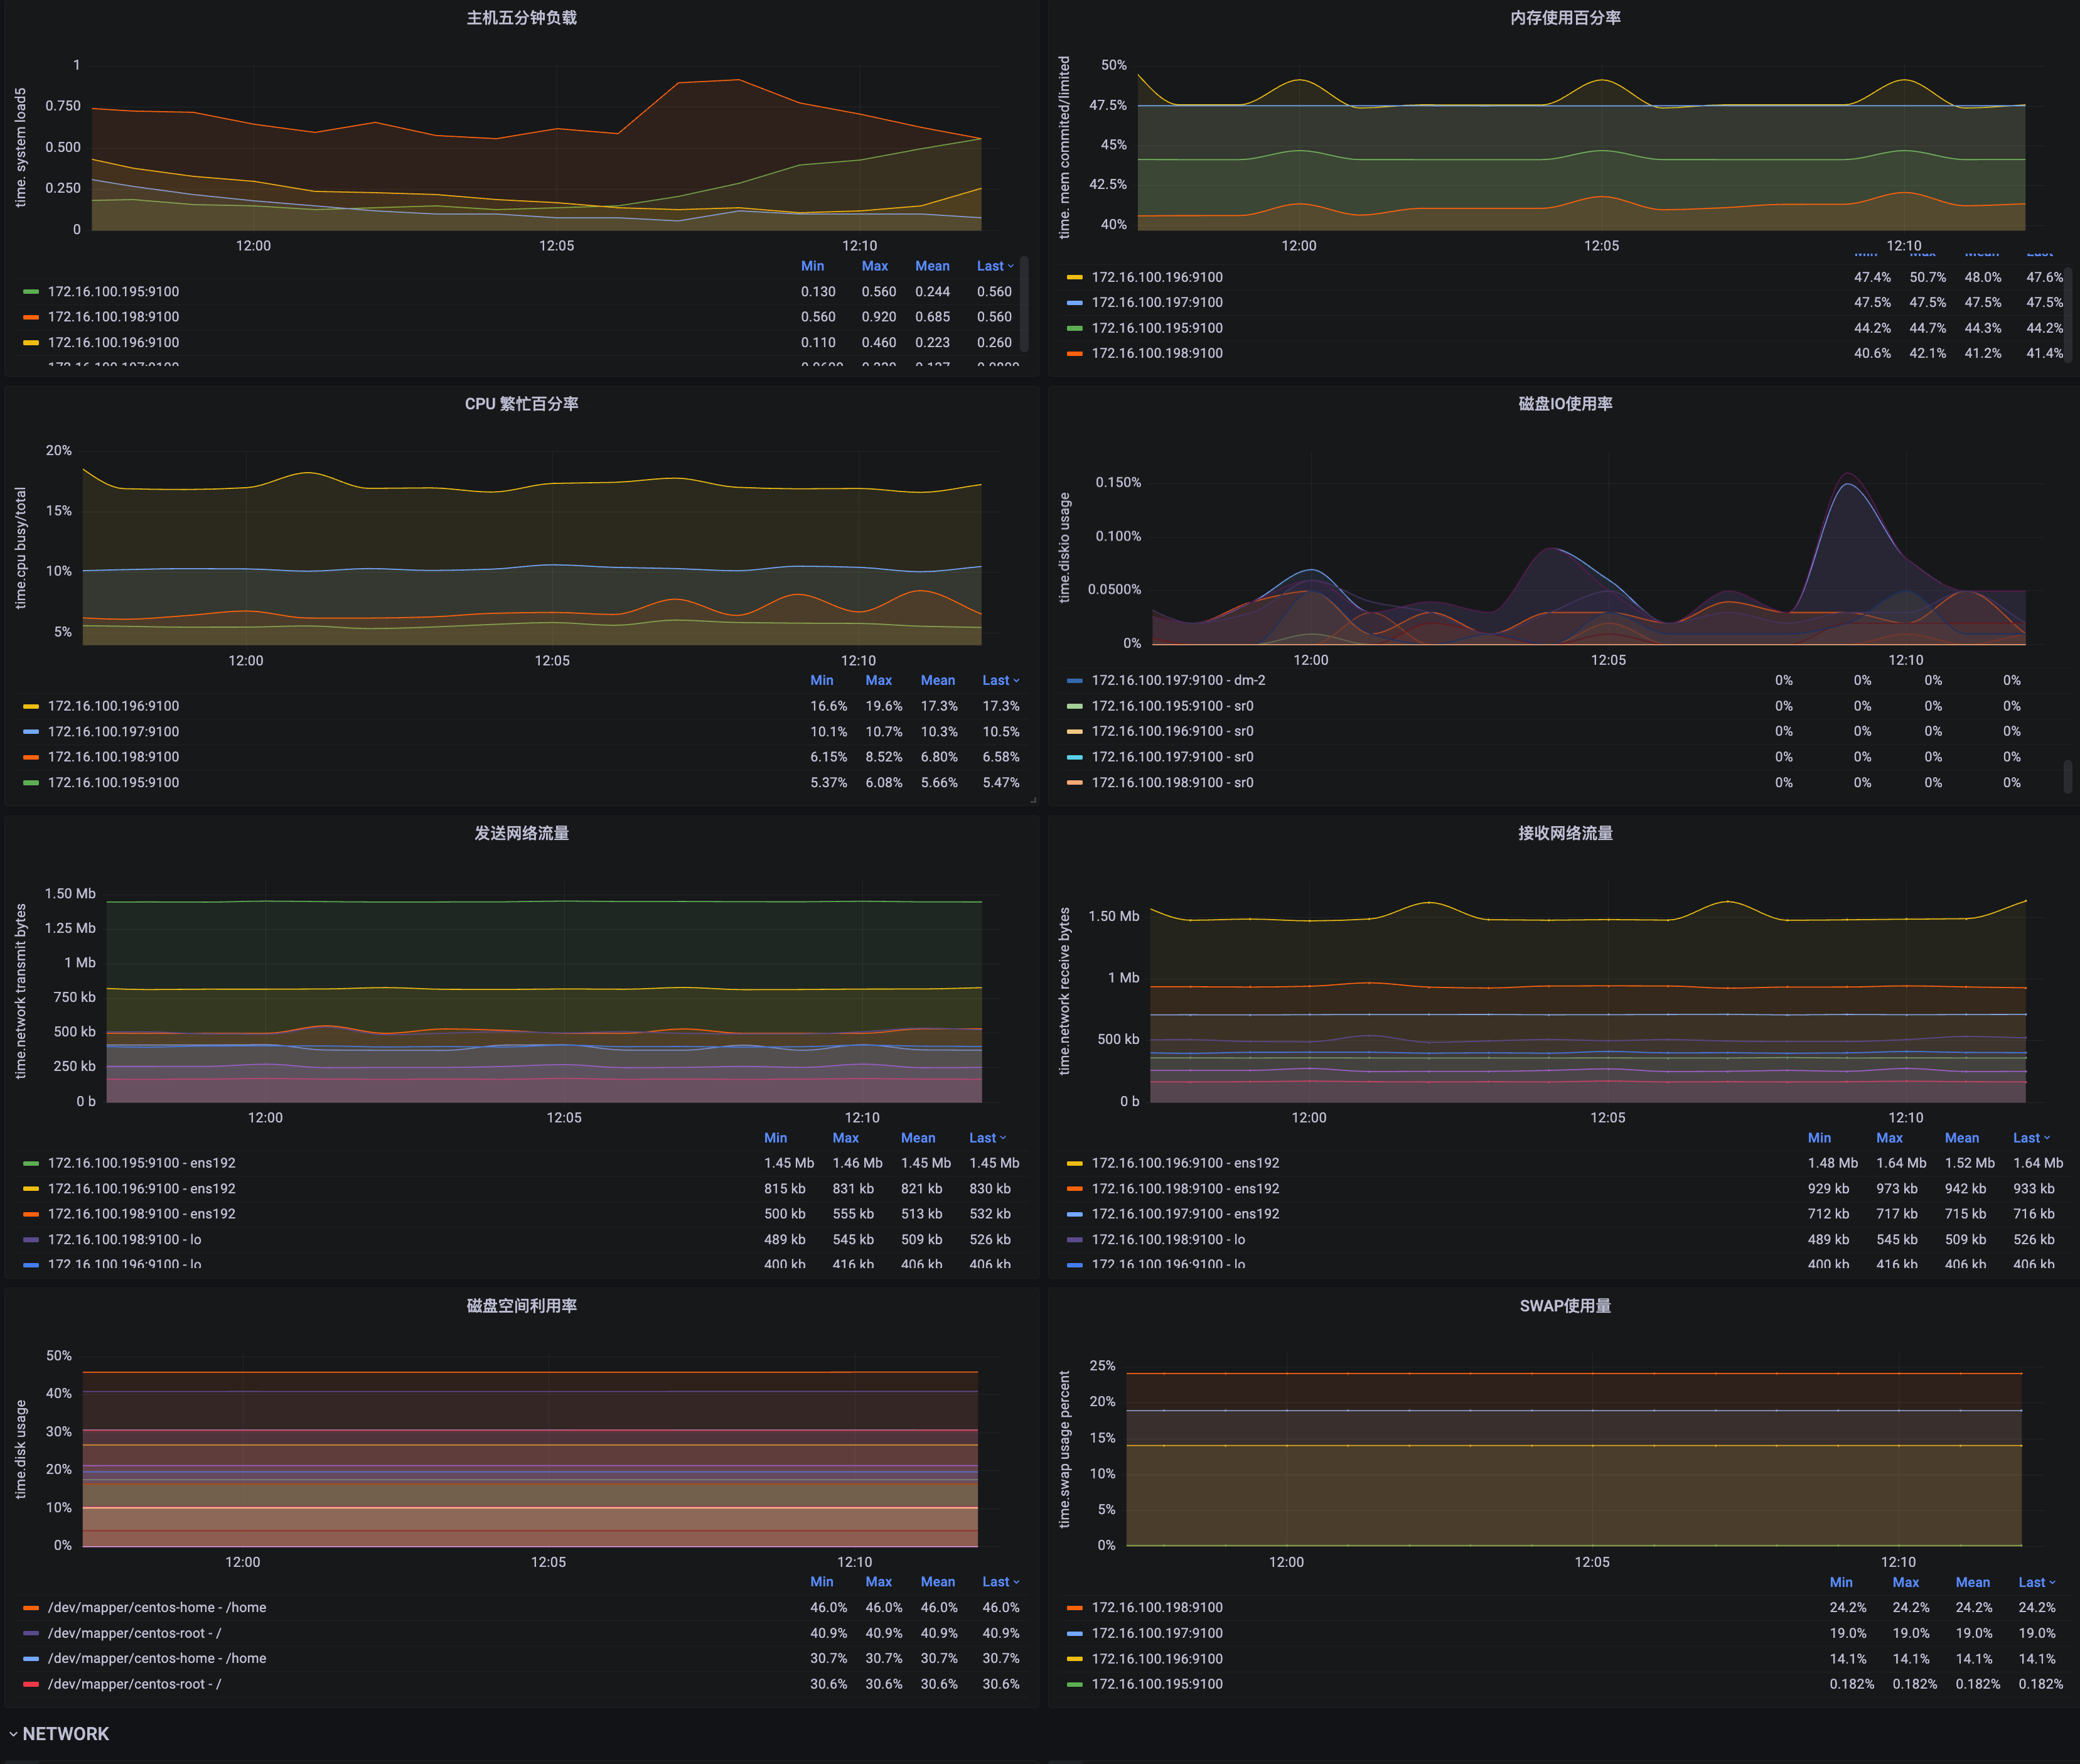
| Metric Name | Description | Unit | Severity Level | Recommended Alert Threshold |
|---|---|---|---|---|
| Host 5-minute Load | 5-minute load average across selected hosts | short | ||
| Host Memory Usage Ratio | Memory usage percentage across selected hosts | 0-1 | ||
| CPU Busy Percentage | CPU utilization percentage | 0-1 | ||
| Disk I/O Utilization | Disk I/O usage rate | 0-1 | ||
| Free Space Utilization | Free disk space utilization on selected hosts | 0-1 | ||
| Network Traffic Sent | Network traffic transmitted by selected hosts | bit | ||
| Network Traffic Received | Network traffic received by selected hosts | bit | ||
| SWAP Usage | SWAP usage on selected hosts | 0-1 |

| Metric Name | Description | Unit | Severity Level | Recommended Alert Threshold |
|---|---|---|---|---|
| net dev | Network device status | short | ||
| softnet_stat | Memory usage percentage across selected hosts | short | ||
| hardirq_cpu | Number of CPU hardware interrupts | short | ||
| hardirq_cpu_pie | Pie chart of CPU hardware interrupts | short | ||
| hardirq_quene | Number of hardware interrupts per device | short | ||
| hardirq_quene_pie | Pie chart of hardware interrupts per device | short | ||
| softirq_rx | Number of software interrupts for data reception | short | ||
| softirq_rx_pie | Pie chart of software interrupts for data reception | short | ||
| softirq_tx | Number of software interrupts for data transmission | short | ||
| softirq_tx_pie | Pie chart of software interrupts for data transmission | short | ||
| ip | Packet receive/transmit statistics at IP layer | short | ||
| udp | Packet receive/transmit statistics for UDP protocol | short |
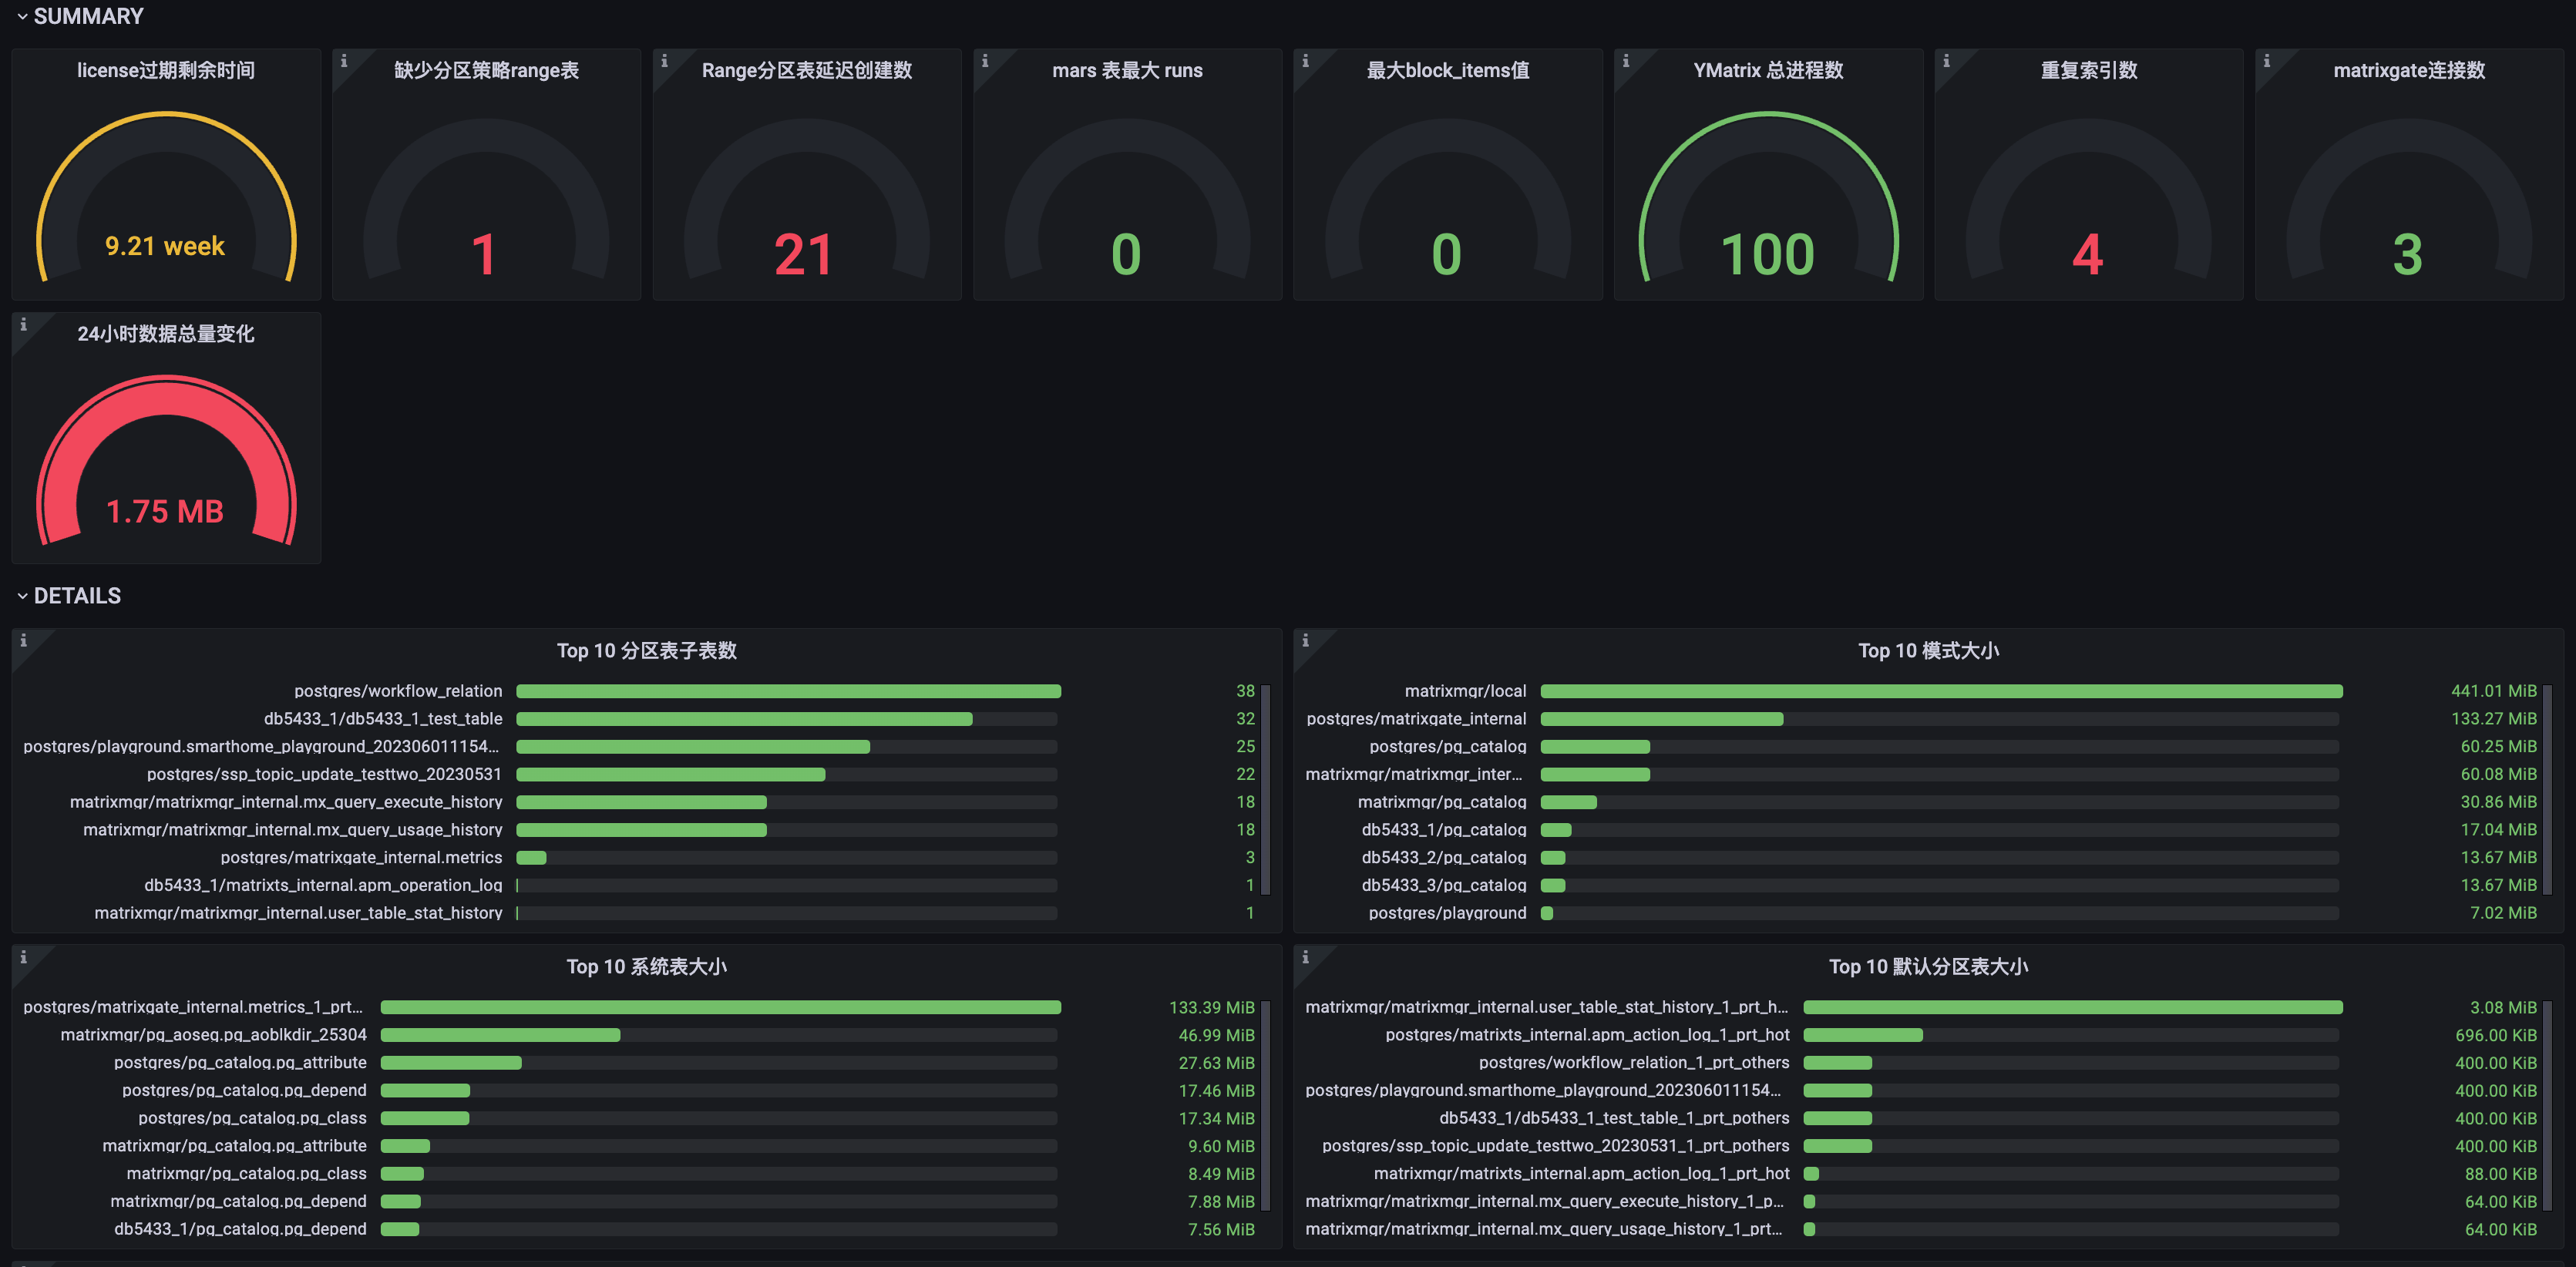
| Metric Name | Description | Unit | Severity Level | Recommended Alert Threshold |
|---|---|---|---|---|
| license expiration time | Remaining time until LICENSE expires | seconds (s) | p3/p2 | Alert p3 if less than 15 days remaining Alert p2 if less than 7 days remaining; contact YMatrix promptly to renew LICENSE |
| Missing partition strategy for range tables | Range partitioned tables missing APM partition strategy configuration | short | p2 | Must be addressed promptly; otherwise data will be written to default partition, affecting performance |
| Range partition table creation count | Number of delayed new partitions in range partitioned tables | short | p2 | Must be addressed promptly; otherwise data will be written to default partition, affecting performance |
| mars table max runs | Internal metric for MARS2 | short | p3/p2 | Alert p3 if exceeds 1500; monitor trend Alert p2 if exceeds 1800 Write performance degrades significantly or becomes impossible when value reaches 2039 |
| Max block_items value | Instantaneous batch write count by mxgate | short | ||
| YMatrix Total Process Count | Total number of postgres-related processes on selected hosts | short | p2 | Prevent excessive process count which may lead to memory exhaustion; configure as needed |
| Duplicate Index Count | Number of duplicate indexes; consider removing unnecessary ones | short | p3 | |
| matrixgate Connection Count | Total number of connections to mxgate processes | short | ||
| 24-Hour Data Volume Change | Total data change over the last 24 hours | bytes | ||
| Top10 Subpartition Count | Top 10 tables with highest number of subpartitions. Configure as needed to avoid excessive subtables, which may impact query performance and consume more memory | bytes | ||
| Top10 Schema Size | Top 10 schemas by total size | bytes | ||
| Top10 System Table Size | Top 10 system tables by total size | bytes | ||
| Top10 Default Partition Table Size | Top 10 default partition tables by size | bytes | p3 | Alert if default partition is too large; normally, default partitions should not contain data |
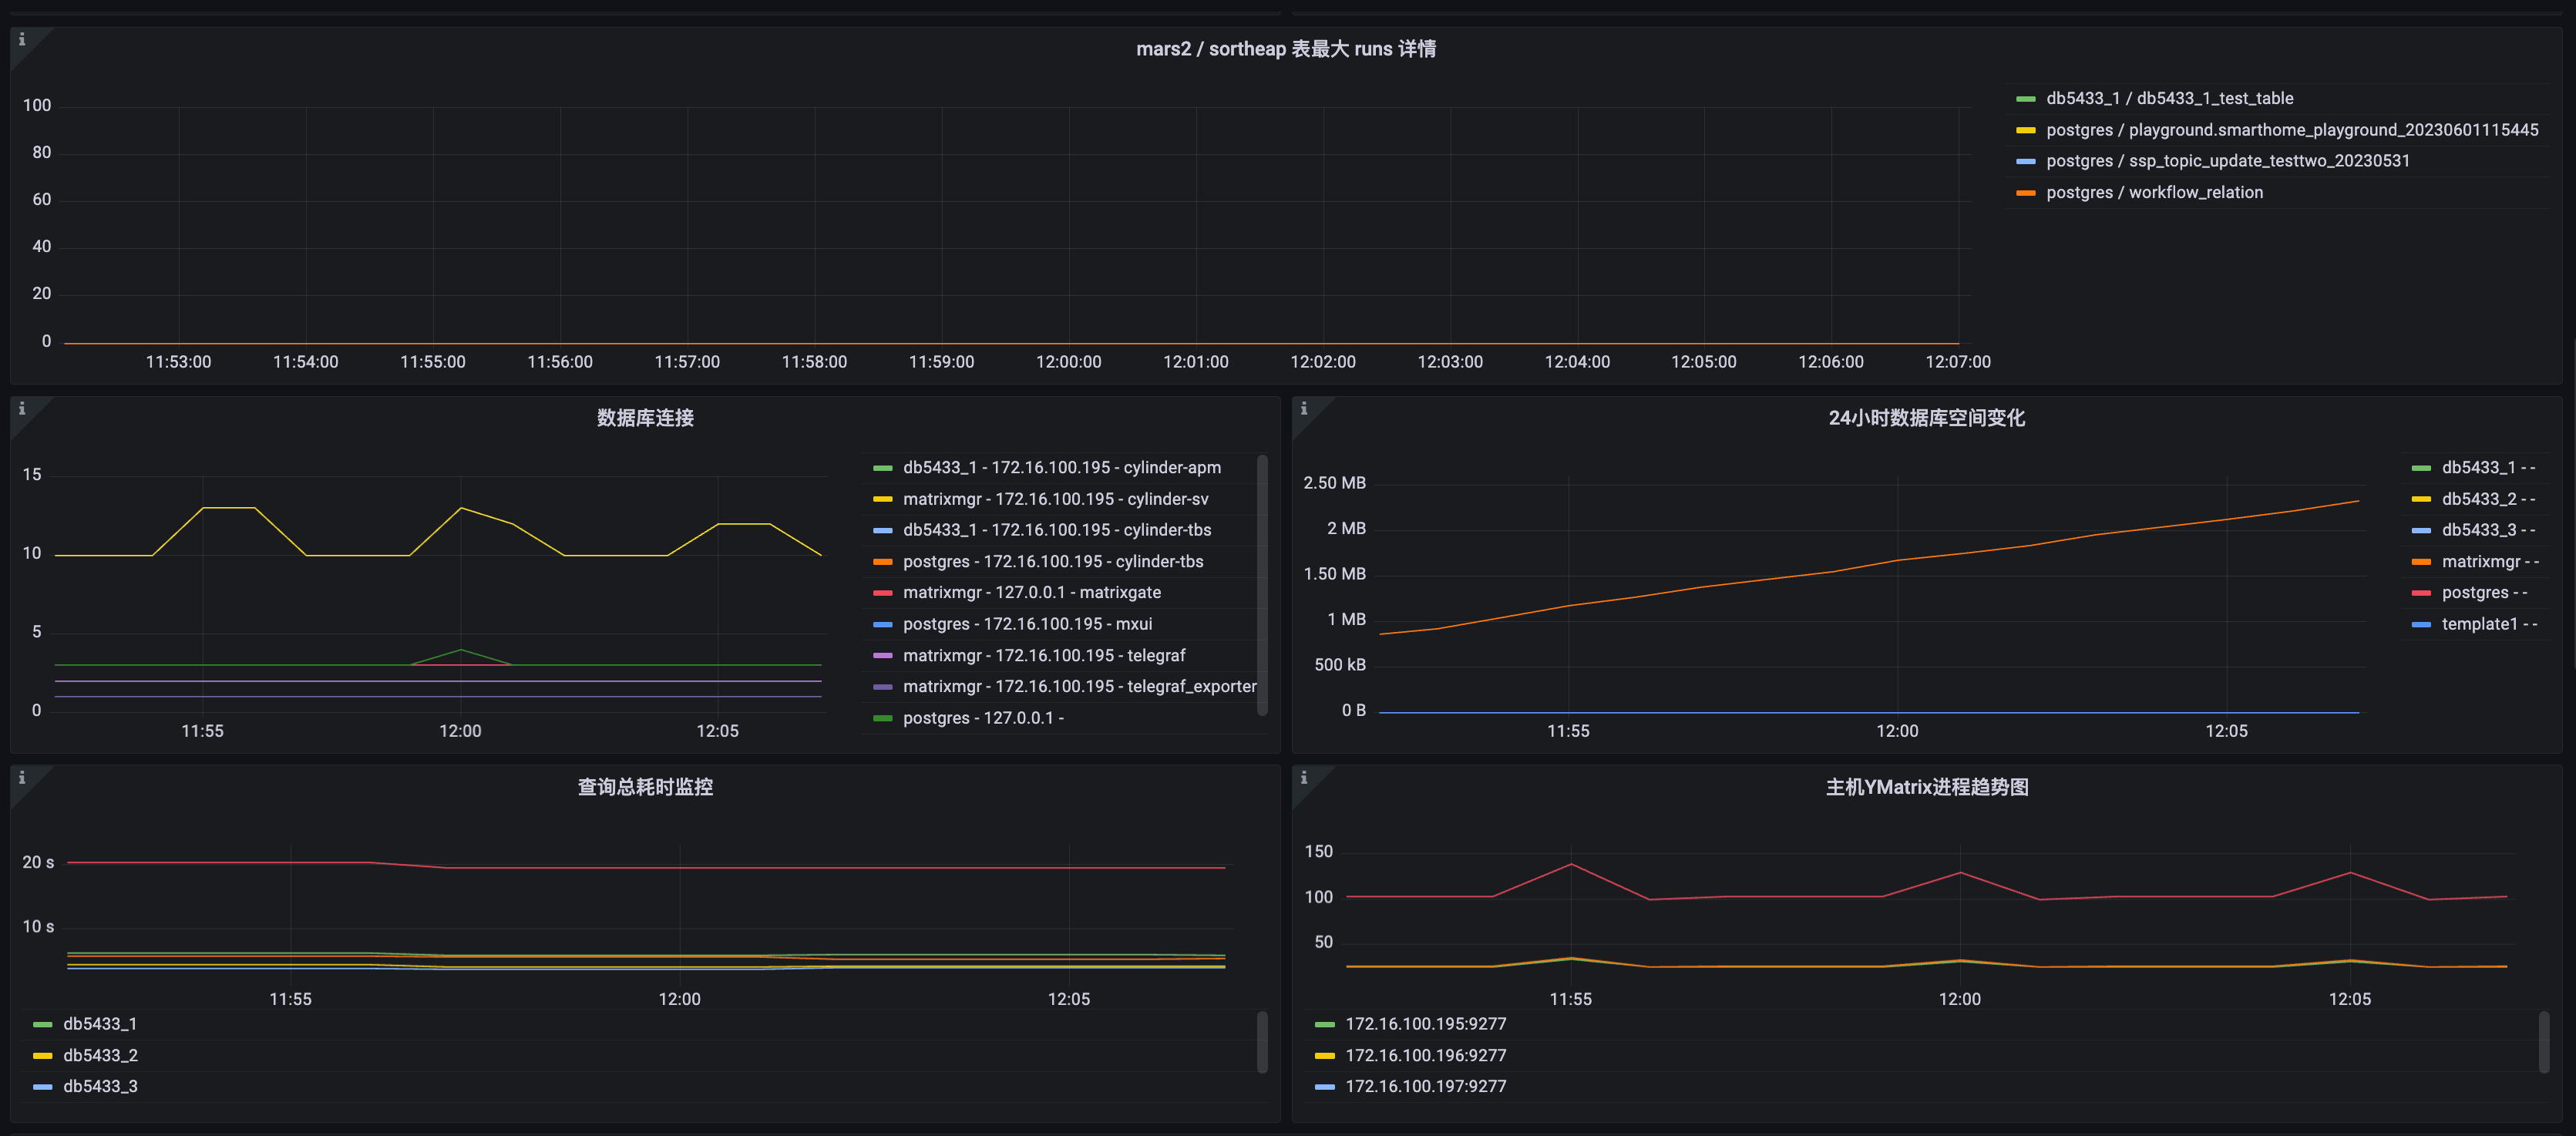
| Metric Name | Description | Unit | Severity Level | Recommended Alert Threshold |
|---|---|---|---|---|
| mars2 table max runs details | Trend chart of runs for MARS2 tables | short | ||
| Database Connection Details | Grouped by database, client address, and application_name | short | ||
| 24-Hour Database Space Change | Database size change over 24 hours for each database | short | ||
| Total Query Duration Query | Total query execution time across database stages | milliseconds (ms) | p3 | Configure as needed; investigate if total time changes significantly |
| Host YMatrix Process Trend | Trend of total postgres process count per host | short |
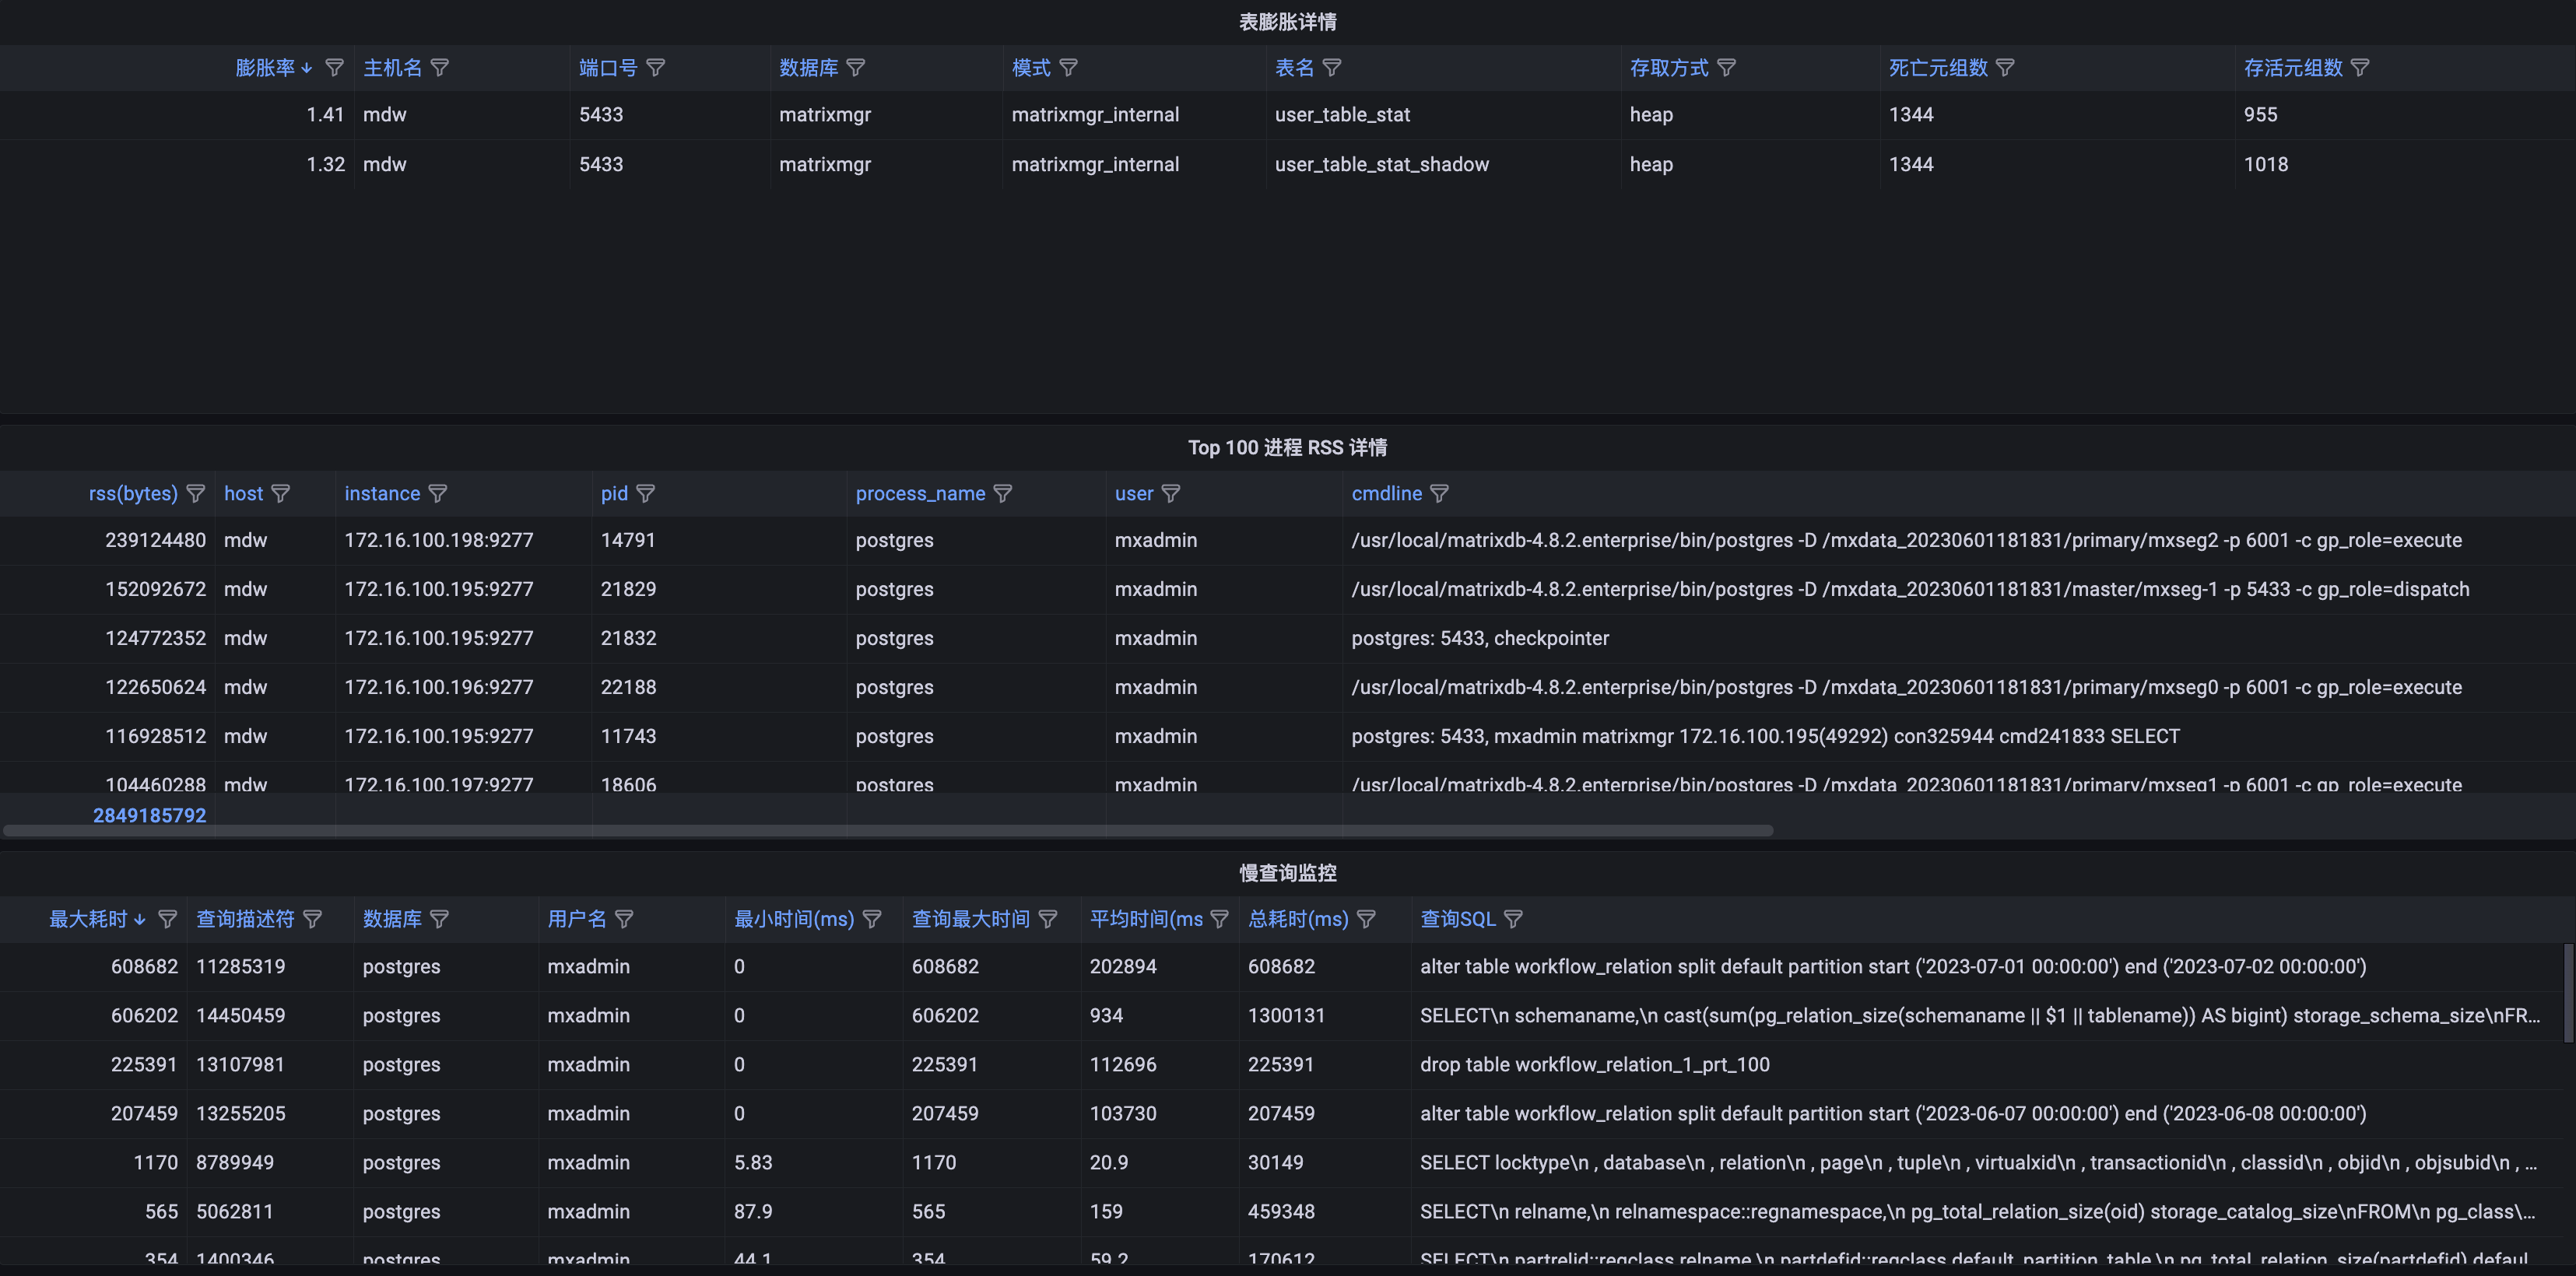
| Metric Name | Description | Unit | Severity Level | Recommended Alert Threshold |
|---|---|---|---|---|
| Table Bloat Details | Lists tables where dead tuples / live tuples > 1.1 | short | ||
| Top 100 Process RSS Details | Top 100 postgres processes sorted by RSS (memory usage) | short | ||
| Slow Query Monitoring | Statistics on slow SQL queries executed in the database | none | p3 | |
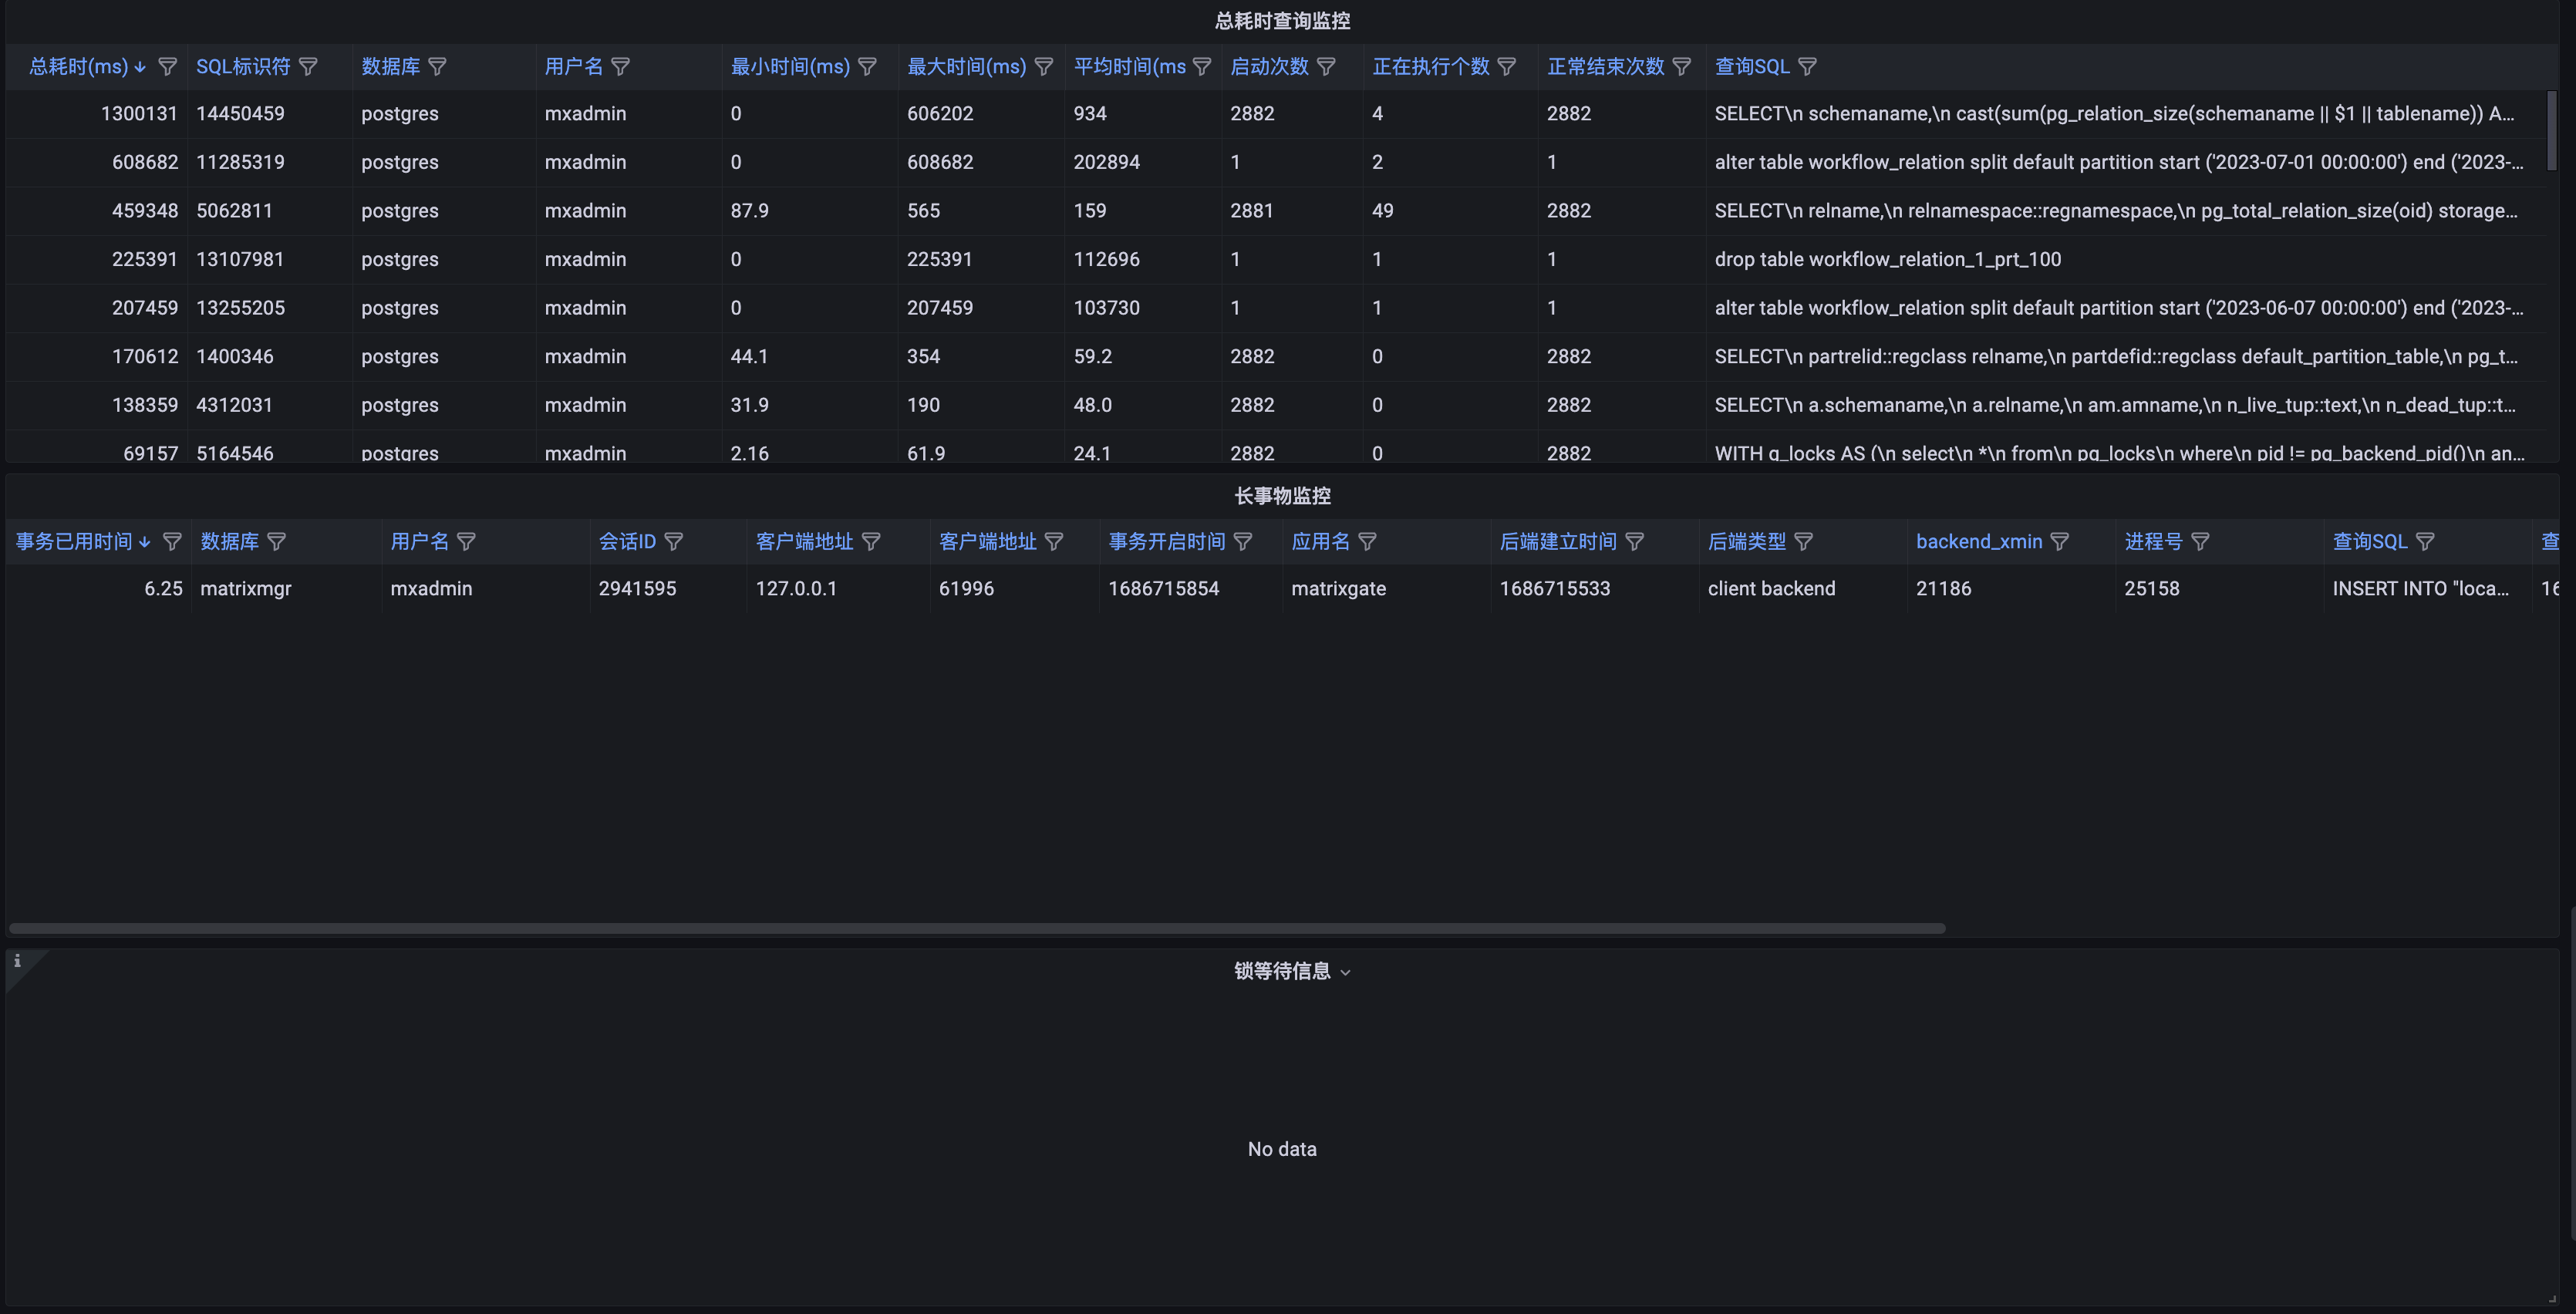
| Total Duration Query Monitoring | Statistics on total SQL execution time | milliseconds (ms) | ||
| Duration Statistics Chart (seconds) | Total SQL execution time aggregated every 5 minutes | milliseconds (ms) | ||
| Long Transaction Metrics | Details of long-running transactions on Master/Segment | none | p3 | |
| Lock Wait Information | Details of database lock waits at data collection time | none | p3 | Configure as needed; consider alerting for locks lasting over 10 minutes |