Grafana's Alert function is based on configuration monitoring to detect whether the corresponding monitoring indicators meet the set trigger standards. It is used to notify and help discover and repair problems in a timely manner, ensuring the security and stability of your cluster. This section describes the steps to configure monitoring alarm components and manage usage. MatrixDB can provide monitoring and alarm functions for the following metrics.
There are also four alarm methods for each indicator, which you can choose at your discretion or use in combination. They are:
In order to use the alarm function, you need to first deploy and enable monitoring. For detailed steps, please refer to: Monitoring Deployment
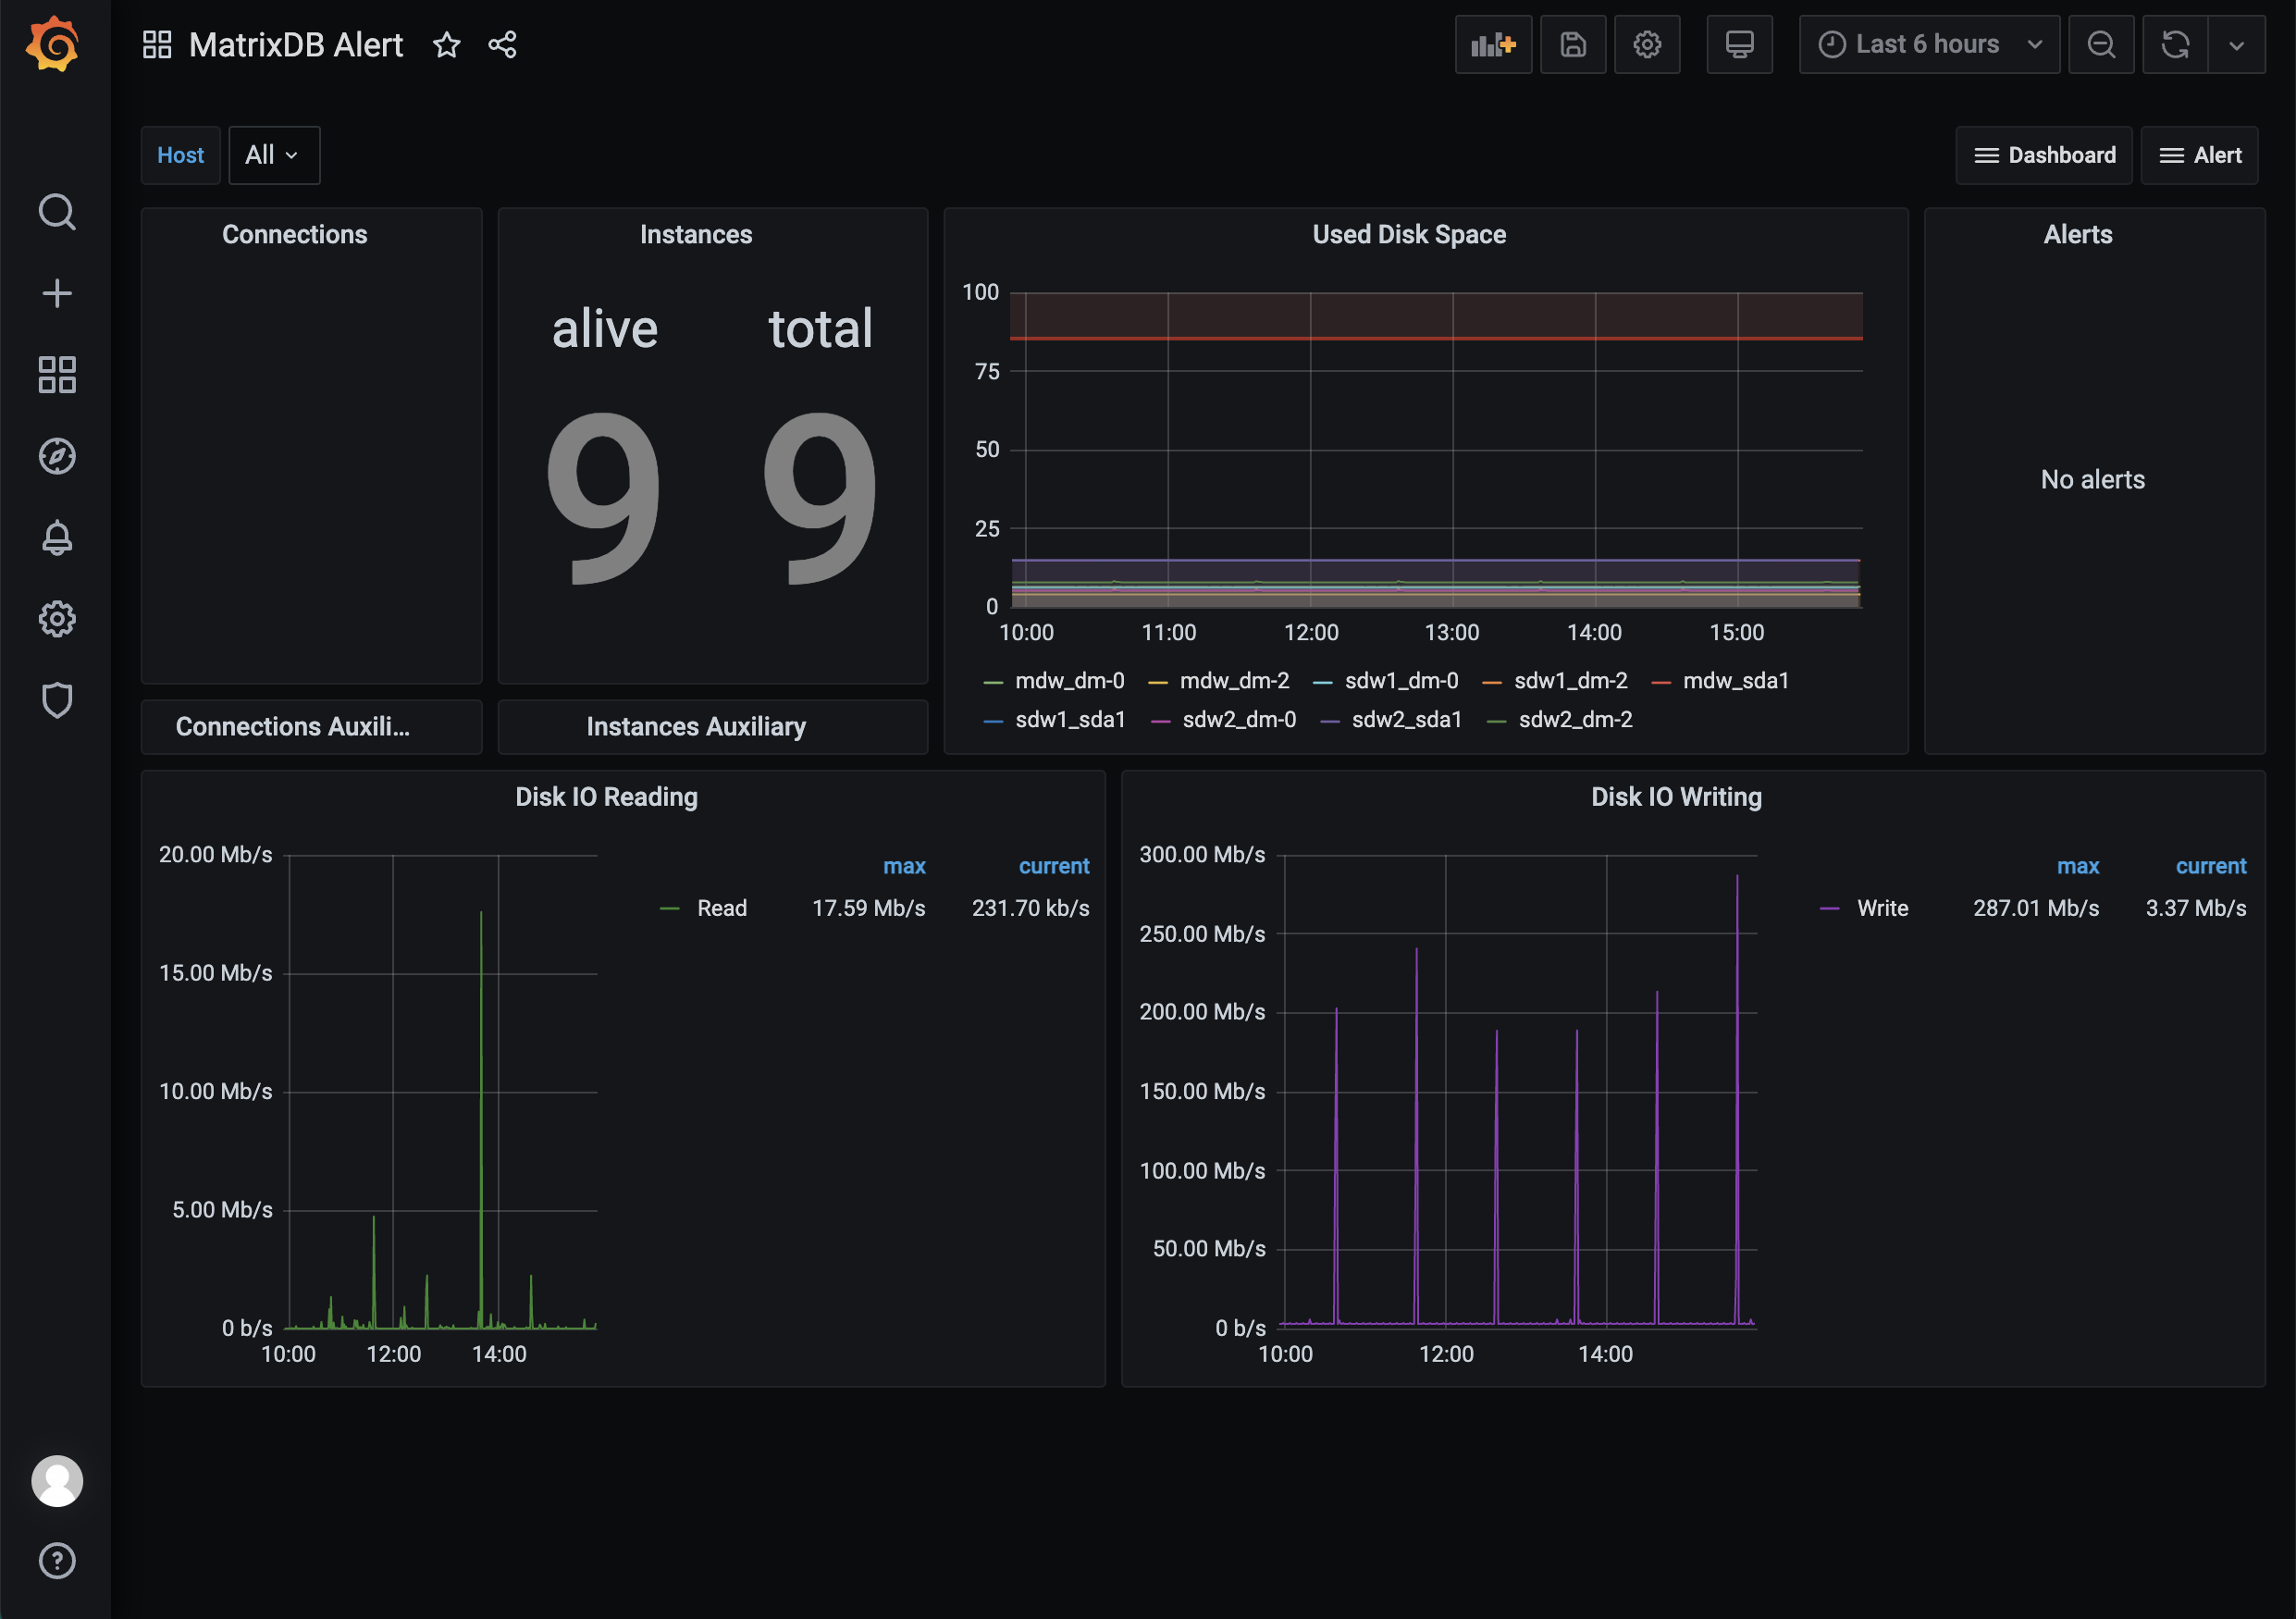
After deployment, you will get the following interface:
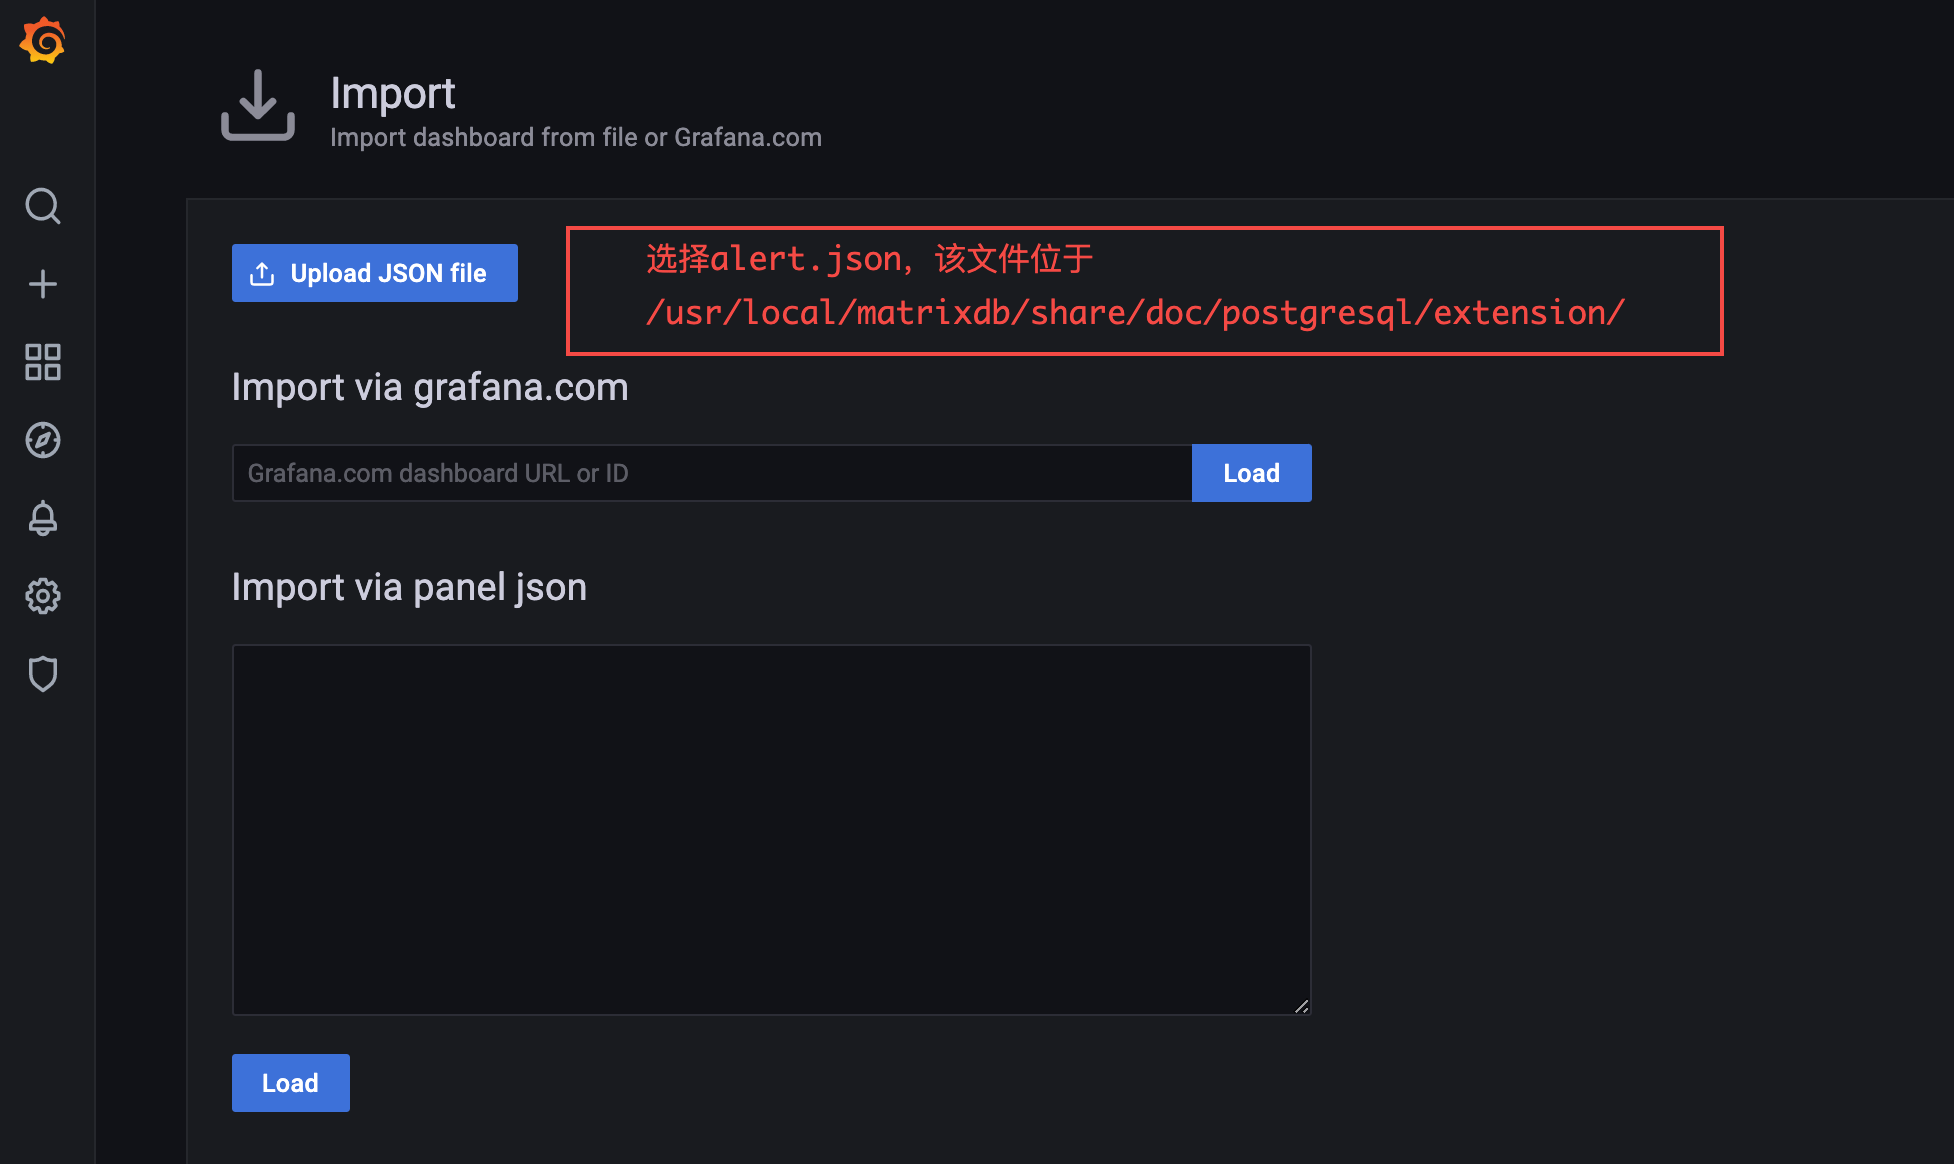
Before importing the predefined alarm panel for deployment configuration, you need to copy the alert.json file from the server to local. Similar to importing dashboard.json and database.json files in Grafana, the idea is: first find the file on the server, then copy it, and finally import and upload it locally. The specific steps are as follows:
First log in to the server, switch to the mxadmin user, and find the alert.json file at the path shown in the picture. You can use the cd command, the find command, or any other method you are good at using.
[mxadmin@mdw ~]$ cd /usr/local/matrixdb/share/doc/postgresql/extension

##or

[mxadmin@mdw ~]$ find /usr/local/matrixdb/share/doc/postgresql/extension -name alert.json
Secondly, use the scp command to copy the file locally. There may be permission issues here. You can consider copying the file to the public area /tmp/ and then copying the file locally from /tmp/.
Notes!
Pay attention to switching users when copying files from /tmp/ to locally to avoid permission issues.[mxadmin@mdw]$ scp mxadmin@< 服务器IP地址 >:/usr/local/matrixdb/share/doc/postgresql/extension/"alert.json" mxadmin@< 服务器IP地址 >:/tmp/
~ scp waq@< 服务器IP地址 >:/tmp/"alert.json" /Users/akkepler/workplace/Grafana
Finally, click the local folder directly, or use the command line to check whether the file is copied successfully. After success, you need to batch modify the variable $host of the alert.json file locally to the actual all host names. That means if you now have a cluster master + 2 segment, with names called mdw, sdw1, sdw2, then you need to change all $hosts in your alert.json file to 'mdw', 'sdw1', 'sdw2' . After the modification is completed, just import and upload files in the Grafana interface.
> ***Notes!***
The dashboard.json file and database.json file beat on your Grafana interface also need to be modified and the upload order must be before the alert.json file. dashboard.json needs to modify all ${cluster} to local and $host is the actual all host names. database.json just need to modify the former.
The alarm panel and the monitoring panel are used in the same way, and can be switched to each other through the drop-down list. The drop-down list is located in the upper right corner of each panel.
## 2. Configuration instructions
### 2.1 Configure alarm channels
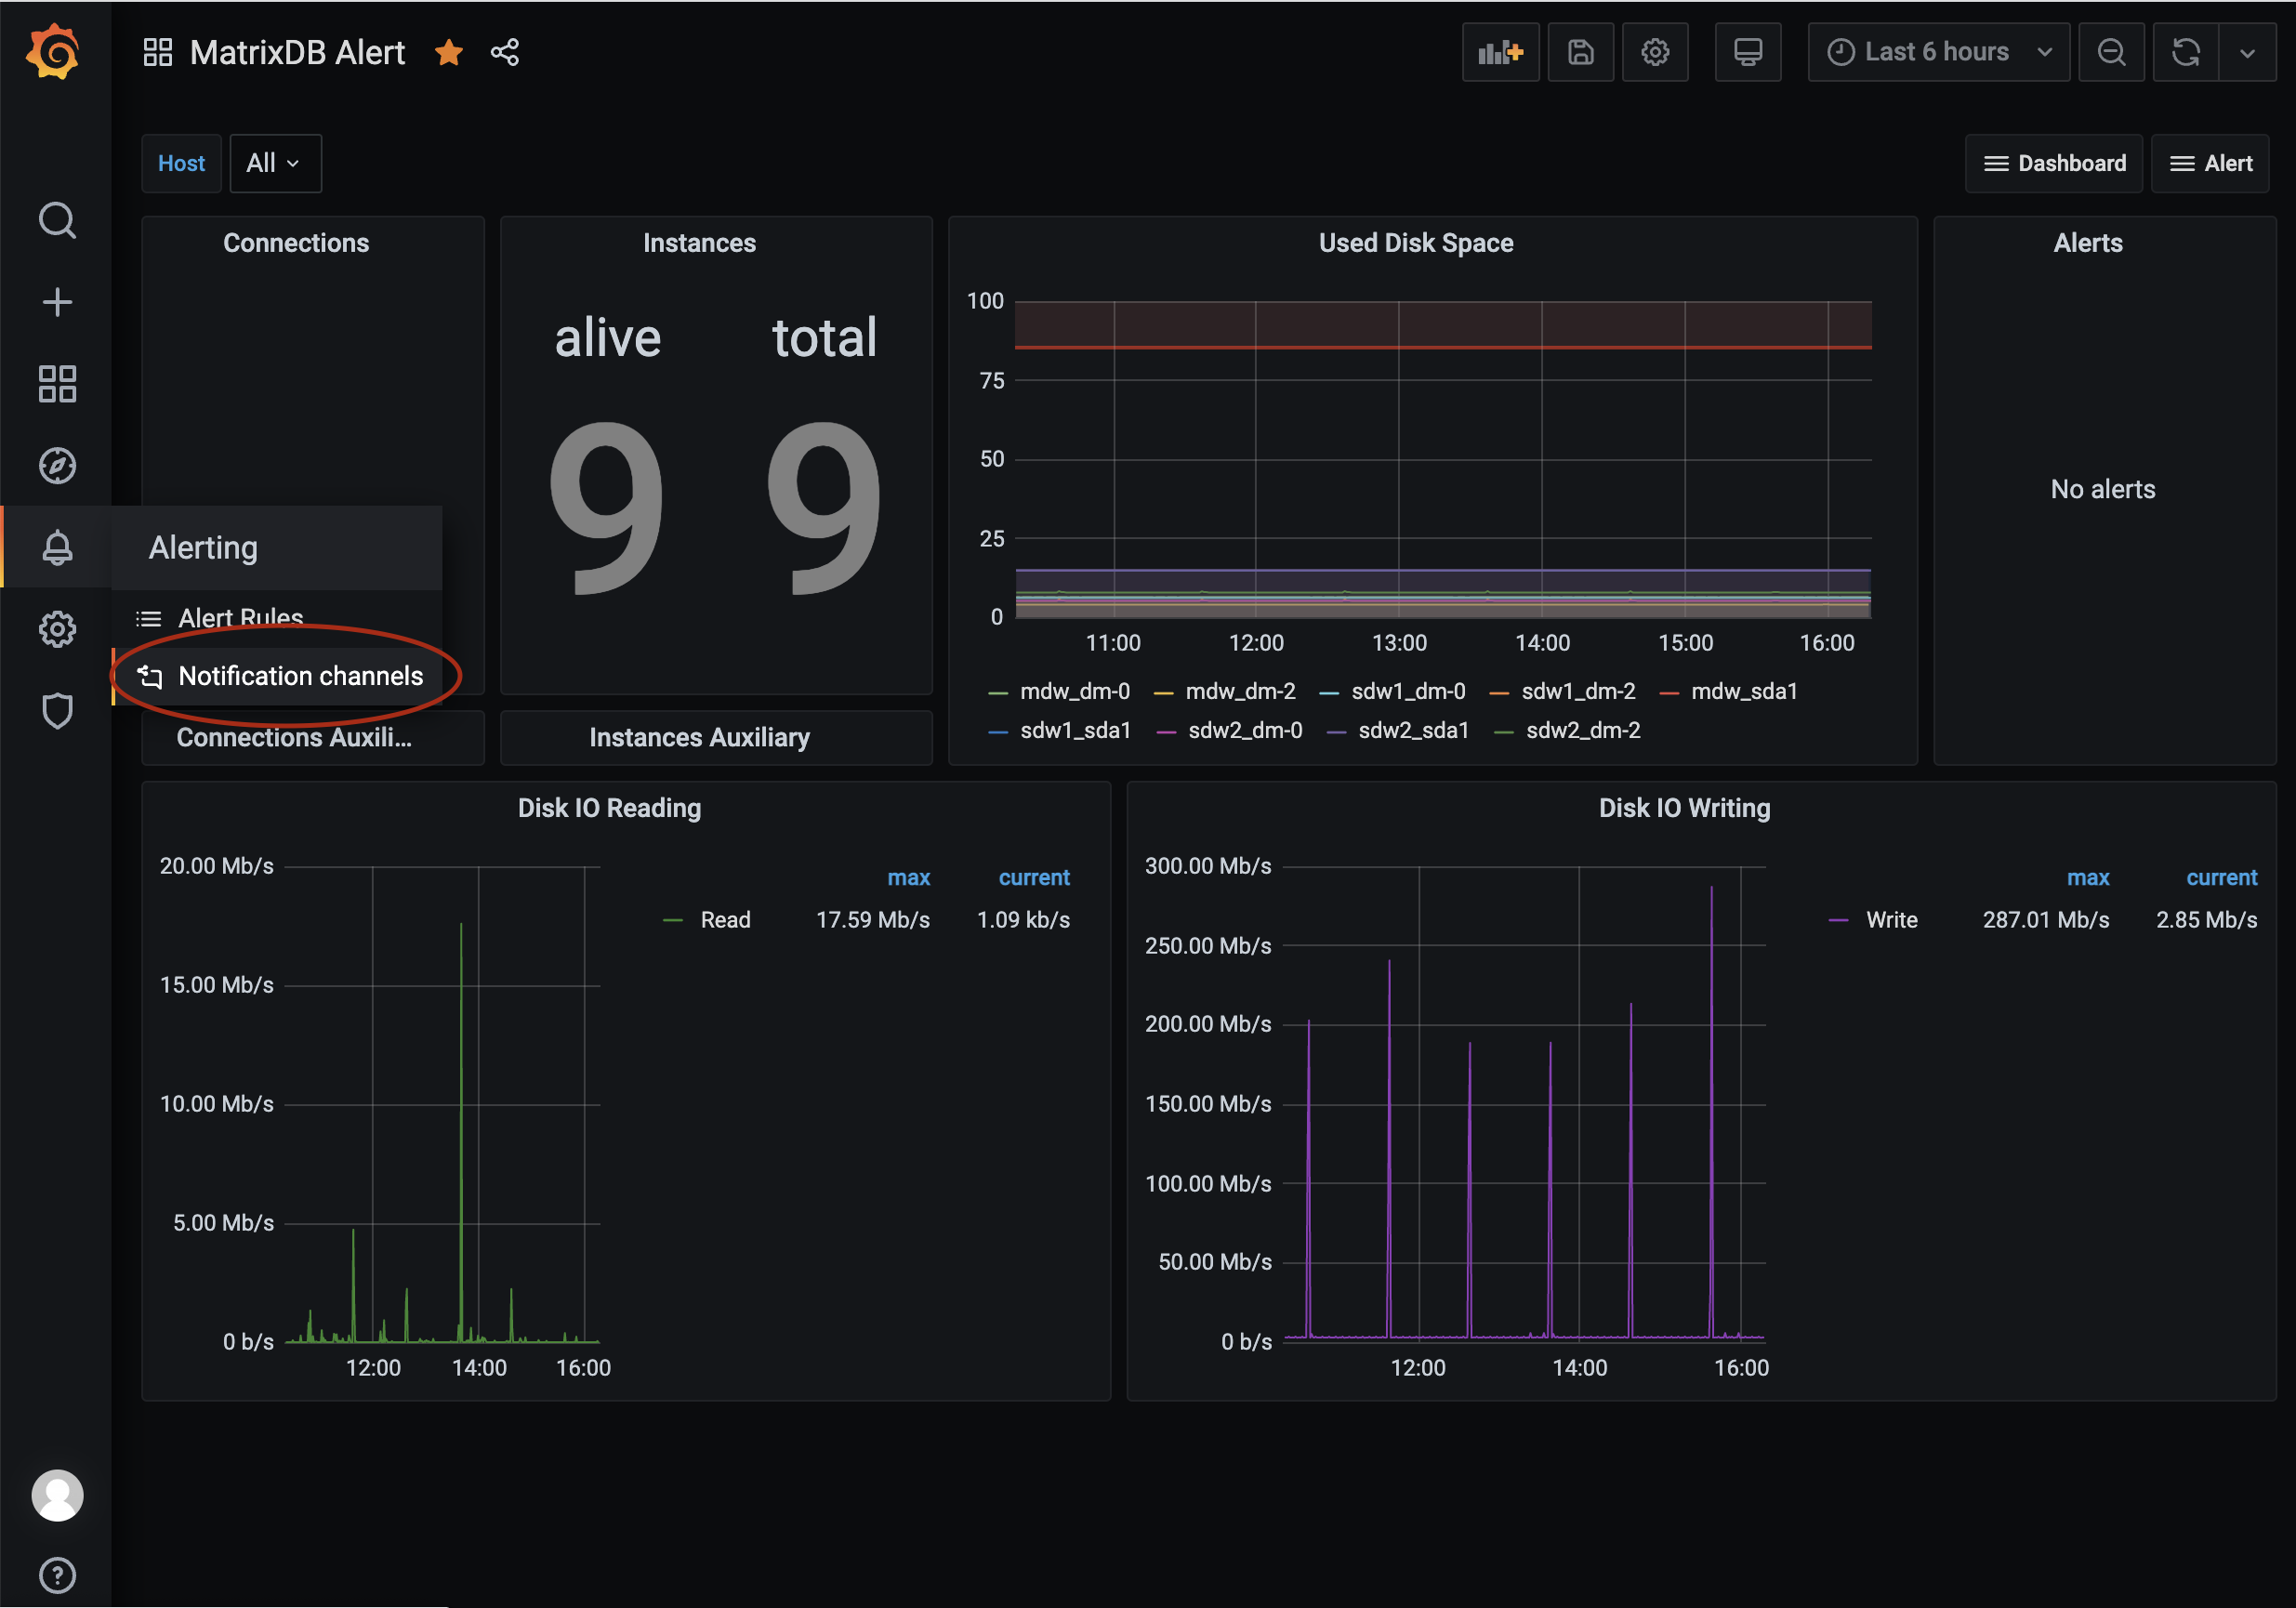
First, you need to configure the Notification Channels, the entrance is as follows:
#### 2.1.1 SMS Alarm
MatrixDB has built-in alarm function based on Alibaba Cloud SMS service, and it is recommended to use it. Select the built-in service. If the alarm is triggered, it will send a text message to the mobile phone number you configured. Supports batch sending. Before using it, you need to apply for and configure Alibaba Cloud's SMS service. For detailed steps, please refer to:
[Aliyun Document: Quick Start of Domestic SMS](https://help.aliyun.com/document_detail/55288.html)
You can also configure the webhook to make SMS alarms by yourself. You need to program the logic of the webhook. For the specific method, please refer to [Grafana Alert Document: Webhook Notifications](https://grafana.com/docs/grafana/latest/alerting/notifications/#webhook)
#### 2.1.1.1 Write configuration files
In the /etc/matrixdb/ directory, create the alert.yaml file
```yaml
# aliyun service config
aliyun_service:
access_key_id: "your access_key_id"
access_key_secret: " access_key_secret"
signature: "signature"
sms_template_code: "SMS_123445678"
Among them, access_key_id and access_key_secret are the Access Key ID and Access Key Access distributed after opening Alibaba Cloud services. signature is the original signature text that was successfully registered and approved in the Alibaba Cloud SMS service control panel. sms_templatecode starts with "SMS" and is successfully registered and approved in the Alibaba Cloud SMS service control panel. The original text of the template can be viewed on Alibaba Cloud platform. The variable that carries the specific alarm information is set to ${name}. Here is an example:
尊敬的管理员您好,贵公司的数据库系统发生${name}报警,请登陆网站查看详情,并及时处理。As shown in the figure:

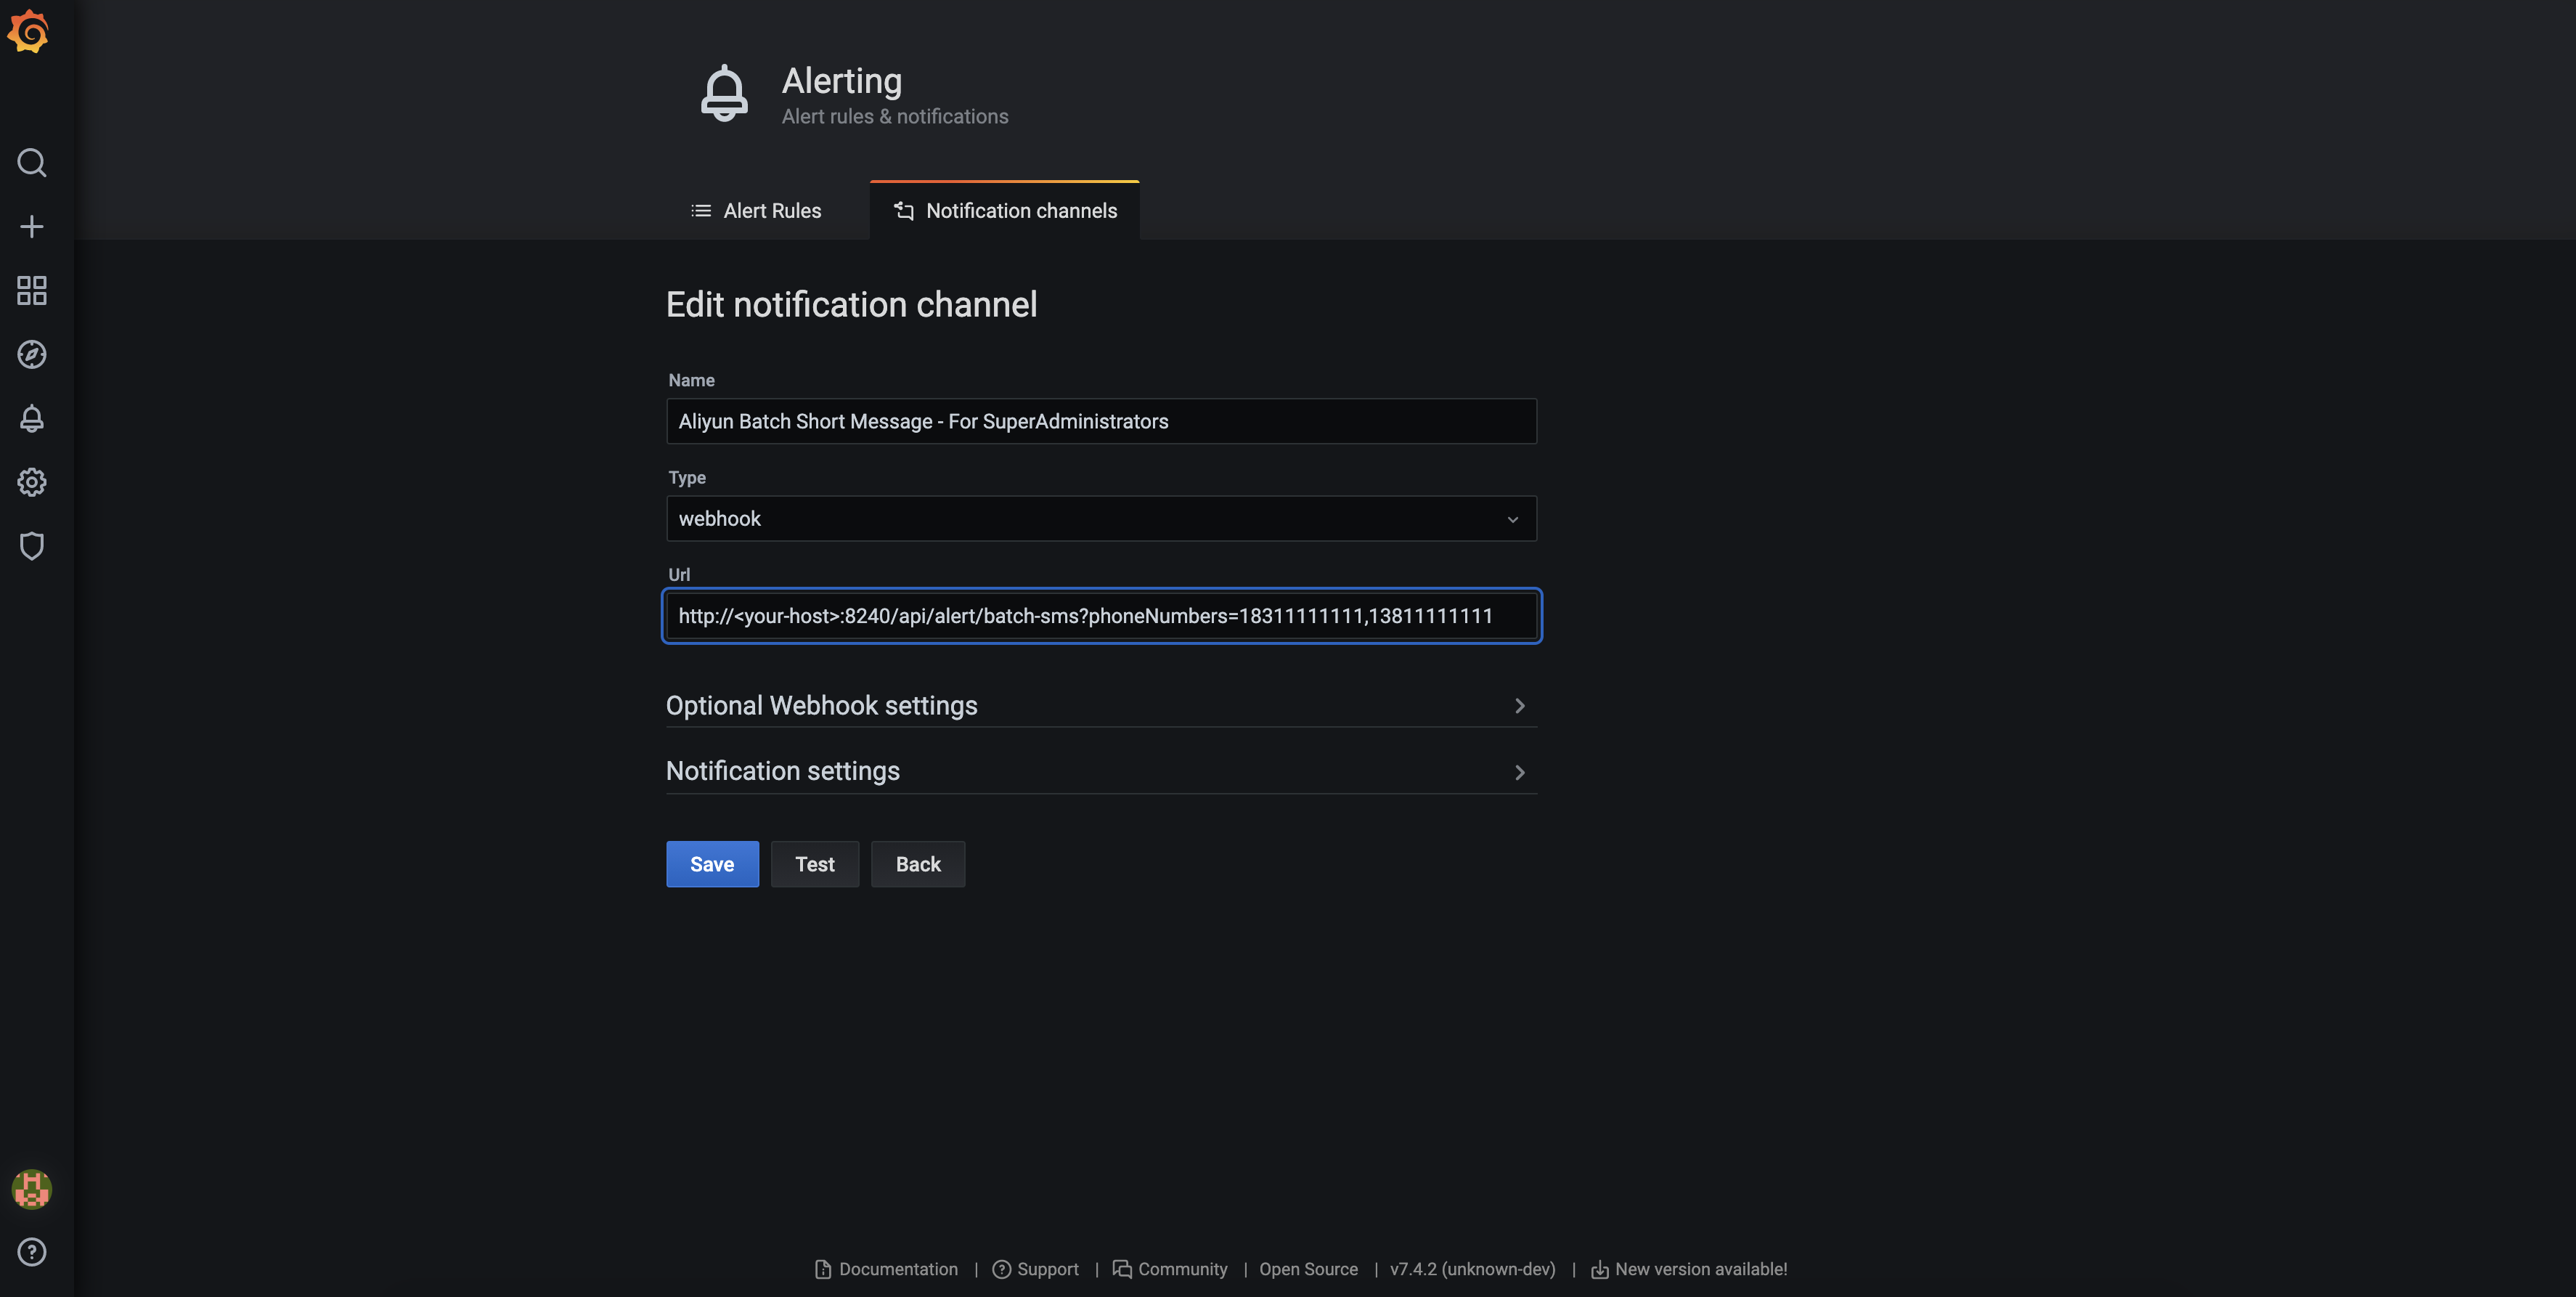
It is recommended to fill in the channel name according to the following rules:
Aliyun Batch Short Message - For SuperAdministrators
Among them, "SuperAdministrators" is a group of people who need to receive alarm notifications. To define another group of people who need to be notified of alarms, you need to configure the rules separately. In addition, the "phoneNumbers" parameter is case sensitive and can be configured to achieve batch sending, separated by English commas.
http://
: /api/alert/batch-sms?phoneNumbers=183111111111,1381111111111111111
In addition to the SMS alarm function, MatrixDB also has a built-in alarm function based on Alibaba Cloud phone voice service. If an alarm is triggered, it will make a call to the mobile phone number you configured. Bulk dialing is also supported. Before using it, you need to apply for and configure Alibaba Cloud's voice telephone service. For detailed steps, please see: Aliyun Document: Quick Start of Domestic Voice Services
You can also configure the webhook for phone voice alarms by yourself, but it requires programming to implement the logic of the webhook. I will not explain it in detail here. If you are interested, please see the specific method. Grafana Alert Document: Webhook Notifications
Add two items tts_template_code, region_id in the alert.yaml file under the /etc/matrixdb/ directory.
# aliyun service config
aliyun_service:
  access_key_id: "your access_key_id"
  access_key_secret: " access_key_secret"
  signature: "signature"
  sms_template_code: "SMS_123445678"
  tts_template_code: "TTS_123456788"
  region_id: "cn-hangzhou"
where access_key_id and access_key_secret are shared with information services. tts_templatecode starts with "TTS", and is successfully registered in the Alibaba Cloud TTS voice service control panel and reviewed and passed the TTS voice template code. The original text of the template can be viewed on Alibaba Cloud platform. The variable that carries the specific alarm information is set to ${name}.
 It is recommended to fill in the channel name according to the following rules:
Aliyun Voice Message - For SuperAdministrators
Among them, "SuperAdministrators" is a group of people who need to receive alarm notifications. To define another group of people who need to be notified of alarms, you need to configure the rules separately. In addition, the "phoneNumbers" parameter is case sensitive and can be configured to achieve batch sending, separated by English commas.
http://
: /api/alert/vms?phoneNumbers=183111111111,13811111111111111111
Grafana also has a built-in Email alarm channel, which is simple to configure and easy to use.
Because the Email alarm is a feature of grafana, the SMTP server is configured in the grafana configuration file. Grafana's configuration file may change due to grafana deployment, and the default path on CentOS 7 is:
/usr/local/etc/grafana/grafana.ini
For more related information, please see: grafana official document: Configuration
We have prepared a possible configuration for you:
################################################### SMTP / Emailing #############################################
[smtp]
enabled = true
host = <your smtp host>
user = <your user>
# If the password contains # or ; you have to wrap it with triple quotes. Ex """#password;"""
password = <your password>
;cert_file =
;key_file =
skip_verify = true
from_address = <your email address>
from_name = Grafana
;ehlo_identity =
;startTLS_policy =

[emails]
welcome_email_on_sign_up = false
templates_pattern = emails/*.htmlAs shown in the figure:
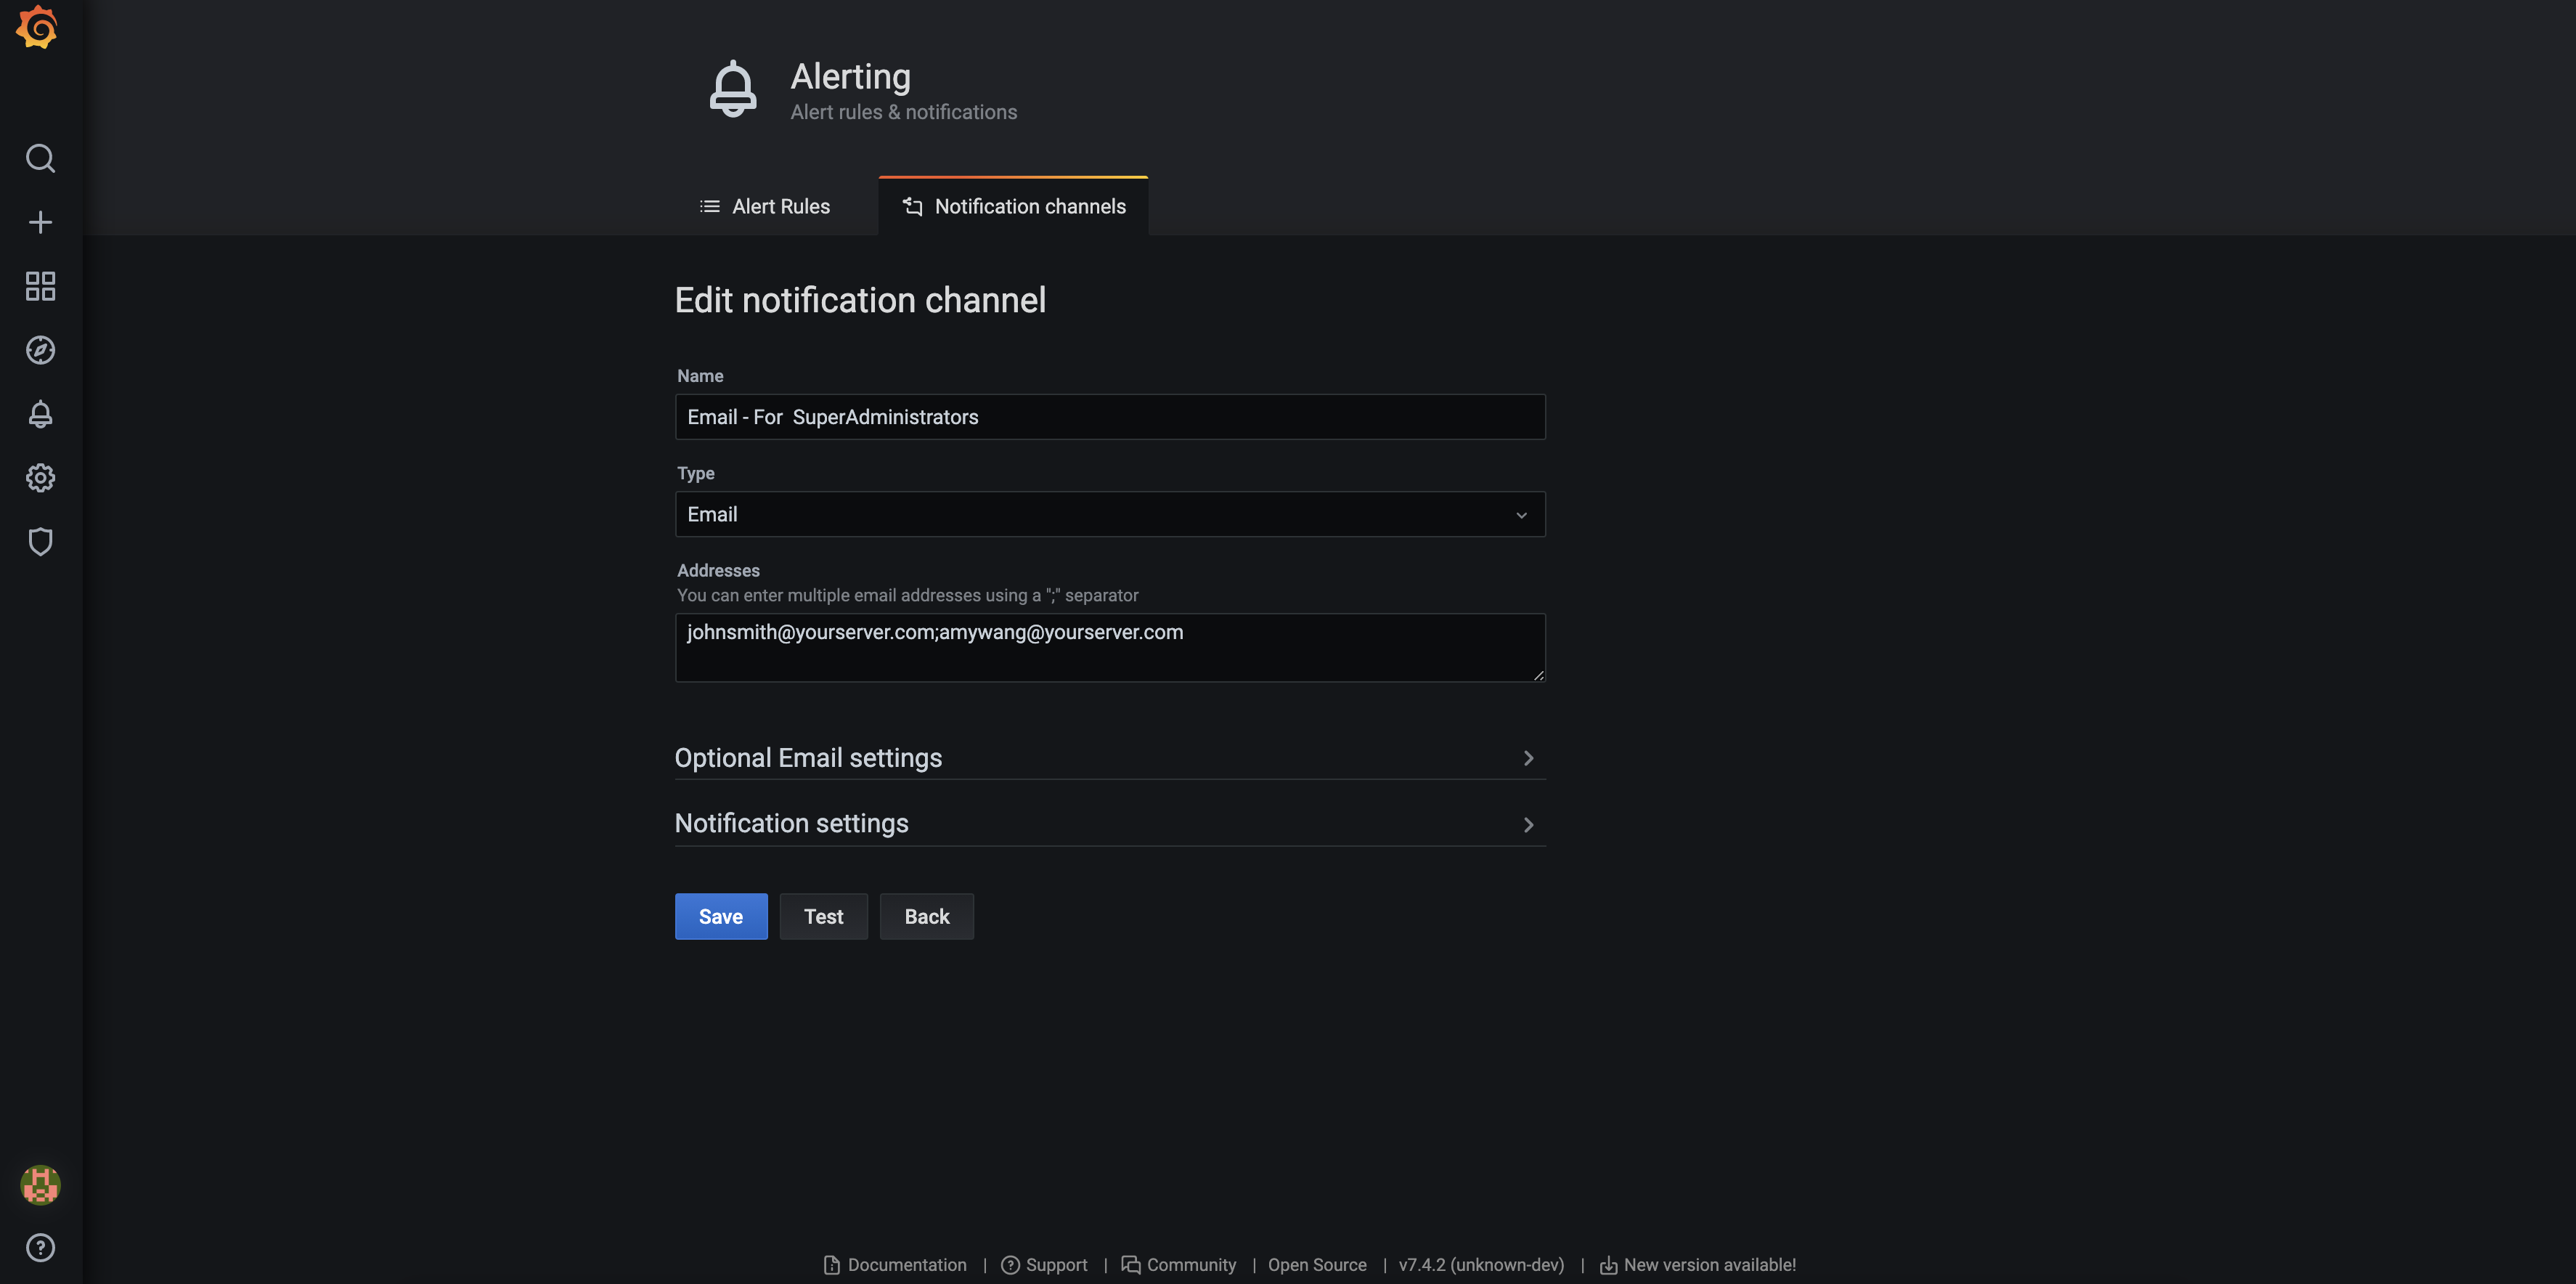 It is recommended to fill in the channel name according to the following rules:
Email - For SuperAdministrators
Among them, "SuperAdministrators" is a group of people who need to receive alarm notifications. To define another group of people who need to be notified by alarms, please configure the rules separately.
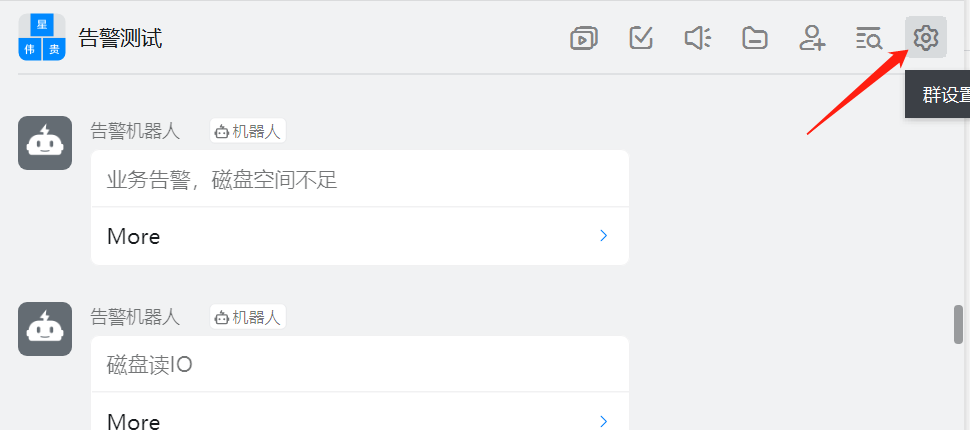
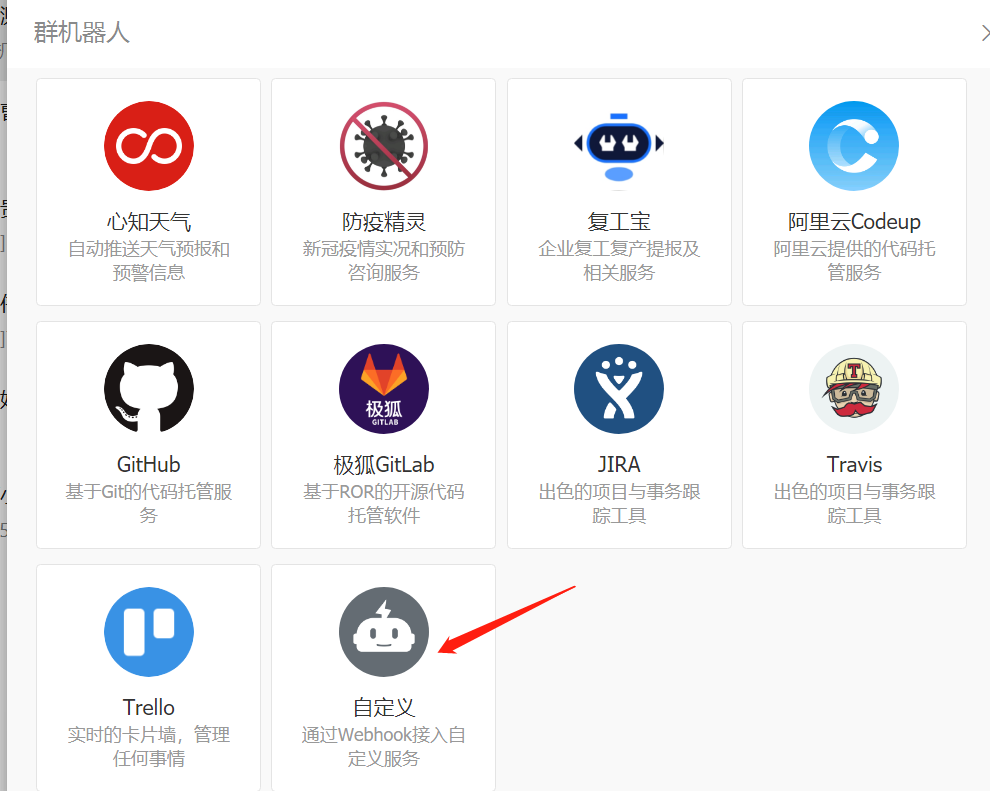
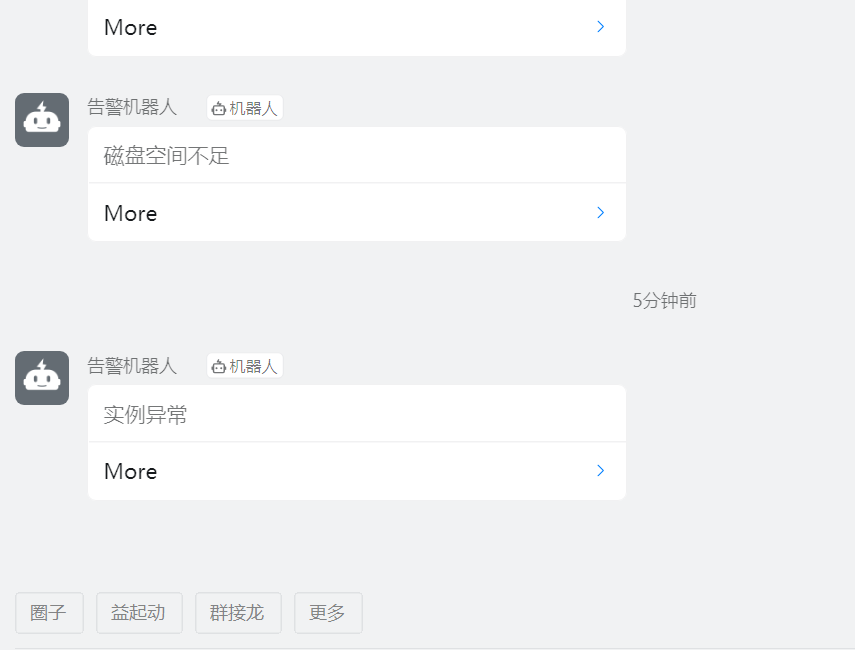
MatrixDB provides DingTalk-based alarm function. If an alarm is triggered, the alarm robot you set up in advance will send a prompt message in the group. In order to make full use of this function, you need to make dual configurations in the DingTalk software and the Grafana interface in advance.
As shown in the figure: You need to create a DingTalk group and configure one or more DingTalk alert robots.

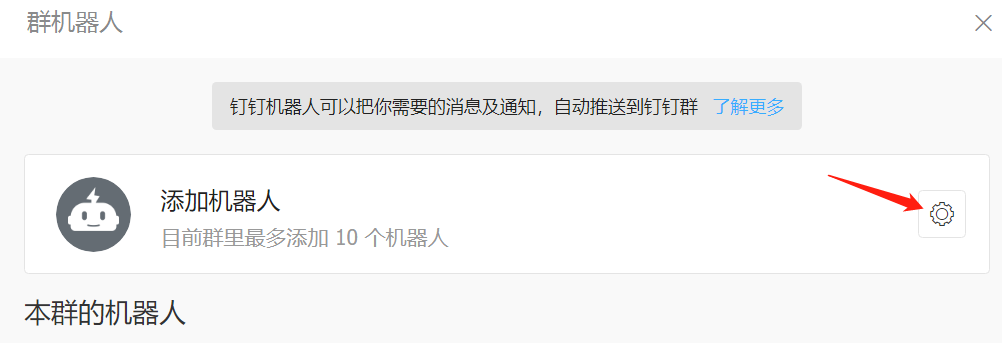
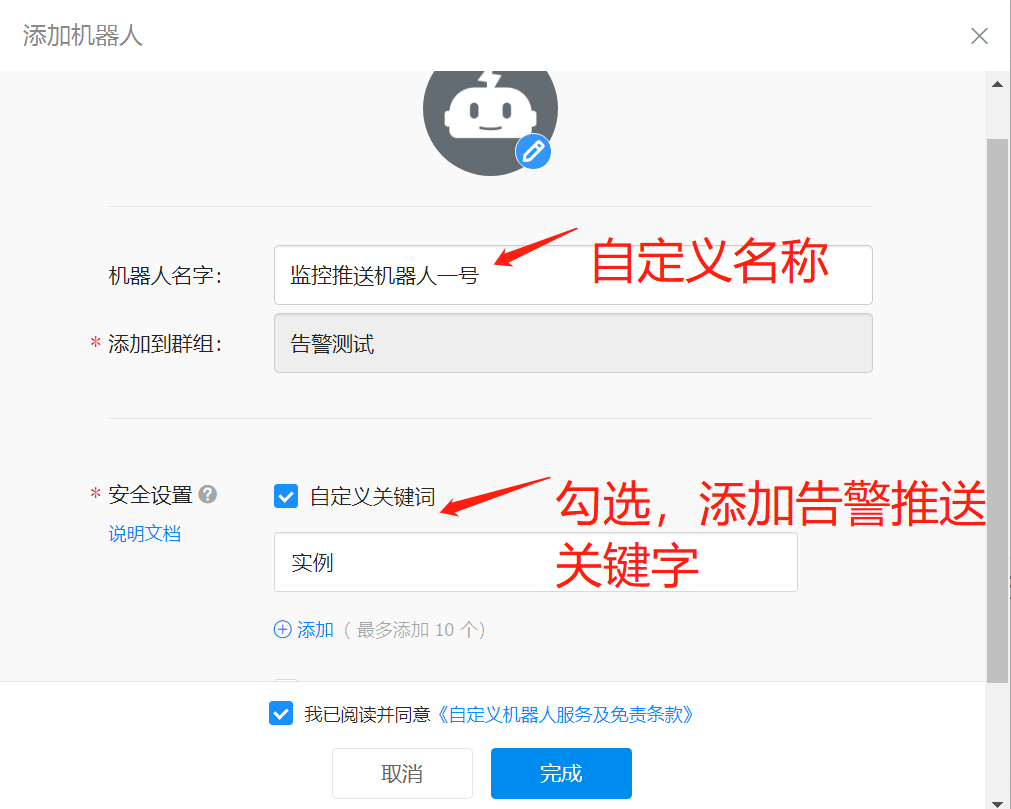
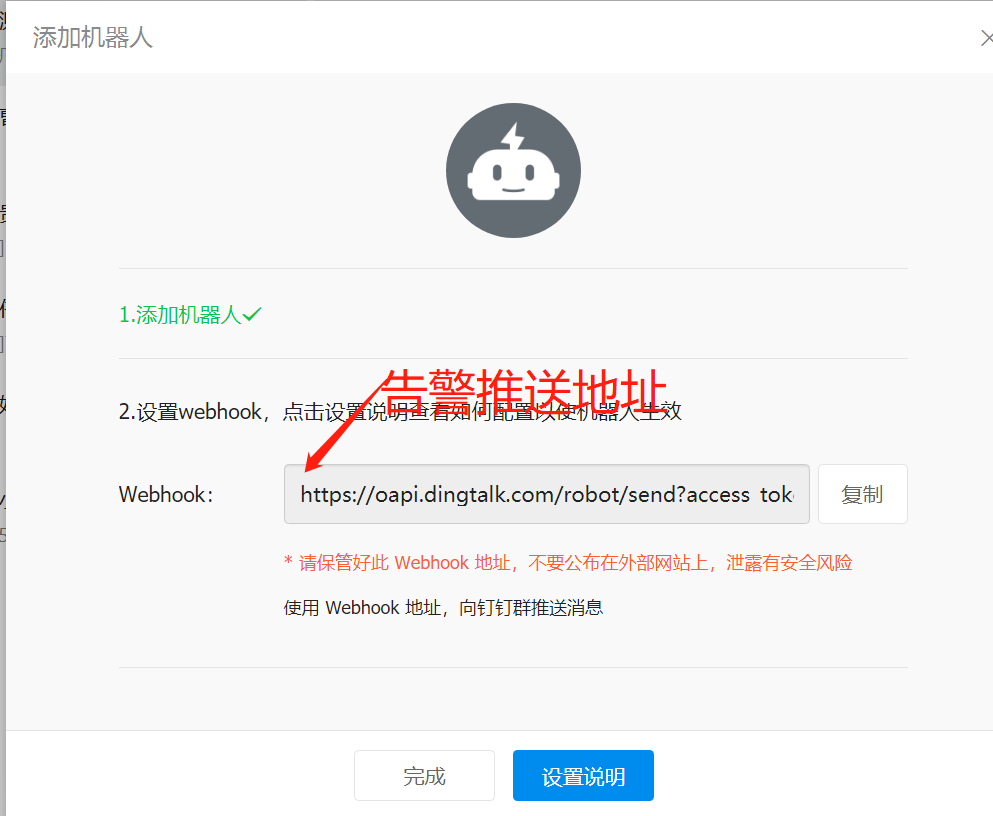
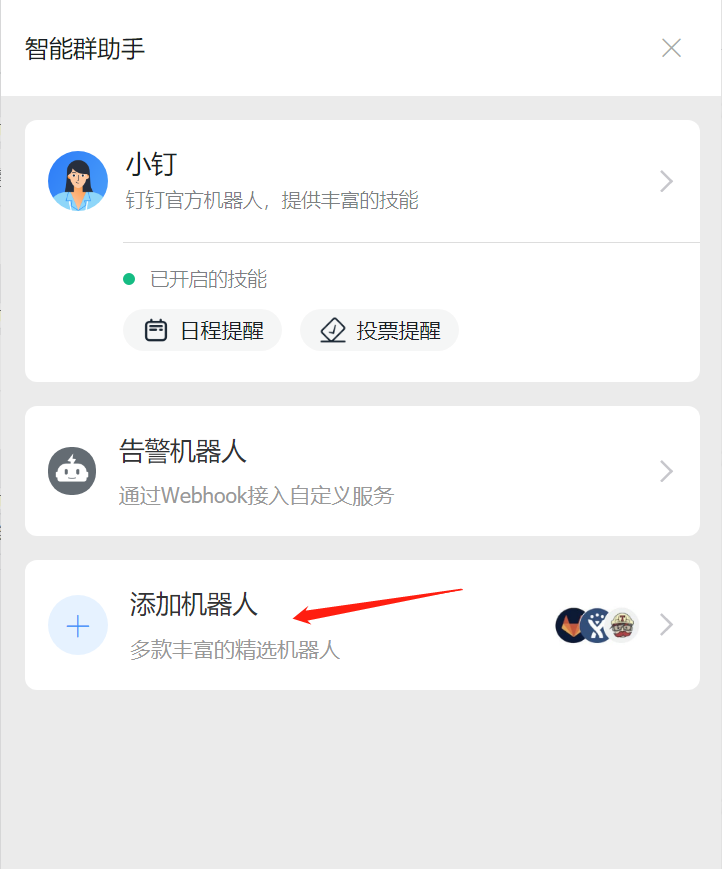 Click the settings button in the "Add Robot" interface and select "Custom". You can customize the robot name, add the alarm push keyword, and finally save the alarm push address.
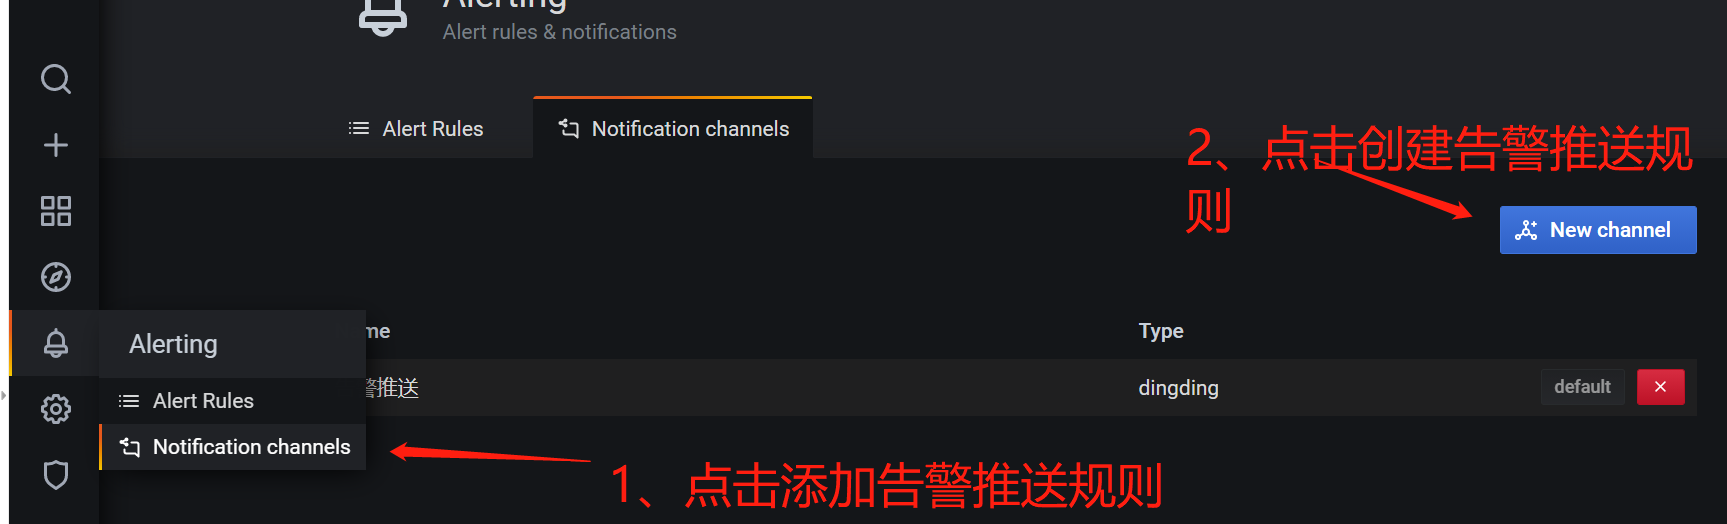
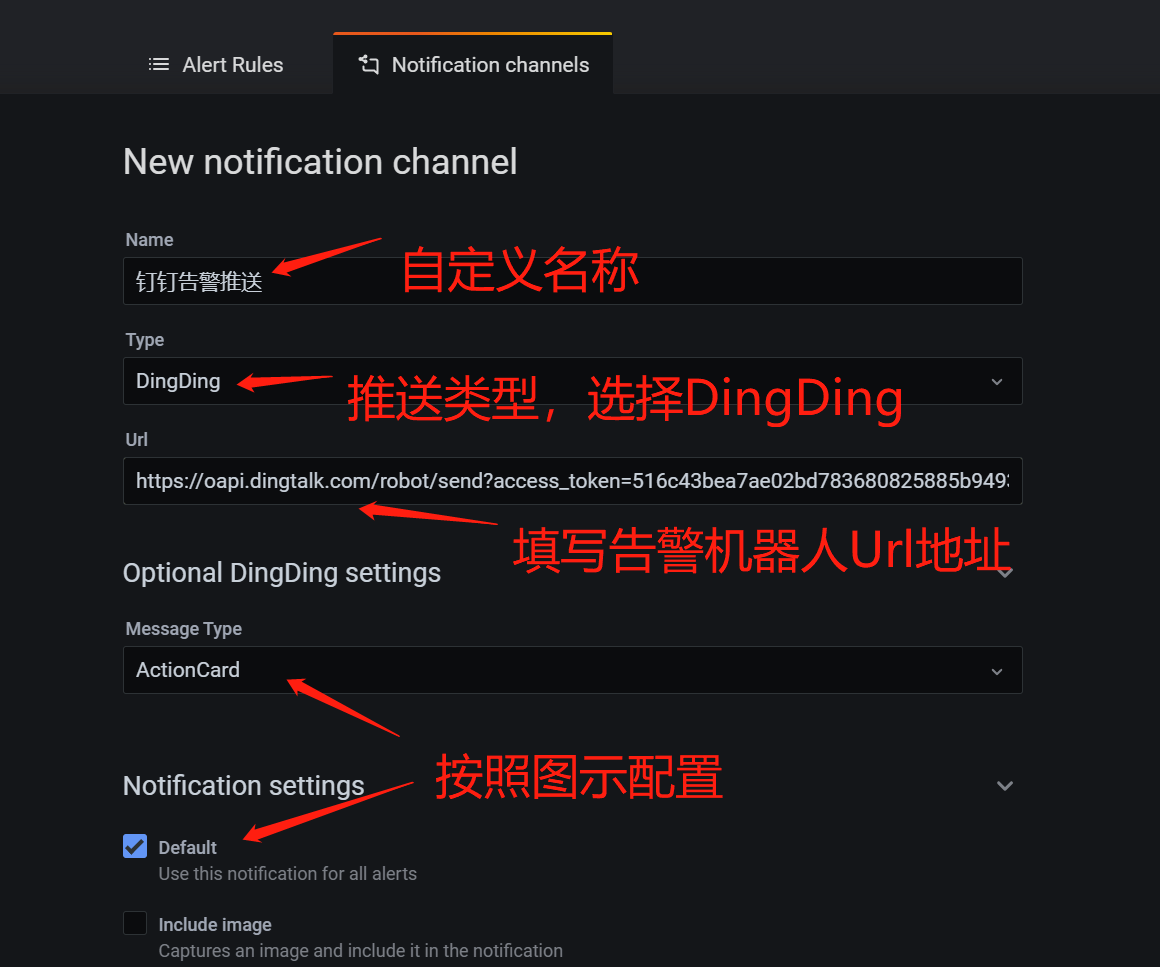
First, you need to create push rules in the Grafana interface and fill in the relevant options.
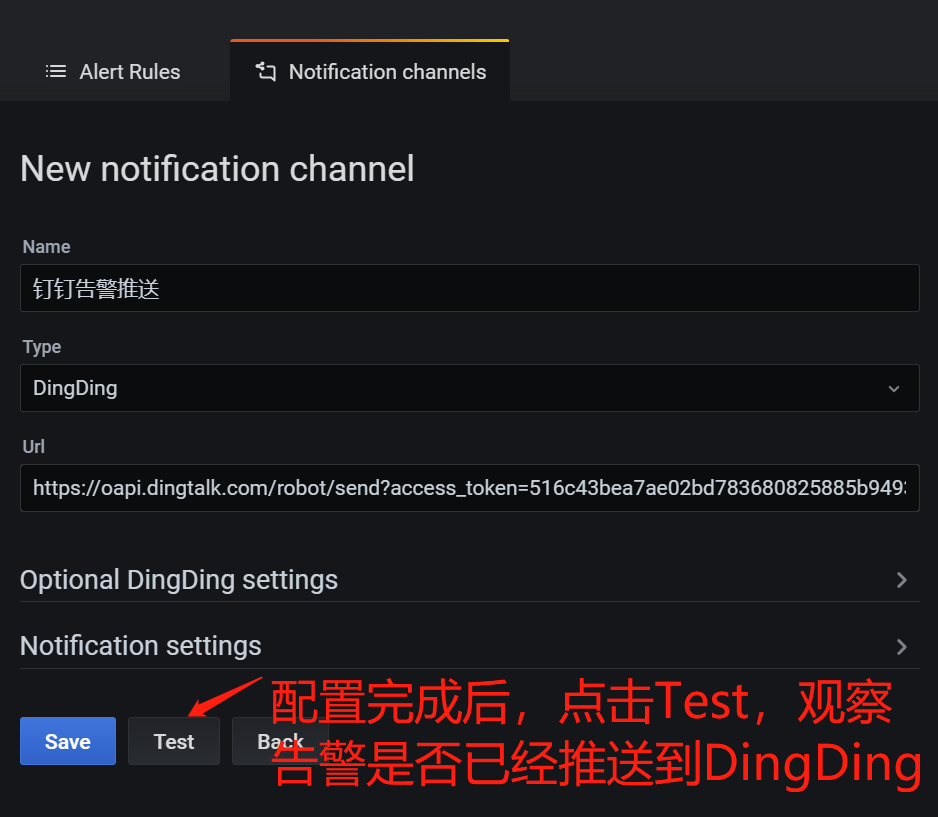
 After the configuration is completed, click "Test" to check whether Grafana and DingTalk are connected. If it is connected, you can click the relevant alarm information in the DingTalk alarm group to jump to the Grafana interface. If the web page fails to load, the error "localhost rejects our connection request", and you may have forgotten to modify localhost to your IP address.
After the alarm channel is configured, you need to configure the alarm (Alert) parameters for each monitoring alarm view.
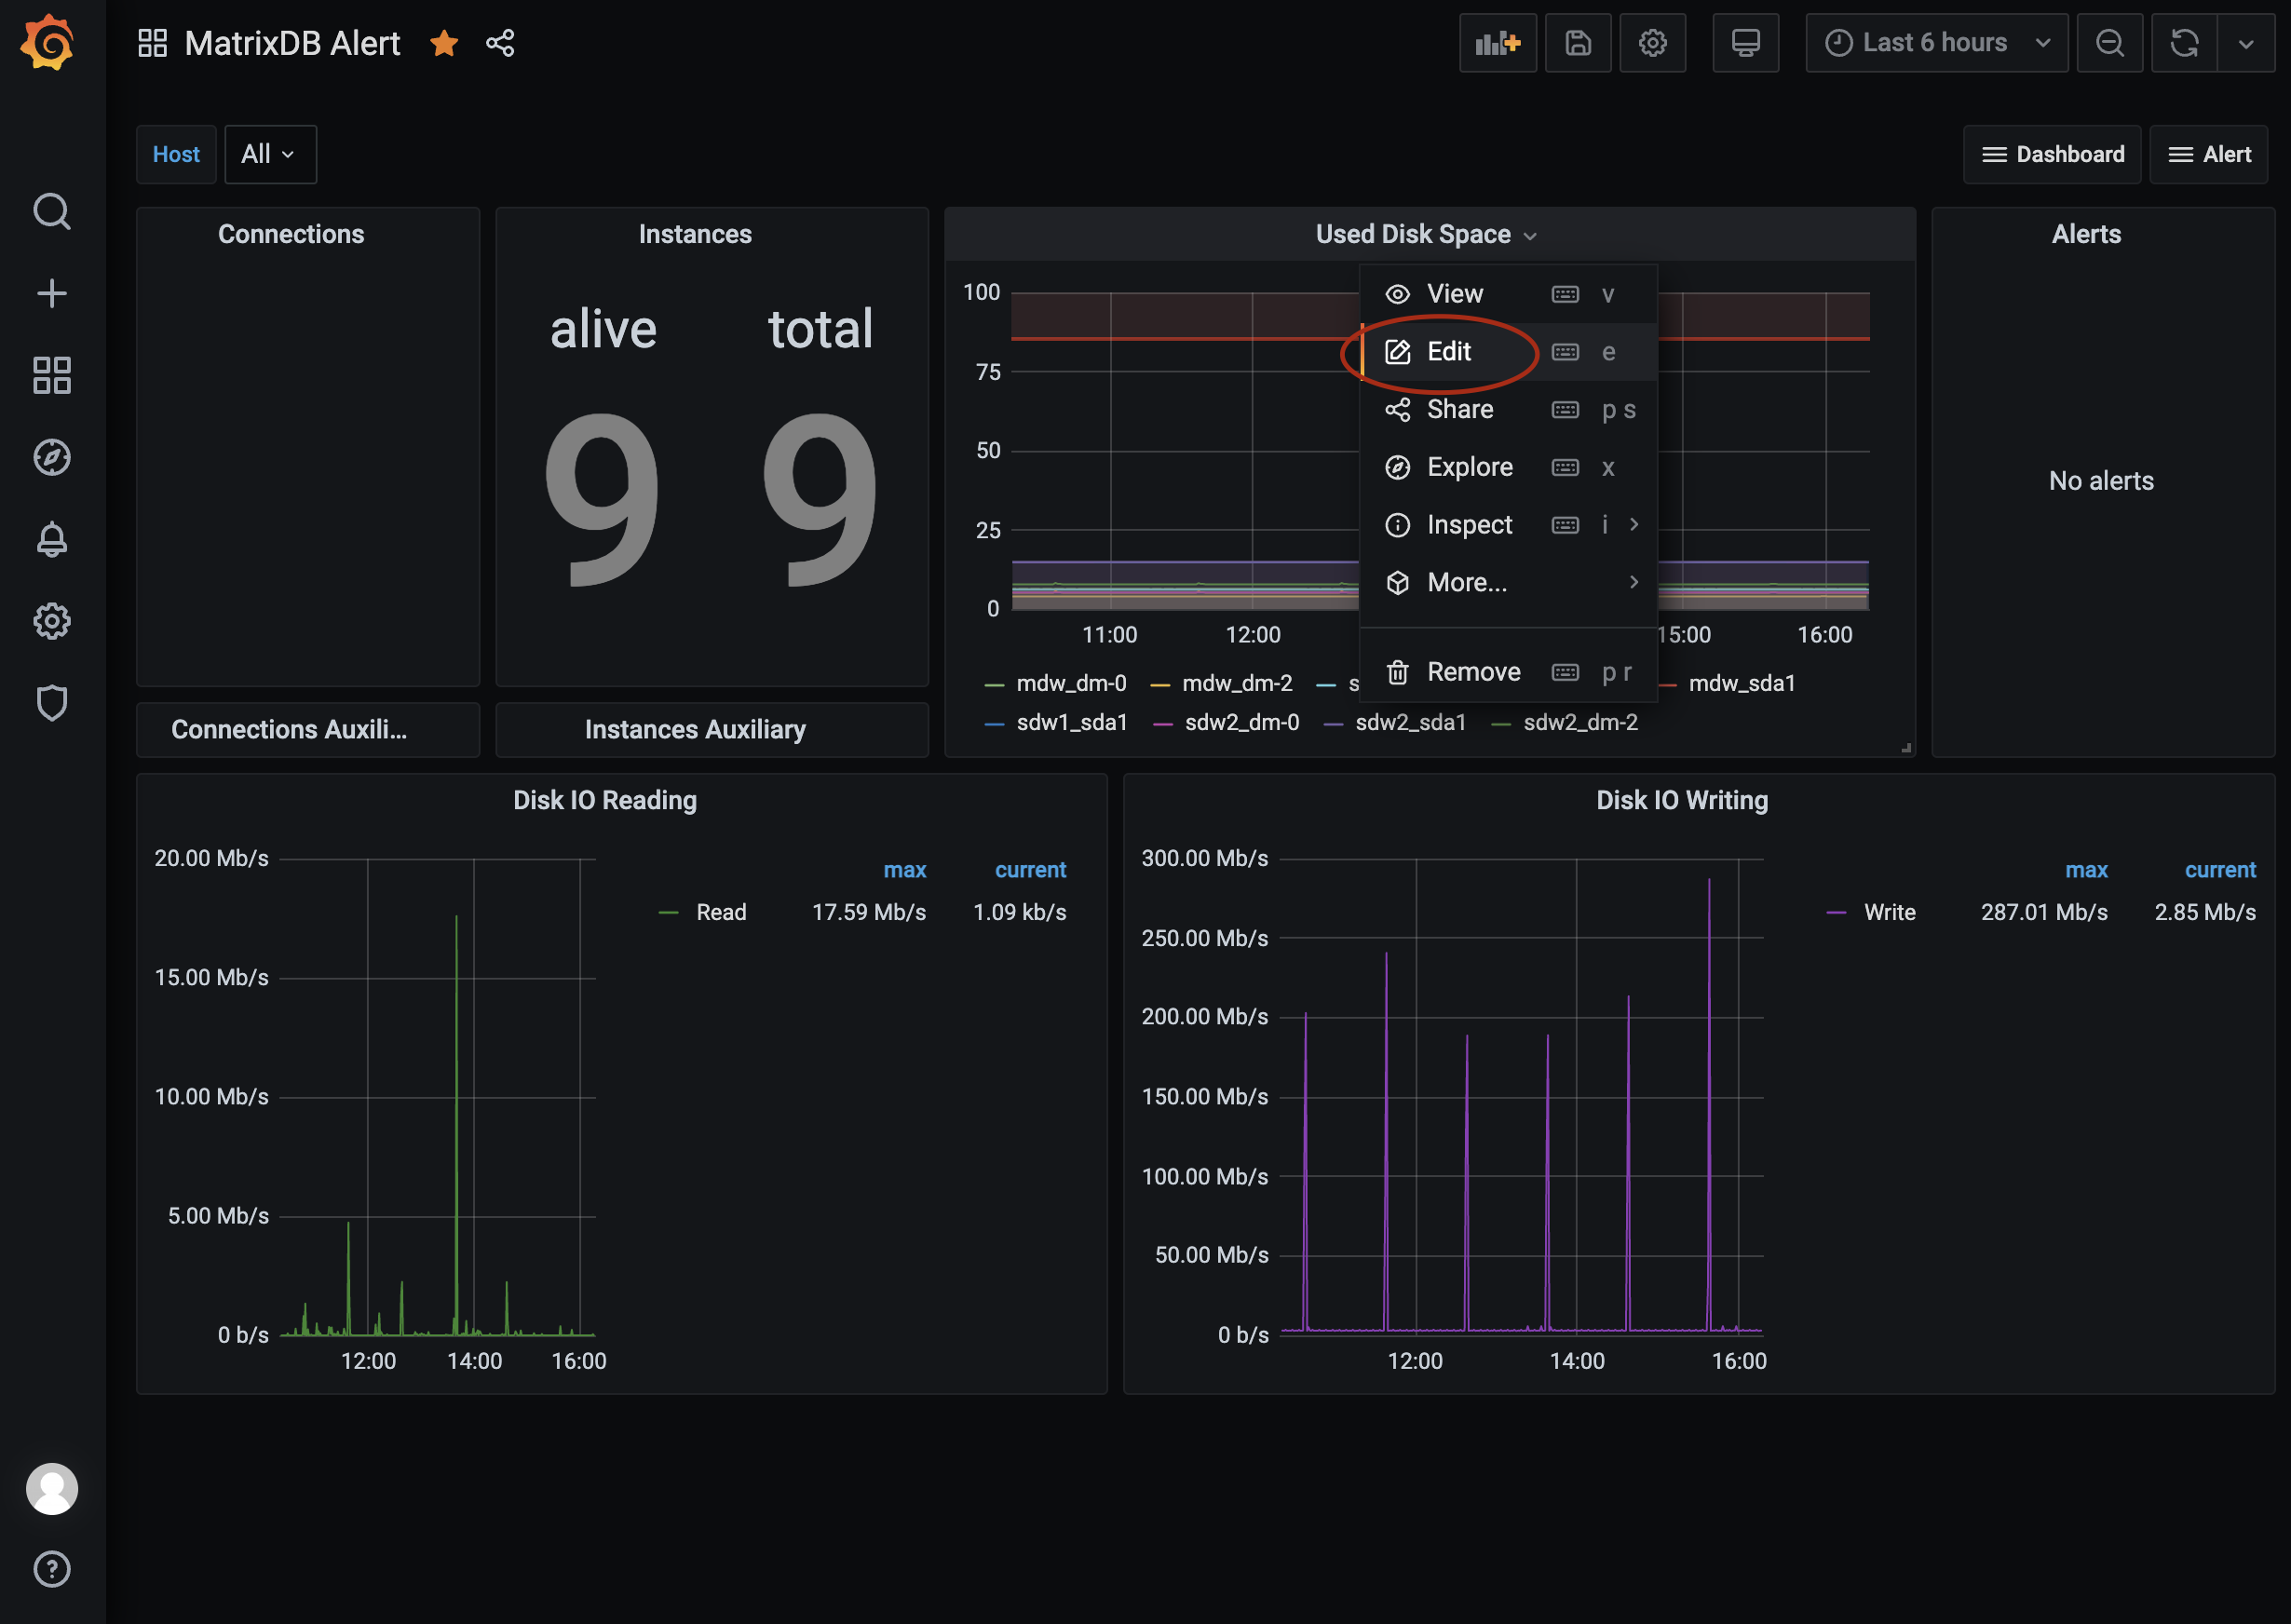
For parameter configuration and other information, please see: grafana official document: AlertHover over the specific alarm module name, and you can see the drop-down arrow to the right of the name. Click "Edit" to enter the editing panel.
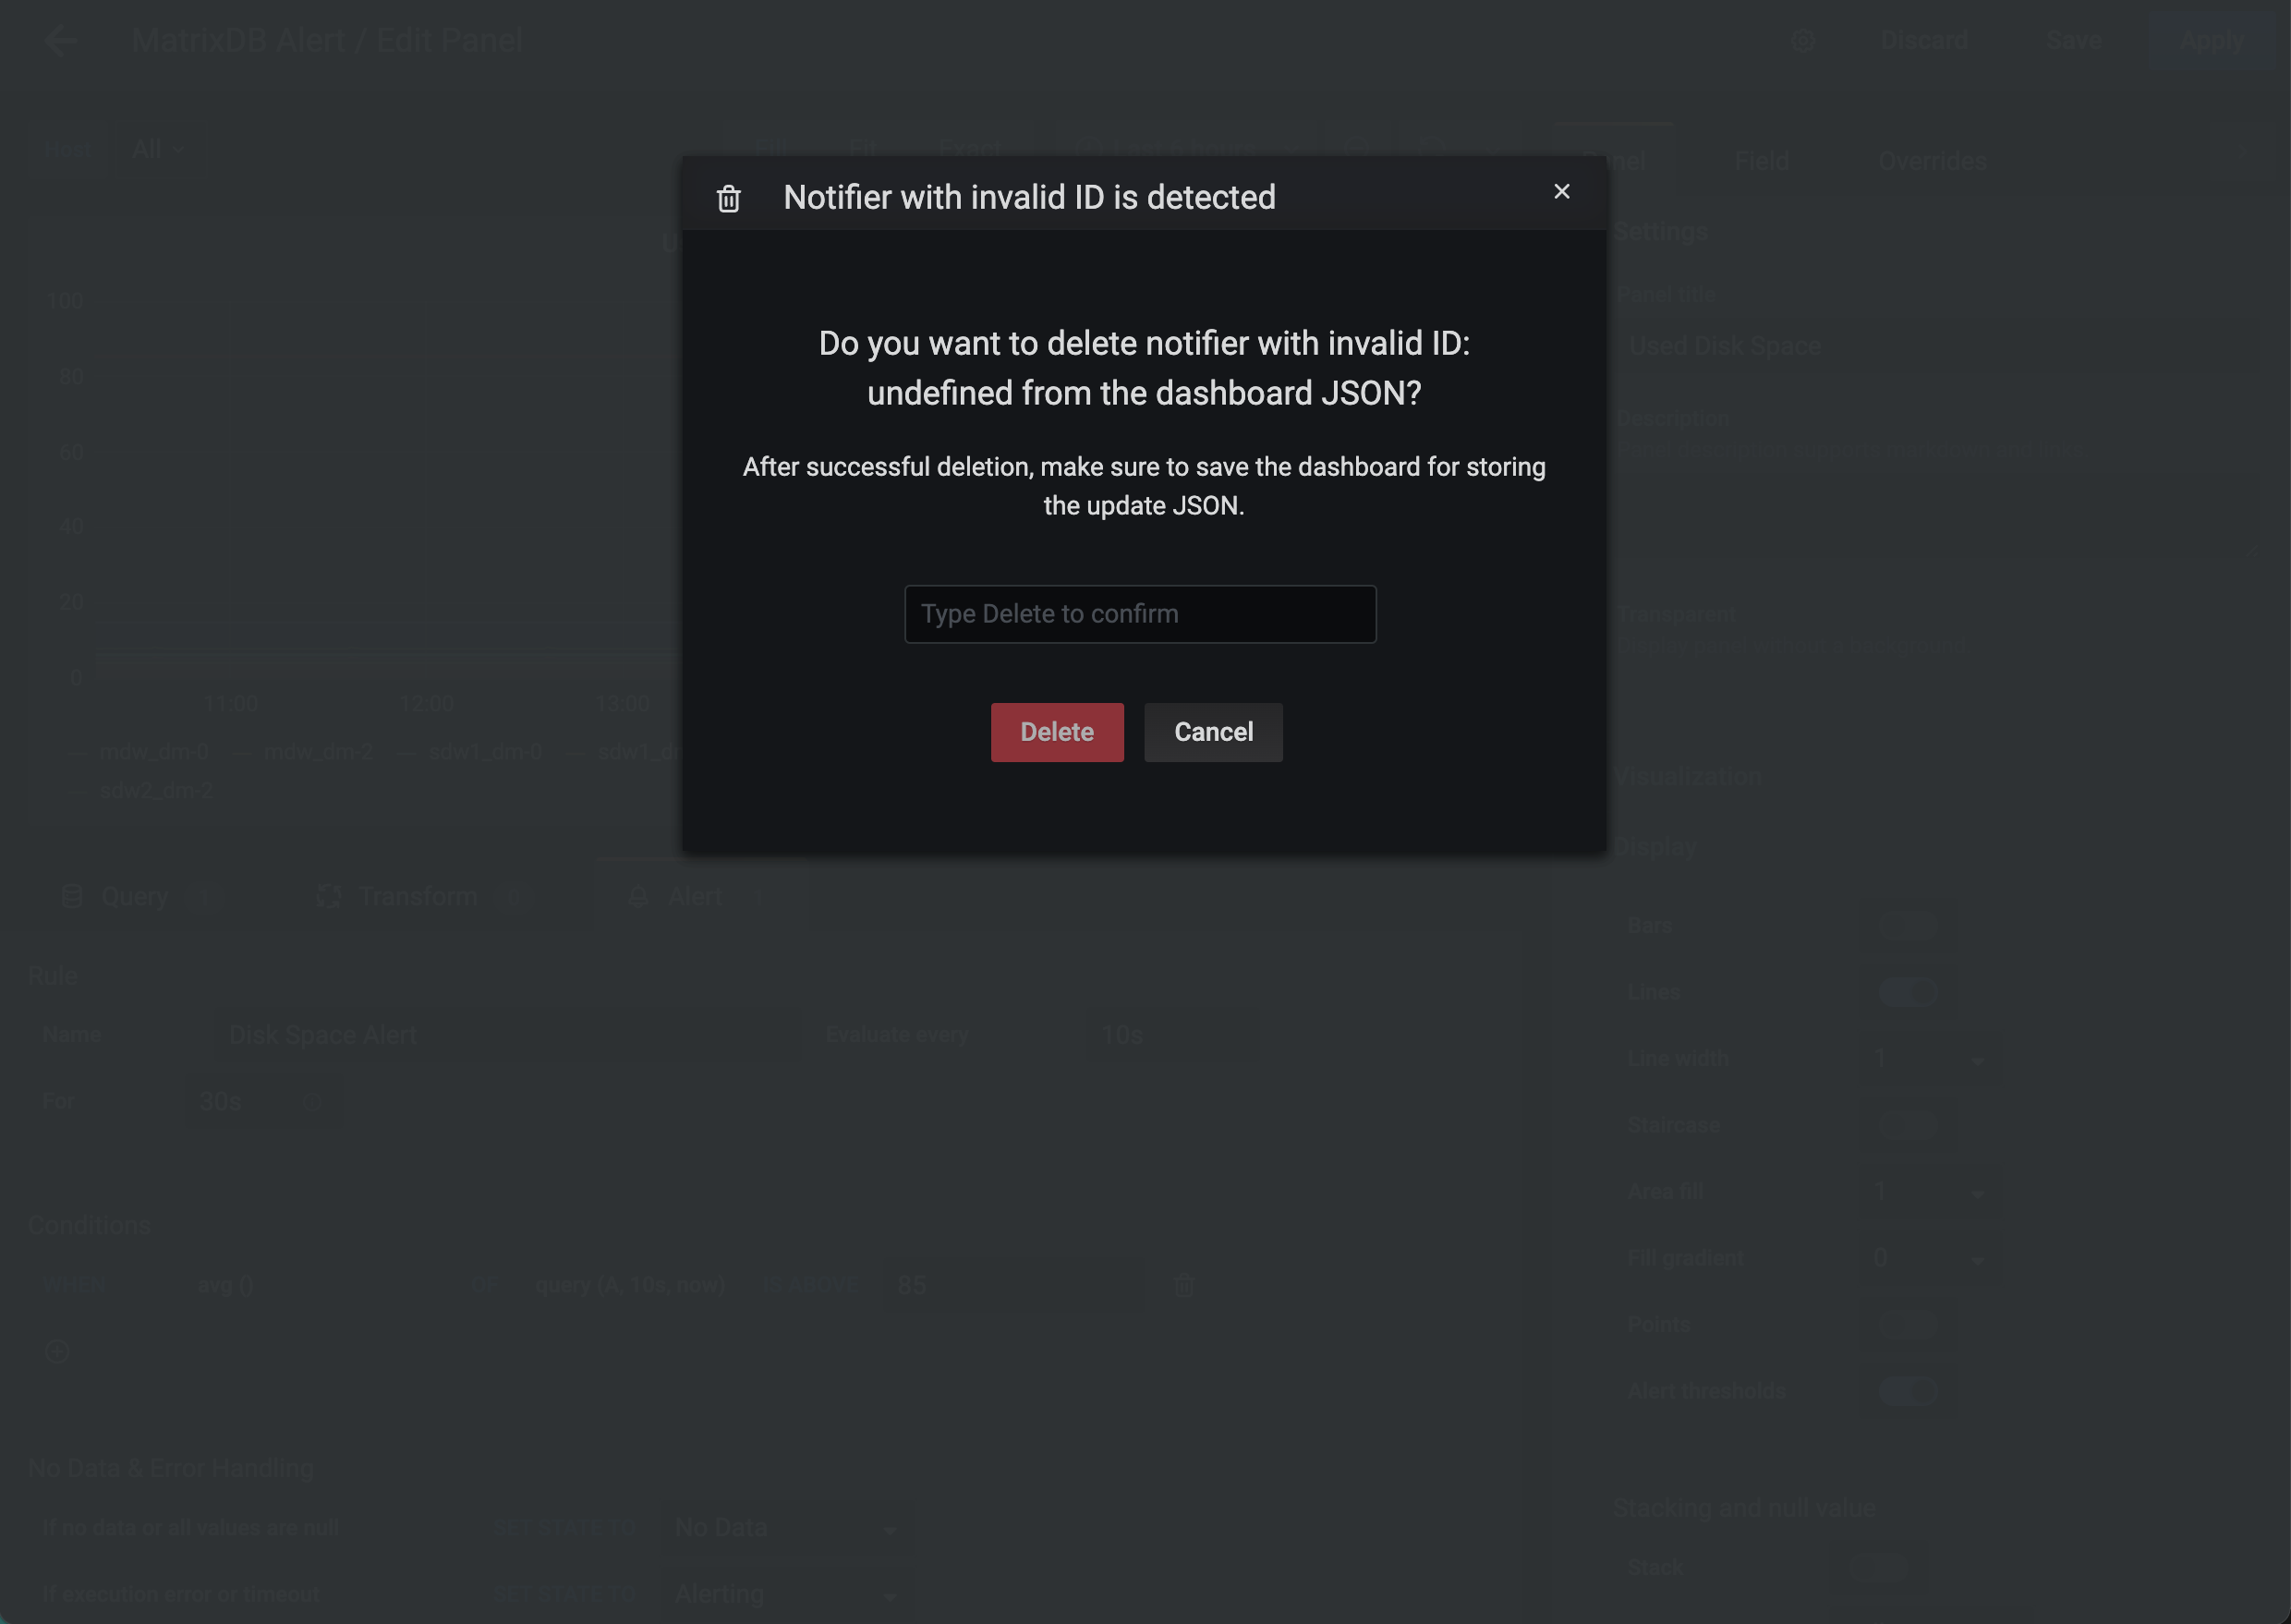
 Switch "Query" under "Edit Panel" to "Alert" menu. Please note that if a window "Notifier with invalid ID is detected" pops up at this time, please do not click "Delete", otherwise you may delete the panel and all previous efforts will be wasted. Click "Cancel" and close the window.
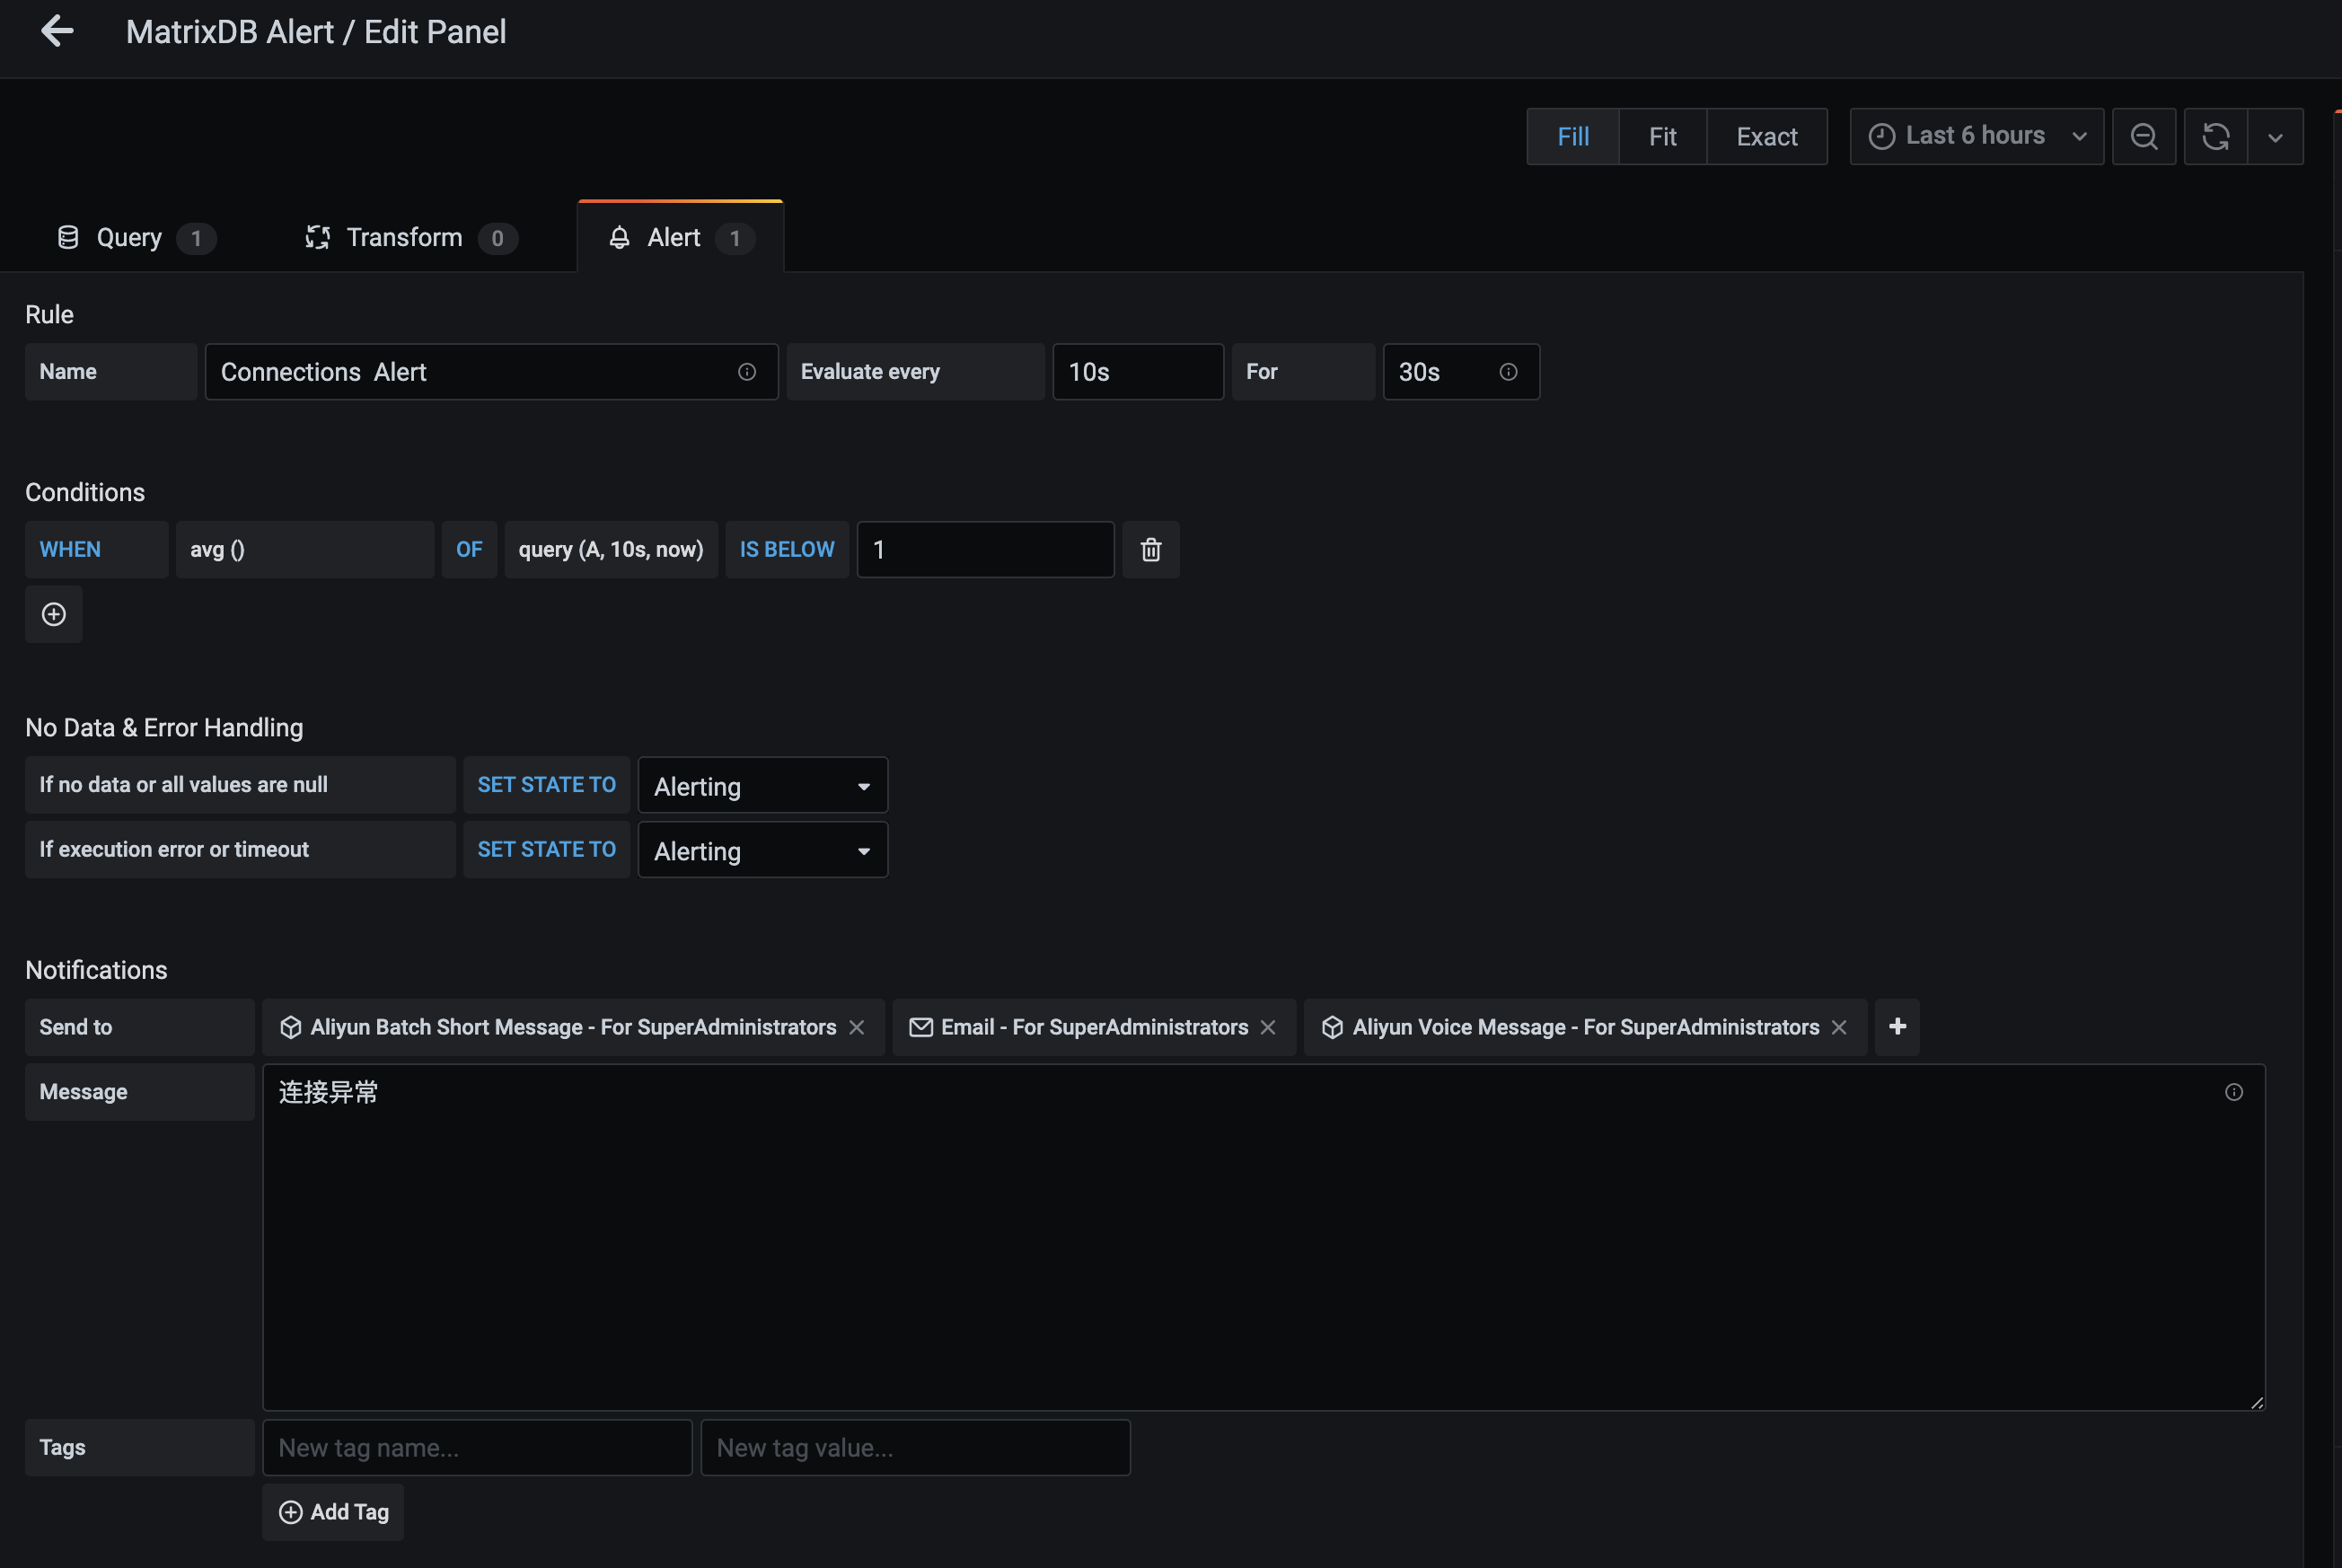
Slide down to see "Notifications". Please use concise phrases to describe the alarm prompt information. It is recommended to have four to six characters. This phrase will appear in the email and will be sent to the administrator as a built-in variable in the text message and voice template. There are restrictions on the number of text messages and pronunciation words, and do not exceed the length. At the same time, flexible select the Sent to option according to your needs, that is, one or more alarm channels you just configured through the above many instructions.

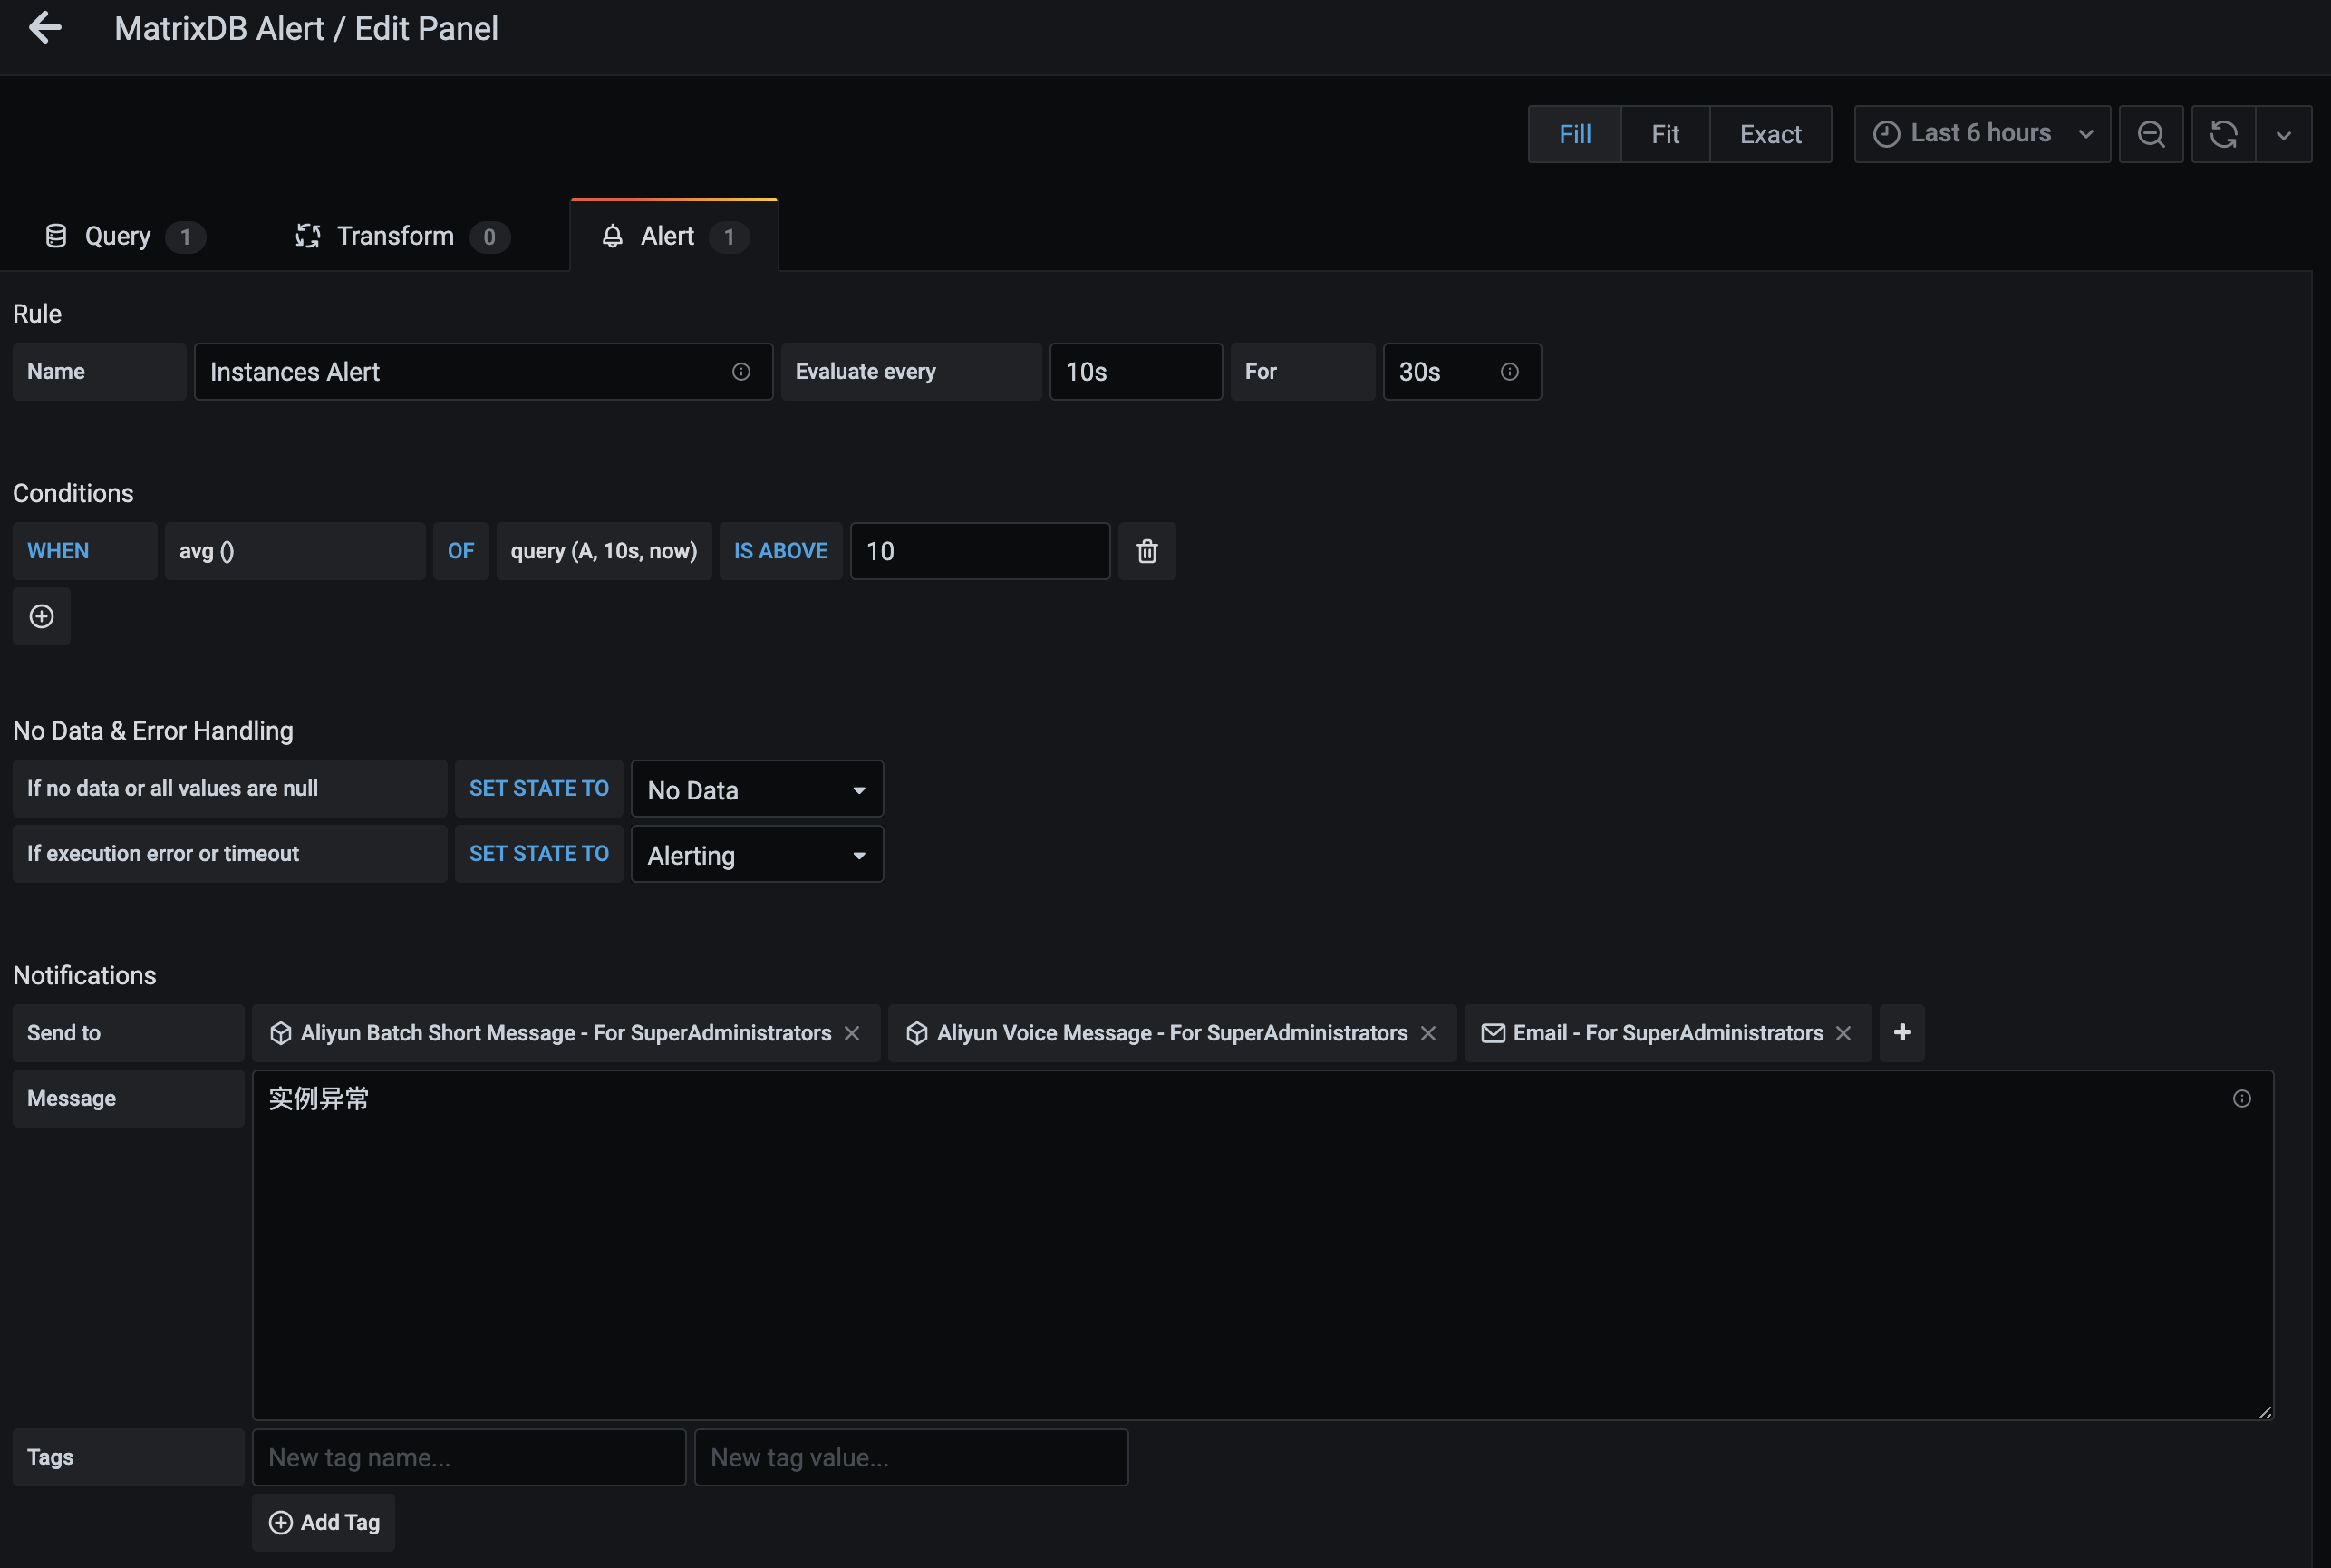
The time series database aggregates data over a period of time. Perhaps due to time problems, data is not obtained during aggregation. For example, Grafana time is five minutes ahead of the system time, and data of the last minute is aggregated. In this case, there will be no data. In addition, there is a problem with data collection and not being written to the database normally will also cause No Data. The processing of the "No Data" situation is "Allerting".
As shown in the figure:
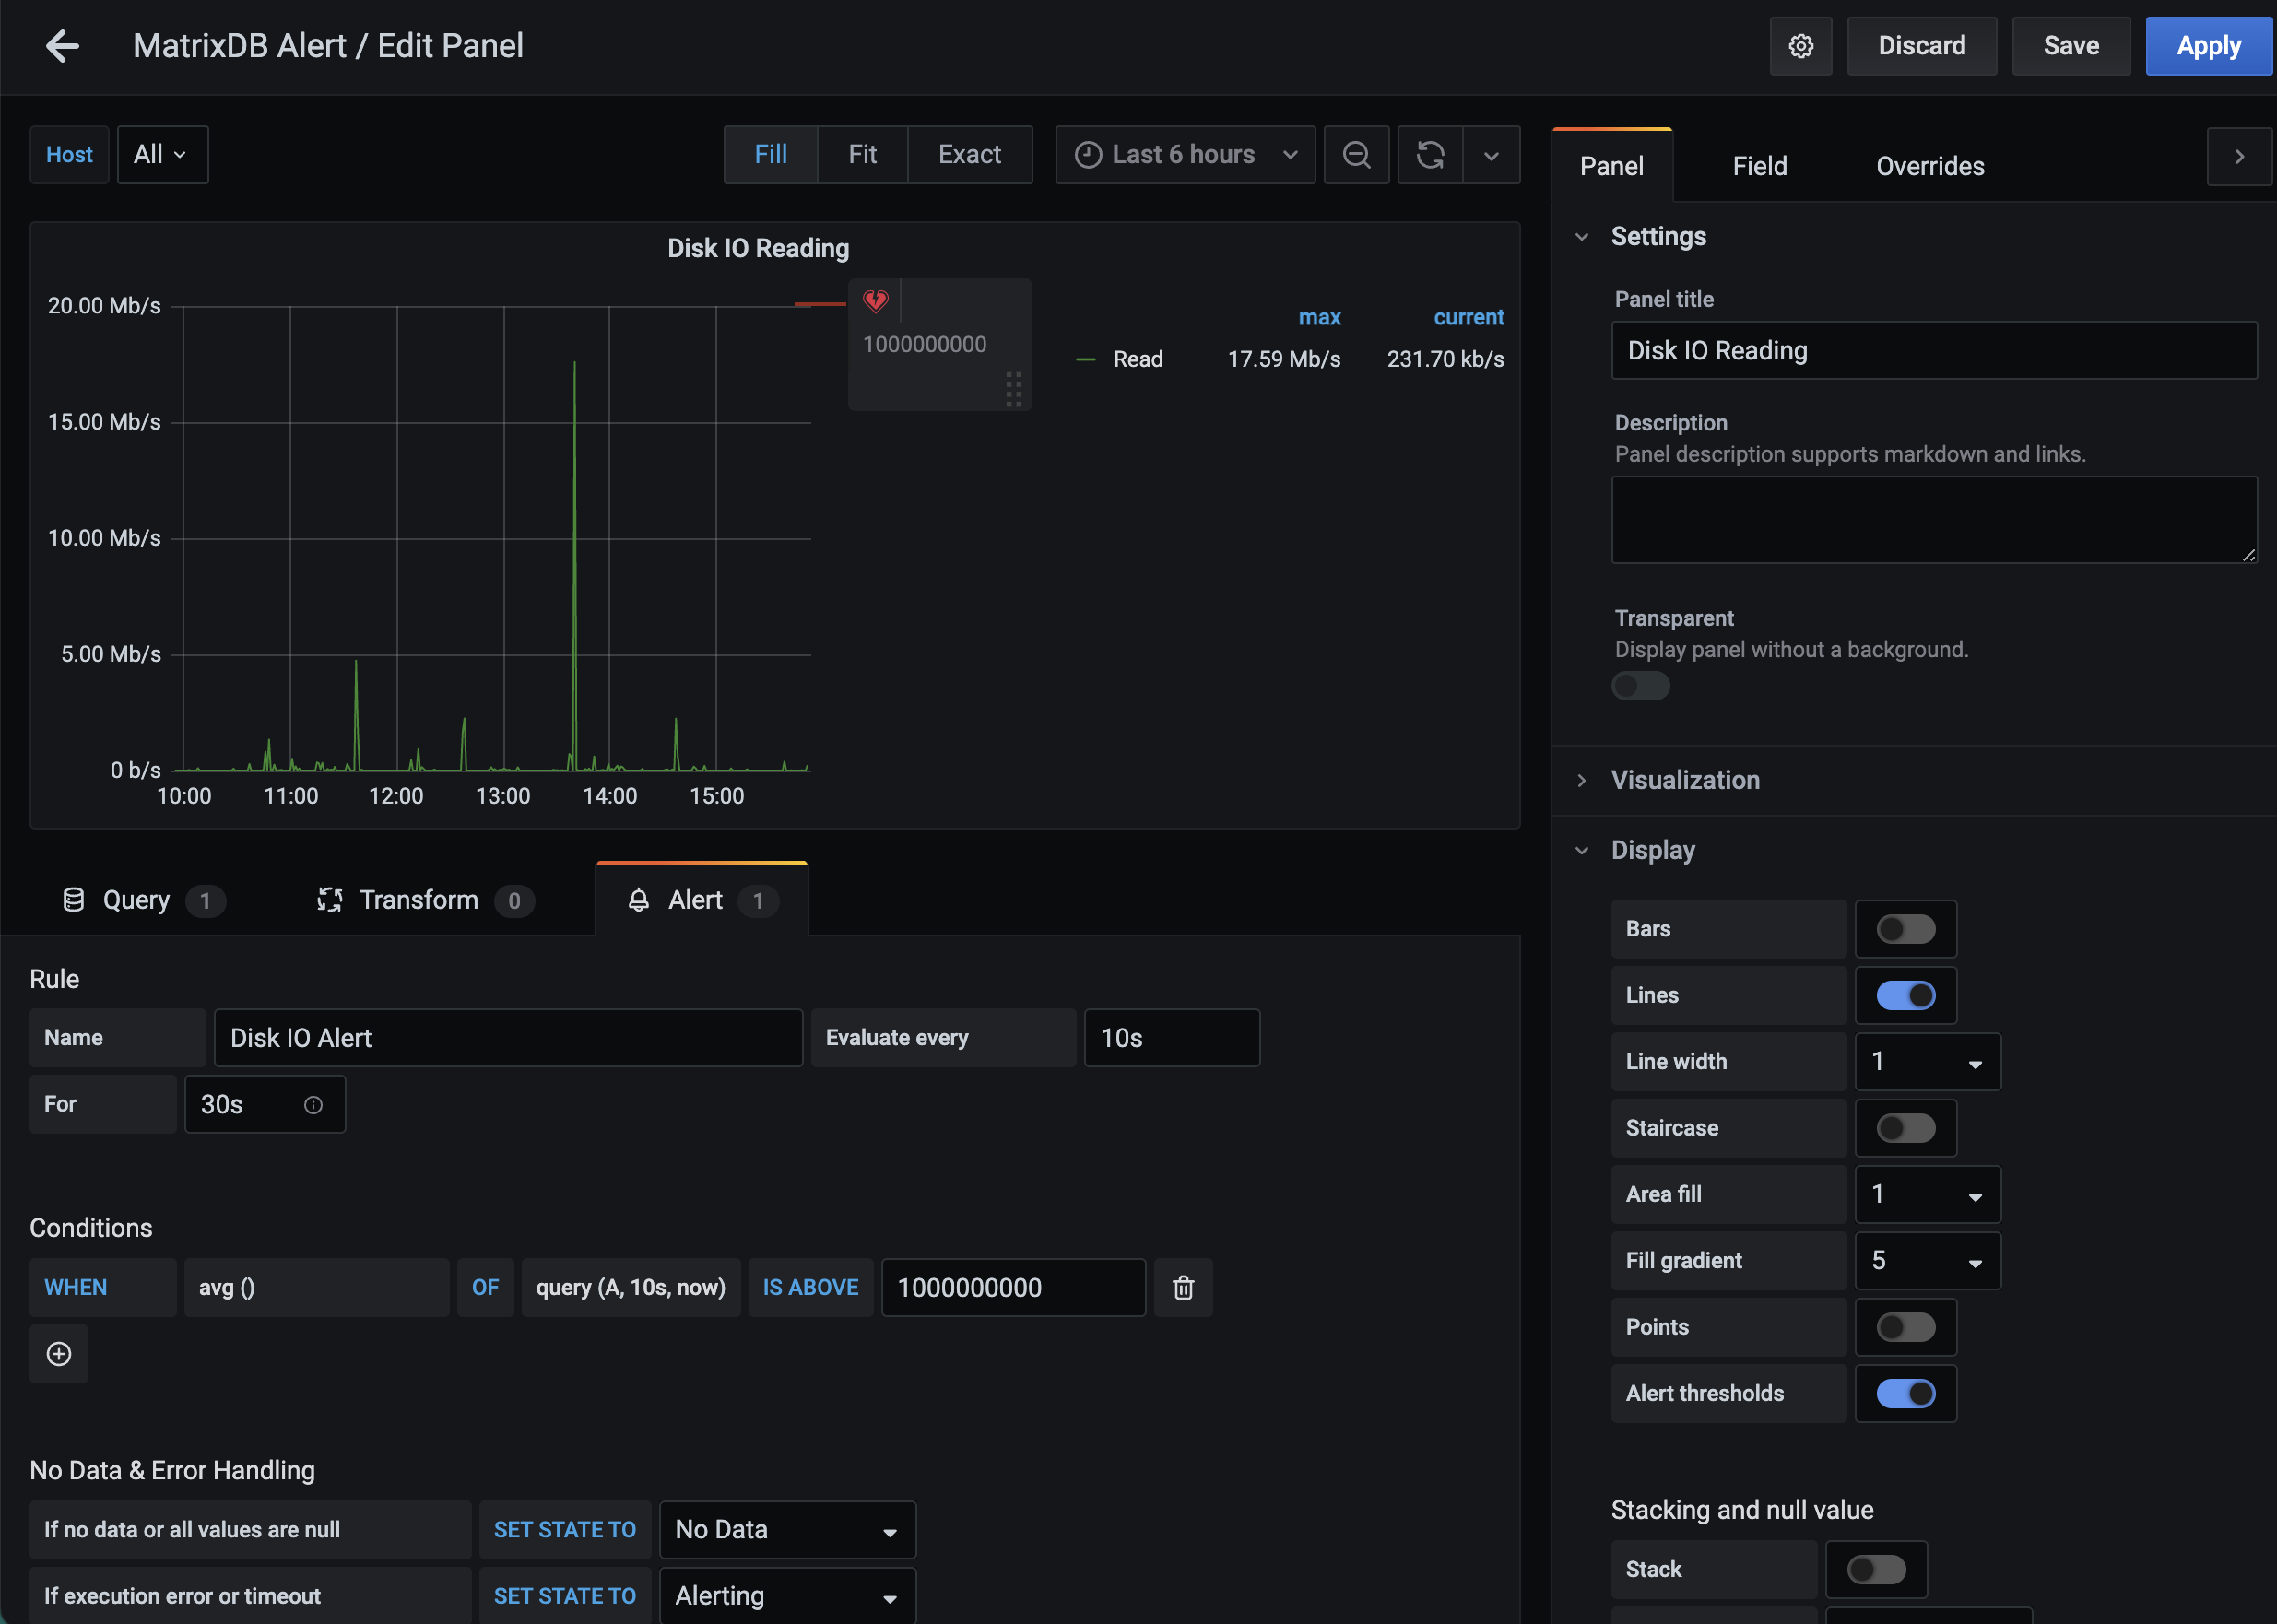
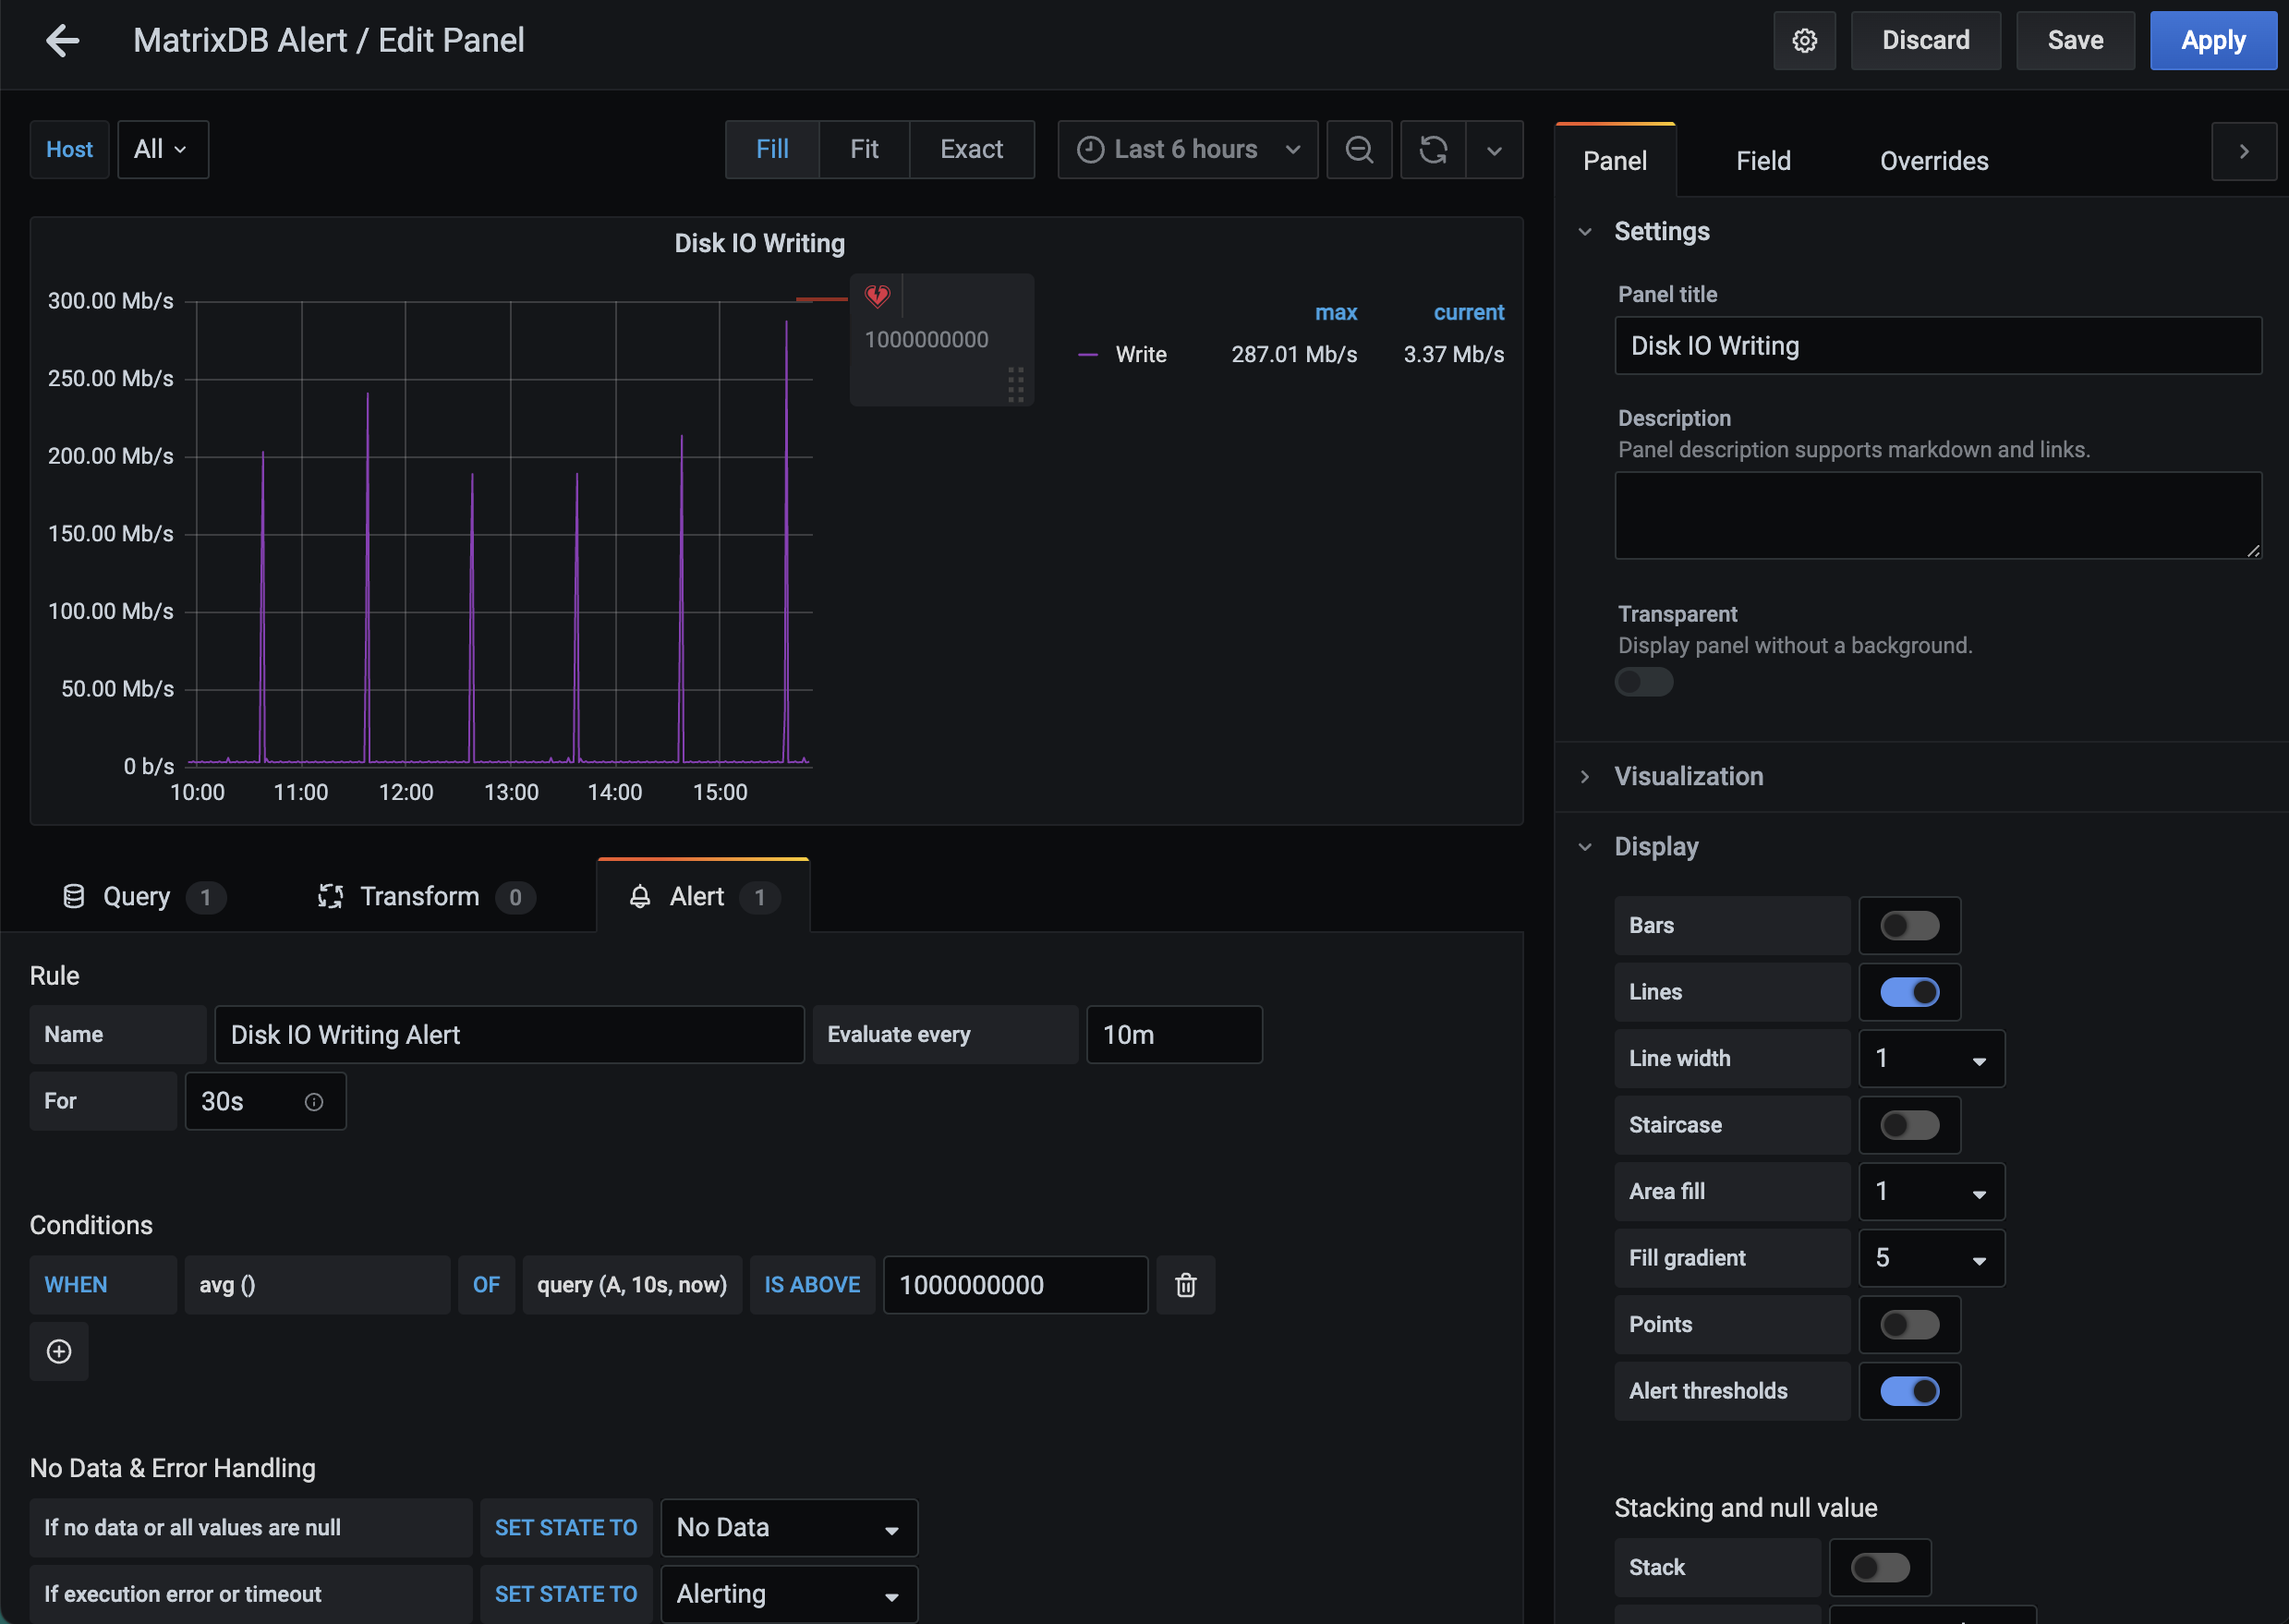
The red cordon of Used Disk Space is the trigger value of the alarm setting. The red shaded part has exceeded the cordon and is a red signal. We give an 85% alarm default value, and you can also customize "IS ABOVE" according to your needs.
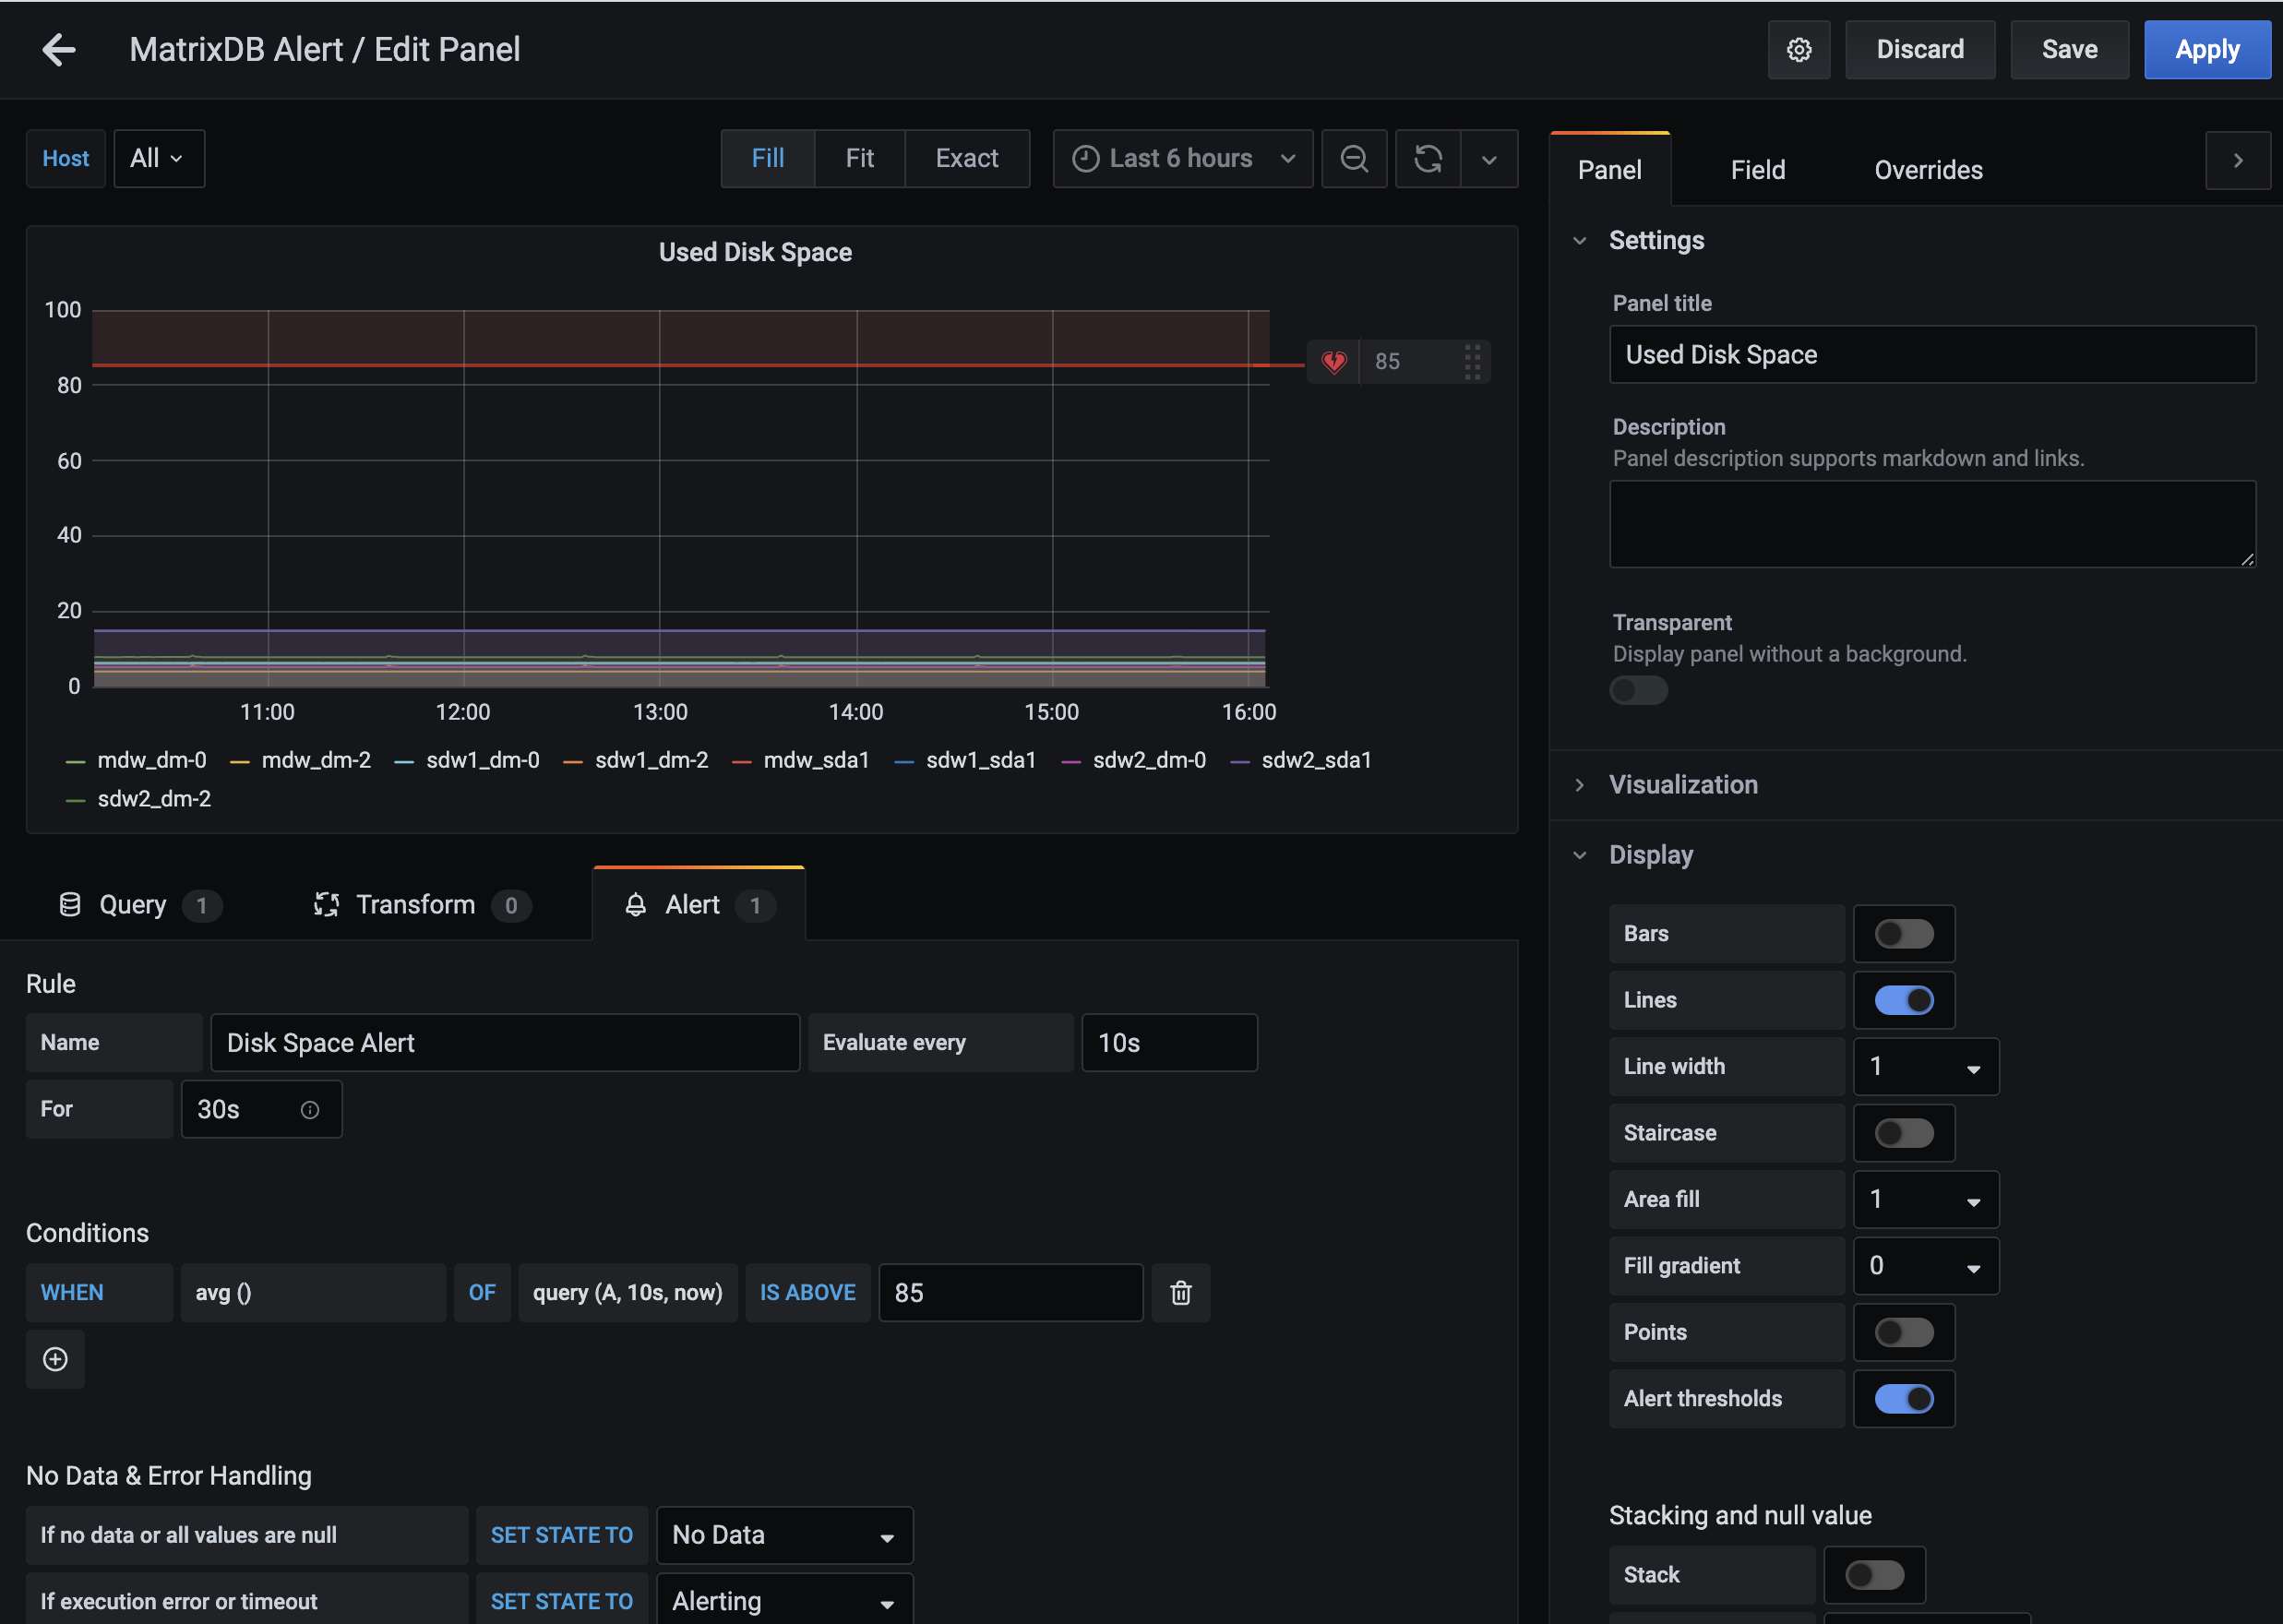
Disk IO Reading and Disk IO Writing default value is not alarming, giving you sufficient custom threshold space.
source /usr/local/matrixdb/greenplum_path.sh
supervisorctl stop mxui
supervisorctl start mxui